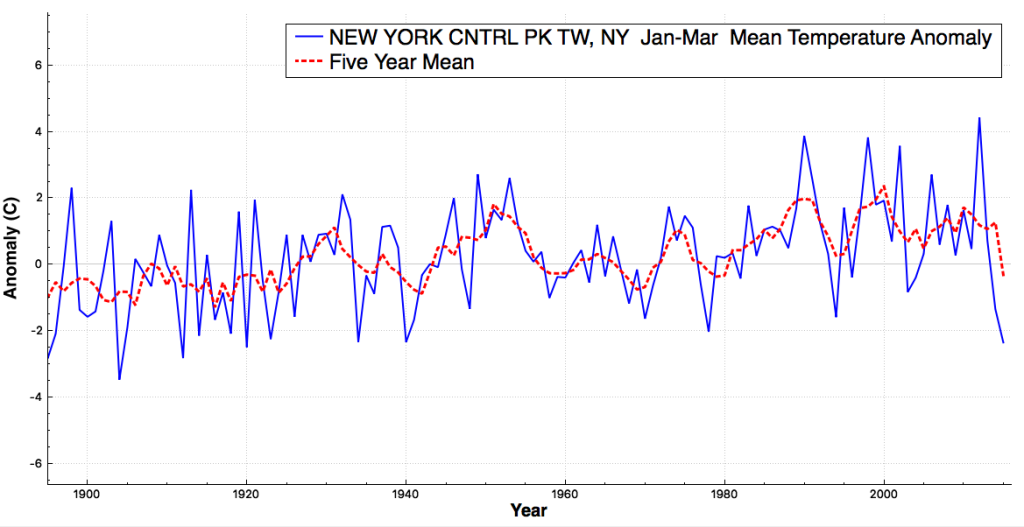
December 2015 was warmest on record in New York City. Experts say this is due to global warming.
January-March 2015 was the coldest in a century in New York City. Experts also said this was due to global warming.

December 2015 was warmest on record in New York City. Experts say this is due to global warming.
January-March 2015 was the coldest in a century in New York City. Experts also said this was due to global warming.

The AGW definitions of climate vs weather used to be easy to understand.
Heat Wave = Climate. Cold snap = Weather.
Now they’re calling both climate. And both are caused by AGW. No make that Climate Change. I guess.
It’s getting hard to keep up with the latest advances in science.
Agree! There’s a huge difference between climate and weather, as shown here, also: http://oceansgovernclimate.com/weather-and-climate-do-they-know-what-they-are-talking-about/.
The Tmin for all of the US northeast shows J-M 2015 was the coldest ever recorded. This is from NOAA no less.
http://www.ncdc.noaa.gov/cag/time-series/us/101/0/tmin/3/3/1895-2015?base_prd=true&firstbaseyear=1901&lastbaseyear=2000
Global warming can do anything.
Can your software generate a graph like that? I’m curious what the unadjusted data would show. I know they have adjusted the past colder there.
http://www.ncdc.noaa.gov/temp-and-precip/divisional-comparison/
I’m curious how much different the raw data would show. In any case, it was the coldest, according to even the adjusted data.
The software can do it, but I am not enabling that in the interface because of the amount of bandwidth required. I don’t want NOAA to shut down access to the data.
It would cause a bandwidth drain on NOAA? Or your server? I don’t want NOAA or anyone else to shut down access to data either.
As for the web interface, It’s really cool that you are doing this.
Can you send me a link to the Beta version? I promise not to abuse it.
Can you access the daily Great Lakes Ice Data from ~ 2/22- 3/10/2015? It looked like some more ‘adjustment’ happened. Imogene that!
Look, Central park is getting colder because of Deniers. Every time someone says “I don’t believe in anthropogenic global warming,” a heat fairy begins to die. To save her, all of the good people all over the world have to click their heels together, snap that right arm out palm down, 22.5º above the horizontal and shout “Heil Erde!” three times or else she’ll die and it’ll be YOUR fault.
Hell everything else in the world is our fault anyway. Doesn’t matter what we do or not do.
So just add another atrocity by white angry anglo males to our all ready indescribably long rap sheet.
None of the latter part of those two graphs makes any sense to me but it is becoming very hard to keep up with the latest settled science from CAGW.
Global warming?
Climate change?
Climate chaos?
Climate disruption?
The product hasn’t sold so far so the latest try is for extreme weather events. People might buy that because they live in the moment and today’s blizzard is terrible and is felt by its immediacy, while a blizzard from a couple decades ago is old news and doesn’t seem so bad as its impact is blurred by the gently healing of time.
Give them time and they’ll come up with some new and improved label to add to the list.
OT, but Josh nails it again. (see wuwt for full story)
https://wattsupwiththat.files.wordpress.com/2016/01/green_limited_scr.jpg
Does the outlier in 1989 prove global cooling? Why does not a cold outlier mean the same as a warm outlier?