Last summer, University of California scientists made this hysterical claim about the Zachariae Isstrom glacier in northeast Greenland.
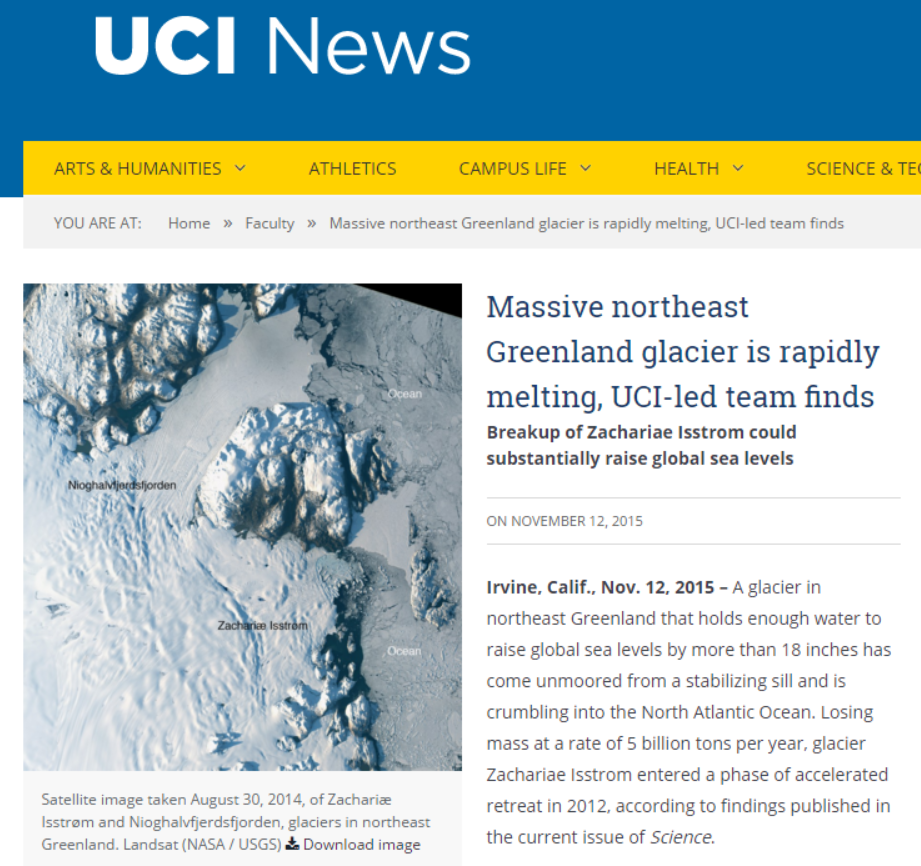
Massive northeast Greenland glacier is rapidly melting, UCI-led team finds
It’s a great story, only problem is it is a complete fabrication. If anything, the glacier has grown since 2012.
2012: EOSDIS Worldview 2015 : EOSDIS Worldview
In 1940, scientists reported that glaciers in Northeast Greenland were receding very rapidly, and were “nearing a catastrophe.“
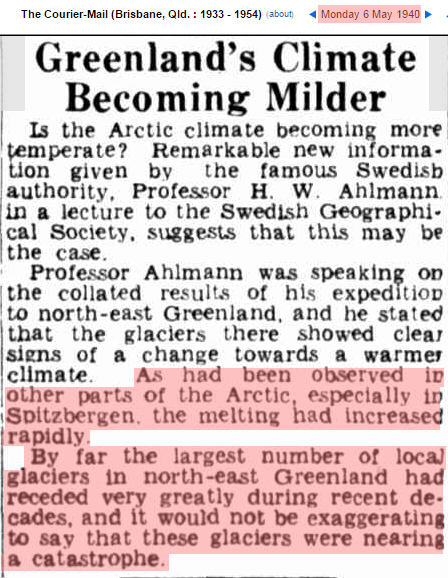
06 May 1940 – Greenland’s Climate Becoming Milder – Trove
The glaciers are still there, there is no catastrophe, and the only thing that has changed is that the fraudsters at NASA have erased the 1940’s warmth in that region.
If the glaciers were receding rapidly in 1940 and are not now, then it must have been warmer in 1940 than it is now. But logic and data are not a part of the criminal venture known as “climate science.”
“If the glaciers were receding rapidly in 1940 and are not now, then it must have been warmer in 1940 than it is now. ”
Makes perfect sense to me.
Thanks for holding their feet to the fire, Tony.
Yes the warm side of the previous PDO cycle (~1917-47) was obviously warmer than the last one (~1978-2007) despite a more active sun during most of the latter period. This suggests a declining climate temperature that most do not notice due to their choice of attention span and constant programing to see the opposite.
Fewer still (even historians) seem to notice the declining peak temperatures and lengths of the quasi-millennial warm periods. Roman Warm Period ~700 yrs (~250BC to 450AD) Medieval Warm Period ~350 yrs (~950-1300) and so called Modern Warm Period ~175yrs?? (~1850-20??)
If anything governments should be preparing humanity to survive the oncoming ice age, not misdirecting them to expect warming.
….. so called Modern SLIGHTLY Warm Period . !!
There was a strong spike in the 1930’s and 40’s
http://www.climate4you.com/images/PDO%20AnnualIndexSince1900%20With7yearRunningAverage.gif
larger than the present one, but the period of the oscillation was shorter.
I believe there was less total energy accumulated in the oceans at that time.
http://www.climate4you.com/images/PDO%20AnnualIndexSince1900%20With7yearRunningAverage.gif
North Atlantic sea temperatures are dropping rapidly
If you are in the NH.. buy blankets, stock up on wood for burning.
+1
The last chart I saw showed the North Pacific SST’s to be dropping rapidly as well.
http://www.esrl.noaa.gov/psd/map/images/sst/sst.daily.anom.gif
Can’t stock up on too much wood here in northwest Florida or the Formosan termites will eat it all up :)
What do they taste like cooked ? :-)
I’m in the NH (New Hampshire, that is :) and we’re still running our pellet stove. Had snow here a week or two ago, which is not unheard of. Definitely a cooler Spring than we’ve seen in recent years.
Very nice late April down here. A degree or so above average for Autumn.. Fine and sunny all the way. :-)
How come people promote data
from organisations they reckon
lie about data?
Is this a reasonable question?
Because an organization like NASA or the NOAA is a massive bureaucracy, the agencies are dominated by people who have a mostly political view about ‘climate change’ where they claim there is this constant ‘warming’ and the climate doesn’t really naturally fluctuate between war and cold. But certain dominant actors in these these orgs can only fudge so much. For example the EOSDIS photos that TH shared. The technology exists so that the earth can constantly be photographed and those photos can not be hidden from public view since the satellites were paid for by taxpayers. When politically driven articles appear in major newspapers about this ‘melting ice’, that is backed by questionable papers that claim ice is ‘melting’ but with only a certain degree of reliability that doesn’t prove the ice is really melting just that well maybe its melting more than its freezing since its always melting and freezing.
Is the principle of cross-examination of evidence foreign to you?
Isn’t this a logical follow up question?
“Is this a reasonable question?”
Yes.. because quite often even their own data shows they are lying.
Good point, if anything, they’ve juiced the data to enhance warming. Nevertheless, it’s perfectly reasonable to use an opponents statements against that opponent.
http://pubs.usgs.gov/pp/p1386c/p1386c.pdf
See page C65 of the link for a 1976 Landsat image of the Zachariæ Isstrøm and Nioghalvfjerdsbrae.
Your satellite photo is of Nioghalvfjerdsbrae and the 1976 image shows that the glacier has retreated very little in the last 40 years despite the branch to the north (Spaltegletscher) possibly having retreated somewhat more; it is difficult to see where that glacier ends and the fast ice begins in the 1976 image.
I also notice Eric Rignot is involved: to him all ice sheets are uncontrollably breaking up.
Billy , I’ve extracted that figure and tried to match the orientation to very first picture in the blog
They are best viewed side by side, open two windows
Does it look any different after 40 years to you?
Since we’re not in Kansas anymore, is there any chance somebody could magic a picture of Zachariæ Isstrøm out of a hat here?
Zachariæ Isstrøm? There’s this:
http://earthobservatory.nasa.gov/IOTD/view.php?id=87086
I couldn’t find any references older than 1999 though, so, I am not yet frightened enough to buy any carbon credits. The slightly longer history probably looks like the Jakobshavn glacier? It doesn’t look like CO2 is the control knob for that one:
https://svs.gsfc.nasa.gov/cgi-bin/details.cgi?aid=3395
I should have read at least a few posts. Billy Liar posted a link to a pdf with a 1976 picture of Zachariæ Isstrøm.
the pic below is lifted from Billy’s link.. Thanks Billy
Can you provide a magnifying glass.?
Its such an itsy bitsy part of the Greenland coast.
1976 was the very coldest part of the AMO cycle.
Yet if you look at this picture, you will be hard pressed to find much difference at all.
Again Jimbo the CON merchant, and his Arctic SCARE buddies, are trying to make a mountain out of a grain of sand..
Yet Jimbo, being the base-level LIAR he is, is totally unable to admit that the Arctic and Greenland had MUCH LESS ice during the first 3/4 of the Holocene, and that the only reason there is currently SO MUCH glacier and sea ice is because we are really not that much above THE COLDEST PERIOD IN THE LAST 10,000 YEARS
Andy – Since you’ve finally managed to locate the right glacier perhaps Tony should now replace his animation with one based on the high res images kindly provided by NASA?
PMC – Would it surprise you to learn that the supplementary materials to the Mouginot et al. paper referred to in Tony’s first link contains a series of Landsat images of Zachariæ Isstrøm going back to 1975?
http://science.sciencemag.org/content/suppl/2015/11/11/science.aac7111.DC1
YAWN !
Once you have the GUTS to admit that Arctic sea ice and Greenland glacier are BOTH anomalously HIGH compared to the rest of the Holocene, then you might be worth more than a remote slagging.
Until then , all ANYONE can say is that you are monumental LYING PROPAGANDIST.
Admit the TRUTH.. for ONCE IN YOUR PUTRID LIFE.
I DARE you. !!!
The thing is, that you KNOW that the mid-late 1970’s was the base of the AMO, and that is all you have to support your BASELESS Arctic/Greenland glacier HYSTERIA.
DENY the facts all you want…… Its what you do.
LYING is embedded in your very soul.
Jim – You knew where to find ancient images of Zachariæ Isstrøm and still asked. No, I am not surprised.
One glacier has retreated over a very short time period, the glacier next door doesn’t appear to have changed much lately, and no evidence the retreating one was stable before humans started pumping plant food into the atmosphere. I’m terrified! Please tell me how to fix this! Oh, right, taxes and carbon credits.