No Global Warming For 25 Years

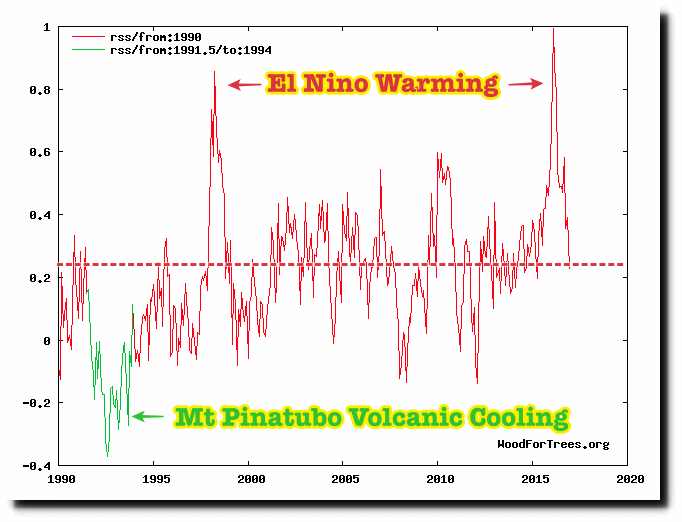
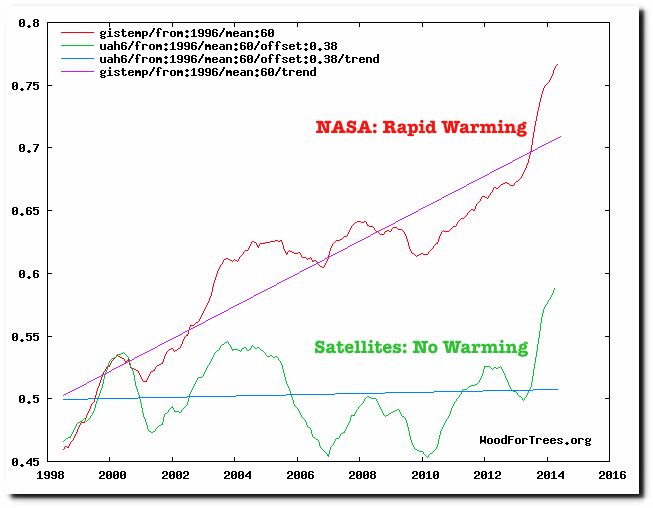
Earth is the same temperature as 25 years ago. All temperature variations since then are artifacts of El Nino and volcanic eruptions.

Wood for Trees: Interactive Graphs

Global warming is the biggest fraud in science history. The Earth is not warming.

Wood for Trees: Interactive Graphs

This entry was posted in Uncategorized. Bookmark the permalink.

66 Responses to No Global Warming For 25 Years

  1. Steve Case says:


           Global Warming/Climate Change is mostly Fake News/Bullshit


  2. Brian G Valentine says:

    There was a sudden change in the baseline in 1997. Why did that happen? There is no reasonable explanation – other than calculation methods or weighting methods were changed in that year. That change has the same influence as a determinate error.

  3. Shooter says:

    Doesn’t matter. People will still see that as ‘the pause buster’.

    • CheshireRed says:

      La Nina is already underway and will deliver cooling from now on for at least a year. That means a 20 year Pause is now a certainty, which also means the entirety of human emissions of the last 18 years have counted for precisely nothing. Literally no impact on global temperatures. Given the value alarmists place on CO2 that’s an absolute hammer blow to their theory. The green blob will be absolutely furious.

      PS. This will unfold during Trumps policy-forming formative years. Oh dear oh dear, green blobbers. Whatya gonna do?

      • Hivemind says:

        Exactly what green blobbers always do:

        Double-down on the lies.

        • Brian Richard Allen says:

          There being none more skilled at lying than those psychopaths of the fascist Left, who, for two-hundred and forty years already, have made their livings breeding and creating and cultivating their sociopathic and simpleton base. Too damned not a typo dumb to know its being lied to and/or too darned mean-spirited and/or greedy, to care.

  4. Aurora Svant says:

    I would be very cautious towards the temperature measurements from satellites since a couple of years ago, they look like they began to be doctored as well.

  5. Tab Numlock says:

    This is bad news. Looks like the promised warming from increased CO2 will never materialize. We’ll just have to be happy with increased crop and forest yields. Bummer.

  6. PAUSE / HIATUS is the biggest trick the Warmist pulled on the most ignorant fakes… 2] by saying that; ”no warming for 15y, for 17y and 3 months” = they made the maggots to advertise that the PHONY GLOBAL WARMING EXIST. Same as Santa is got a PAUSE / HIATUS between January and December. VERDICT; the maggots still prospering on the carcass called ”western democracy” gave victory to the extremist Warmist; by promoting the the NON-EXISTENT GLOBAL WARMING exist, but is got a PAUSE – and you public know that no PAUSE is forever, when the stupid PAUSE is over, only the Warmist mafia can save you… = the biggest criminals in the new millennia are the PAUSE MAGGOTS…

  7. gregole says:

    For all the alleged catastrophe that is Global Warming; there doesn’t appear to be much actual Global Warming…

  8. Scott Vlaun says:

    Get your head out of the graphs and look around you people. Oceans are rising at a rapidly accelerating pace with many coastal communities experiencing sunny day floods. Arctic Ice and Mountain glaciers are disappearing at many times the rate of normal cycles. Average Ice-out on lakes in NA is 3 weeks sooner than preindustrial levels and getting to the point where some lakes barely freeze over. This is unprecedented. Extreme weather events are 50 to 1oo% more common than even 30 years ago. Ocean acidification is killing off all the major reef systems in the world while species extinction is ten times normal background levels. Does the world need to literally be burning around you before you get your collective heads out of the sand?

    • tonyheller says:

      Utter nonsense. You are parroting propaganda with no basis.

    • AndyG55 says:

      What a load of total and utter BULLSHIT

      Oceans sea levels are NOT accelerating
      Arctice sea ice is nmore than it was for the same day last year.

      Greenland ice mass is growing rapidly

      Ocean acidification is a total LIE.

      Mann.. you Seriously have been SUCKLED IN by the alrarmista propaganda BULLSHIT haven’t you.

      I DARE you to try to back up any of your MORONIC claims with actual data. !!!

      Come on Scott.. you will get REAMED. !!

      Perhaps that is what you want.

      • Gail Combs says:

        AndyG, I just did the reaming, not that Scotty-poo is capable of actually reading and understanding scientific studies.

    • Hivemind says:

      Did I predict that the green blobbers would double-down on the lies, or did I predict that they’d double-down on the lies?

      Case proven.

      • Gail Combs says:

        VALIDATION BY ALTERNATE STUDIES
        GLACIAL ADVANCE
        STUDY #7
        Ice free Arctic Ocean, an Early Holocene analogue

        Abstract
        Extensive systems of wave generated beach ridges along the North Greenland coasts show that these areas once saw seasonally open water. In addition to beach ridges, large amounts of striated boulders in and on the marine sediments from the same period also indicate that the ocean was open enough for ice bergs to drift along the shore and drop their loads. Presently the North Greenland coastline is permanently beleaguered by pack ice, and ice bergs are very rare and locked up in the sea ice. Predictions of the rapidly decreasing sea ice in the Arctic Ocean generally point to this area as the last to become ice free in summer. We therefore suggest that the occurrence of wave generated shores and abundant ice berg dropped boulders indicate that the Arctic Ocean was nearly free of sea ice in the summer at the time when they were formed. The beach ridges occur as isostatically raised “staircases”, and C14-dated curves for relative sea level change show that they were formed in the Early Holocene. A large set of samples of molluscs from beach ridges and marine sediments were collected in the summer of 2007, and are presently being dated to give a precise dating of the ice free interval. Preliminary results indicate that it fell within the interval from c. 8.5 to c. 6 ka – being progressively shorter from south to north. We therefore conclude that for a period in the Early Holocene, probably for a millenium or more, the Arctic Ocean was free of sea ice at least for shorter periods in the summer….

        STUDY #8
        Temperature and precipitation history of the Arctic

        …. Solar energy reached a summer maximum (9% higher than at present) ~11 ka ago and has been decreasing since then, primarily in response to the precession of the equinoxes. The extra energy elevated early Holocene summer temperatures throughout the Arctic 1-3°C above 20th century averages, enough to completely melt many small glaciers throughout the Arctic, although the Greenland Ice Sheet was only slightly smaller than at present. Early Holocene summer sea ice limits were substantially smaller than their 20th century average, and the flow of Atlantic water into the Arctic Ocean was substantially greater. As summer solar energy decreased in the second half of the Holocene, glaciers re-established or advanced, sea ice expanded

        STUDY #9
        A new approach for reconstructing glacier variability based on lake sediments recording input from more than one glacier January 2012

        …. A multi-proxy numerical analysis demonstrates that it is possible to distinguish a glacier component in the ~ 8000-yr-long record, based on distinct changes in grain size, geochemistry, and magnetic composition…. This signal is …independently tested through a mineral magnetic provenance analysis of catchment samples. Minimum glacier input is indicated between 6700–5700 cal yr BP, probably reflecting a situation when most glaciers in the catchment had melted away, whereas the highest glacier activity [growth] is observed around 600 and 200 cal yr BP. During the local Neoglacial interval (~ 4200 cal yr BP until present), five individual periods of significantly reduced glacier extent are identified at ~ 3400, 3000–2700, 2100–2000, 1700–1500, and ~ 900 cal yr BP….
        (wwwDOT)sciencedirect.com/science/article/pii/S0033589411001256

        The highest glacier growth started 600 years ago prior to that most glaciers had melted away.

        THIRD METHOD OF VALIDATION
        STUDY #10
        Sea Level Changes Past Records and Future Expectations

        For the last 40-50 years strong observational facts indicate virtually stable sea level conditions. The Earth’s rate of rotation records an [average] acceleration from 1972 to 2012, contradicting all claims of a rapid global sea level rise, and instead suggests stable, to slightly falling, sea levels.

      • Gail Combs says:

        Sorry, these got stuck under the wrong comment. Meant to go under Scotty-poo’s.

    • Gail Combs says:

      Scott Vlaun you are full of Bovine Feces.

      TEN PEER-REVIEWED PAPERS PROVING SEA LEVEL IS NOT RISING
      and why the WIKI sea level graph is wrong.

      STUDY #1
      Mid to late Holocene sea-level reconstruction of Southeast Vietnam using beachrock and beach-ridge deposits

      ….backshore deposits along the tectonically stable south-eastern Vietnamese coast document Holocene sea level changes…..reconstructed for the last 8000 years….The rates of sea-level rise decreased sharply after the rapid early Holocene rise and stabilized at a rate of 4.5 mm/year between 8.0 and 6.9 ka. Southeast Vietnam beachrocks reveal that the mid-Holocene sea-level highstand slightly above + 1.4 m was reached between 6.7 and 5.0 ka, with a peak value close to + 1.5 m around 6.0 ka….

      Translation the sea level was up to 1.5 meters higher than today in a tectonically stable area ~5000 years ago to 2000 years ago. Tectonically stable area refers to areas devoid of deformation such as all processes which modify the external form of the crust. For example unidirectional vertical movements, plate tectonics and also the rise and fall of the solid earth surface, especially in coastal areas, caused by external factors such as climate change (gio-isotasy, hydro-isotasy)

      STUDY #2
      Sea-level highstand recorded in Holocene shoreline deposits on Oahu, Hawaii

      Unconsolidated carbonate sands and cobbles on Kapapa Island, windward Oahu, are 1.4-2.8 (+ or – 0.25) m above present mean sea level (msl)…we interpret the deposit to be a fossil beach or shoreline representing a highstand of relative sea level during middle to late Holocene time. Calibrated radiocarbon dates of coral and mollusc samples, and a consideration of the effect of wave energy setup, indicate that paleo-msl was at least 1.6 (+ or – 0.45) m above present msl prior to 3889-3665 cal. yr B.P, possibly as early as 5532-5294 cal. yr B.P., and lasted until at least 2239-1940 cal. yr B.P
      jsedres(DOT)geoscienceworld.org/content/66/3/632.abstract

      This study shows a sea level highstand ~1.6 meter above the present level from ~5500 years ago to 2000 years ago.

      STUDY #3
      Late Quaternary highstand deposits of the southern Arabian Gulf: a record of sea-level and climate change

      Abstract
      …..It has therefore been necessary to infer the ages of these sediments by a comparison of their stratigraphy and elevation with deposits known from other parts of the world. We regard this approach as valid because the southern Gulf coastline lacks evidence for significant widespread neotectonic uplift,…….
      …..Widespread evidence exists for a Holocene sea level higher than at present in the southern Arabian Gulf, indicating that it peaked at 1–2 m above present level, c. 5.5 ka bp……. sp(DOT)lyellcollection.org/content/195/1/371.refs

      This study shows a sea level highstand ~1 to 2 meters above the present level about ~5500 years ago.

      STUDY #4
      The Quaternary Geological History of the Santa Catarina Southeastern Region (Brazil) 1999

      The first part discusses drilling in several locations and analyzing samples. They mention dating prior to that was guesses. “…. A drilling campaign done in the domain permitted the sampling of material for 14C datings, and the obtained data confirmed some previously assumed ages. The sequence of events, that originated the Holocene deposits, has been also reconstructed through drilling and 14C dating of the collected peat and shell samples…”

      In the body of the text is this:

      THE HOLOCENE DEPOSITIONAL SYSTEM
      Partially abutted against the Pleistocene barrier island/lagoonal system III, there is the Holocene depositional system. This unit is attributable to the Santos Transgression of Suguio & Martin (1978), along the State of São Paulo coastline, or to the Last Transgression of Bittencourt et al. (1979) along the State of Bahia coastline, being similar to the barrier island/lagoonal system IV of Villwock et al. (1986), along the State of Rio Grande do Sul coastline.

      This system is related to the post-glacial transgressive episode whose culmination stage was attained about 5.1 ky BP, when a barrier island alignment was formed parallel to the shoreline, while drainage net was drowned. The subsequent regressive episode promoted the barrier island progradation following the lagoonal basin silting.

      The paleoshorelines limited by ancient cliffs carved within Pleistocene terraces, presently representing the inner limit of the Holocene terrace, shows that this sea-level reached about 4m above the present one. Several terraces situated in different altitudes, and truncation of past morphological features nowadays observed on Holocene deposits, as well as along present lagoonal margins suggest that small scale sea-level oscillations occurred during the last 5 ky….
      (wwwDOT)scielo.br/scielo.php?pid=S0001-37652000000200011&script=sci_arttext

      This study shows a sea level highstand ~ 4 meters above the present level about ~5000 years ago. With sea level oscillating since then. Not only has the sea levels have dropped since the Holocene Optimum the evidence shows that “warmer paleotemperatures were favourable for great proliferation of mollusks in the area”
      Santa Catarina Brazil is at latitude 27.2500°S and is tectonically stable.

      STUDY #5
      Holocene sea-level change and ice-sheet history in the Vestfold Hills, East Antarctica

      A new Holocene sea-level record from the Vestfold Hills, Antarctica, has been obtained by dating the lacustrine–marine and marine–lacustrine transitions that occur in sediment cores from lakes which were formerly connected to the sea. From an elevation of ∼7.5 m 8000 yr ago, relative sea-level rose to a maximum ∼9 m above present sea-level 6200 yr ago. Since then, sea-level has fallen monotonically until the present….
      (wwwDOT)sciencedirect.com/science/article/pii/S0012821X97002045

      The above is a RELATIVE sea level. The area is not tectonically stable because the area has isostatic uplift in response to deglaciation from the Wisconsin Ice Age. The same applies to the following study.

      STUDY #6
      A new Holocene relative sea level curve for the South Shetland Islands, Antarctica

      The curve shows a mid-Holocene RSL highstand on Fildes Peninsula at 15.5 m above mean sea level between 8000 and 7000 cal a BP. Subsequently RSL gradually fell as a consequence of isostatic uplift in response to regional deglaciation….
      nora(DOT)nerc.ac.uk/15786/

    • Gail Combs says:

      Have the ClimAstrologists corrected for the 18.6-yearly Luna Nodal cycle?
      Linear trend lines on sinusoidal curves are very time dependent. The Dutch who are the most concerned about actual sea level rise have found the cycle.

      Local Relative Sea Level
      To determine the relevance of the nodal cycle at the Dutch coast, a spectral analysis was carried out on the yearly means of six main tidal gauges for the period 1890–2008. The data were corrected for atmospheric pressure variation using an inverse barometer correction. The spectral density shows a clear peak at the 18.6 -year period (Figure 1). The multiple linear regression yields a sea-level rise (b1) of 0.19 +/- 0.015 cm y-1 (95%), an amplitude (A) of 1.2 +/- 0.92 cm, and a phase (w) of -1.16 (with 1970 as 0), resulting in a peak in February 2005 (Figure 2). No significant acceleration (inclusion of b2) was found.
      CONCLUSIONS
      Coastal management requires estimates of the rate of sealevel rise. The trends found locally for the Dutch coast are the same as have been found in the past 50 years (Deltacommissie, 1960; Dillingh et al., 1993). Even though including the nodal cycle made it more likely that the high-level scenarios would become apparent in the observations, no acceleration in the rate of sea-level rise was found. The higher, recent rise (van den Hurk et al., 2007) coincides with the up phase of the nodal cycle. For the period 2005 through 2011, the Dutch mean sea-level is expected to drop because the lunar cycle is in the down phase. This shows the importance of including the 18.6-year cycle in regional sea-level estimates. Not doing so on a regional or local scale for decadal length projections leads to inaccuracies.
      (wwwDOT)bioone.org/doi/pdf/10.2112/JCOASTRES-D-11-00169.1

      The Effect of the 18.6-Year Lunar Nodal Cycle on Regional Sea-Level Rise Estimates
      Fedor Baart†,‡, Pieter H. A. J. M. van Gelder†, John de Ronde†,‡, Mark van Koningsveld†,§, and Bert Wouters†
      (wwwDOT)bioone.org/doi/abs/10.2112/JCOASTRES-D-11-00169.1

      Linear trend lines on sinusoidal curves are very time dependent.
      “Cooling…German Springs Arriving 20 Days Later Than 28 Years Ago!”
      http://notrickszone.com/2015/05/31/cooling-german-springs-arriving-20-days-later-than-25-years-ago/
      Darn good read for those interested in such matters. And another example of official government lies.

      And another study:

      “Our analyses do not indicate acceleration in sea level in U.S. tide gauge records during the 20th century. Instead, for each time period we consider, the records show small decelerations that are consistent with a number of earlier studies of worldwide-gauge records. The decelerations that we obtain are opposite in sign and one to two orders of magnitude less than the +0.07 to +0.28 mm/y2 accelerations that are required to reach sea levels predicted for 2100 by Vermeer and Rahmsdorf (2009), Jevrejeva, Moore, and Grinsted (2010), and Grinsted, Moore, and Jevrejeva (2010). Bindoff et al. (2007) note an increase in worldwide temperature from 1906 to 2005 of 0.74uC. It is essential that investigations continue to address why this worldwide-temperature increase has NOT produced acceleration of global sea level over the past 100 years, and indeed why global sea level has possibly decelerated for at least the last 80 years.”

      http://88.167.97.19/temp/Sea-Level_Acceleration_Based_on_U.S._Tide_Gauges_and_Extensions_of_Previous_Global-Gauge_Analyses_jcoastres-d-10-00157-1.pdf

      AND another New 2015 paper: Ocean impact on decadal Atlantic climate variability revealed by sea-level observations

      Decadal variability is a notable feature of the Atlantic Ocean and the climate of the regions it influences. Prominently, this is manifested in the Atlantic Multidecadal Oscillation (AMO) in sea surface temperatures. Positive (negative) phases of the AMO coincide with warmer (colder) North Atlantic sea surface temperatures. The AMO is linked with decadal climate fluctuations, such as Indian and Sahel rainfall1, European summer precipitation2, Atlantic hurricanes3 and variations in global temperatures4. It is widely believed that ocean circulation drives the phase changes of the AMO by controlling ocean heat content5. However, there are no direct observations of ocean circulation of sufficient length to support this, leading to questions about whether the AMO is controlled from another source6. Here we provide observational evidence of the widely hypothesized link between ocean circulation and the AMO. We take a new approach, using sea level along the east coast of the United States to estimate ocean circulation on decadal timescales. We show that ocean circulation responds to the first mode of Atlantic atmospheric forcing, the North Atlantic Oscillation, through circulation changes between the subtropical and subpolar gyres—the intergyre region7. These circulation changes affect the decadal evolution of North Atlantic heat content and, consequently, the phases of the AMO. The Atlantic overturning circulation is declining8 and the AMO is moving to a negative phase. This may offer a brief respite from the persistent rise of global temperatures4, but in the coupled system we describe, there are compensating effects. In this case, the negative AMO is associated with a continued acceleration of sea-level rise along the northeast coast of the United States9, 10.

    • Gail Combs says:

      he area where Roman sea ports are inland is tectonically stable according to NASA.
      List of Roman Sea Ports found inland
      (Has great pictures and maps.)

      For the areas occupied by the Romans it was pretty close to zero or actually sinking! “..the pivot point is rather abrupt; Scotland is still rising due to the rebound effect which is correspondingly sinking England 2 millimetres into the North Sea each year.”

      A NASA model of current surface elevation change due to post-glacial rebound and the reloading of sea basins with water. Canada, Northern Europe, and Antarctica are all currently rebounding at a rate of a few millimetres per year. More water in the oceans as a result of ice sheet melting is slowly depressing sea basins. Satellites are used to observe differences over time. http://basementgeographer.com/glacial-isostatic-adjustment/

      https://i0.wp.com/basementgeographer.com/wp-content/uploads/2013/05/PGR_Paulson07_big.jpg

    • Gail Combs says:

      FINALLY the misleading WIKI Sea Level Graph

      This is a critical study because it is the one that yanks the WIKI sea level chart (adjusted of course) from a falling sea level to a slowly rising sea level. Note that the study authors find a falling sea level and can’t believe it because it doesn’t meet ‘expectations’ (The area is tectonically stable and unglaciated so there is ZERO need for adjustments.)

      The infamous graph:
      https://upload.wikimedia.org/wikipedia/commons/1/1e/Holocene_Sea_Level.png

      This figure shows sea level rise since the end of the last glacial episode based on data from Fleming et al. 1998, Fleming 2000, & Milne et al. 2005. These papers collected data from various reports and adjusted them for subsequent vertical geologic motions, primarily those associated with post-glacial continental and hydroisostatic rebound. — WIKI
      commons(DOT)wikimedia.org/wiki/File:Post-Glacial_Sea_Level.png

      Santa Catarina is the dark red cross above the pack on the right. Remove it and sea level is actually falling for the last 2,000 years.

      The Quaternary Geological History of the Santa Catarina Southeastern Region (Brazil) 1999

      The first part discusses drilling in several locations and analyzing samples. They mention dating prior to that was guesses. “…. A drilling campaign done in the domain permitted the sampling of material for 14C datings, and the obtained data confirmed some previously assumed ages. The sequence of events, that originated the Holocene deposits, has been also reconstructed through drilling and 14C dating of the collected peat and shell samples…”

      In the body of the text is this:

      THE HOLOCENE DEPOSITIONAL SYSTEM
      Partially abutted against the Pleistocene barrier island/lagoonal system III, there is the Holocene depositional system. This unit is attributable to the Santos Transgression of Suguio & Martin (1978), along the State of São Paulo coastline, or to the Last Transgression of Bittencourt et al. (1979) along the State of Bahia coastline, being similar to the barrier island/lagoonal system IV of Villwock et al. (1986), along the State of Rio Grande do Sul coastline.

      This system is related to the post-glacial transgressive episode whose culmination stage was attained about 5.1 ky BP, when a barrier island alignment was formed parallel to the shoreline, while drainage net was drowned. The subsequent regressive episode promoted the barrier island progradation following the lagoonal basin silting.

      The paleoshorelines limited by ancient cliffs carved within Pleistocene terraces, presently representing the inner limit of the Holocene terrace, shows that this sea-level reached about 4m above the present one. Several terraces situated in different altitudes, and truncation of past morphological features nowadays observed on Holocene deposits, as well as along present lagoonal margins suggest that small scale sea-level oscillations occurred during the last 5 ky….

      Maximum of the Holocene transgression – This episode was exhaustively studied along most of Brazilian coast (Suguio et al. 1985). The relative sea-level rise during this transgression drowned the downstream courses and lagoonal margins, eroding ancient marine terraces and giving rise to sand spits and barrier islands, which formed new lagoonal systems along the coast. Mollusk shells and wood fragments contained within lagoonal deposits indicated radiocarbon ages between 5 and 7 ky BP (Mendes 1993; Pitoni 1993), suggesting that the barrier islands installation occurred before the Holocene culmination stages (5.1 ky BP)….

      Construction of Holocene wave-built terrace – The sea-level drop following the 5.1 ky BP culmination stage originated the wave-built terrace abutted against the original barrier island, with the consequent shoreline progradation in general as regressive beach ridges. Several truncations of these beach-ridge systems, as well as many levels of marginal lagoonal terraces suggest that the dominantly regressive trend was momentarily interrupted by minor transgressive episodes. The radiocarbon ages of the natural shell beds indicate that between 5 and 3 ky BP the relative sea-level was higher than today, with consequent expansion of the lagoonal areas frequently transformed into bays, and warmer paleotemperatures were favourable for great proliferation of mollusks in the area (Mendes 1993; Pitoni 1993).

      “…a relative sea-level change curve for the last 7 ky in the area Florianópolis-Jaguaruna (Fig. 7) is outlined…”

      https://i0.wp.com/www.scielo.br/img/fbpe/aabc/v72n2/0025img17.gif

      This study shows a sea level highstand ~ 4 meters above the present level about ~5000 years ago. With sea level oscillating since then. Not only has the sea levels dropped since the Holocene Optimum the evidence shows that “warmer paleotemperatures were favourable for great proliferation of mollusks in the area” (Santa Catarina Brazil is at latitude 27.2500°S. )

      *******************************************
      Back to the NASA study on post-glacial rebound.

      AGAIN – Notice the pivot point in the UK is ~ 55° N and the great lakes ~ 45° N which is one of the reasons why Southeast Vietnam ~10°N, the southern Arabian Gulf, ~ 23°N, and Santa Catarina, Brazil, 27° S are tectonically stable areas.

      “A NASA model of current surface elevation change due to post-glacial rebound and the reloading of sea basins with water. Canada, Northern Europe, and Antarctica are all currently rebounding at a rate of a few millimetres per year. More water in the oceans as a result of ice sheet melting is slowly depressing sea basins. Satellites are used to observe differences over time.”

      Glacial Isostatic Adjustment
      ….For the past 5 000 years or more (the approximate time when the amount of ice on the planet reached its current geographic coverage), lands formerly underneath continental ice sheets having been rising back up at a rate of a few millimetres each year. Typical uplift rates are around 1 millimetre per year, and are slowing down at an exponential rate now that the glacial loads are long gone. The rates are not uniform, of course, depending upon how much ice was present. Around Hudson Bay, Canada, or the Gulf of Bothnia, for example, the uplift rate can be upward of 7 to 13 millimetres per year; an entire metre per century, and 300 metres total since the end of glaciation, resulting in thousands of square kilometres of new land. And the pivot point is rather abrupt; Scotland is still rising due to the rebound effect which is correspondingly sinking England 2 millimetres into the North Sea each year. In North America, the pivot point goes through the middle of the Great Lakes basin; the Canadian share of the lakes is shrinking, becoming 3 millimetres shallower every year, while the US side gets 1 millimetre deeper each year….

    • Derek Colman says:

      Sorry, you are misinformed by warmist blogs. Ocean acidification has been completely debunked more than once. There is no acceleration in sea level rise. Although that did occur back in the 1990s, it has been cancelled out by a slowing down since such that the average rise is the same as it has been for 3 centuries. There is no increase in the frequency or severity of extreme weather events, and even the IPCC acknowledge that in their last report, AR5. Glaciers are exhibiting normal cyclical changes. The few photos of glaciers taken in the early days of photography show them retreated as much as they are now. Coming back to today, since the end of the El Nino, northern hemisphere temperature has dropped rapidly, and now has a record level of ice and snow cover. Global mean temperature is at this moment the same as it was in 1985.

    • Steve says:

      While artic sea ice extent has decreased by -1 million Sq km versus the 1981 to 2010 average the antarctic sea ice extent has increased by more than 1.3 million Sq km versus it’s average. In addition the antarctic land ice thickness is at all time record high. Careful looking at just the propaganda.

    • Bill says:

      Oceans are rising at a rapidly accelerating pace with many coastal communities experiencing sunny day floods.

      Please provide actual events, regerences and web links. Note- Huffington Post articles do not count.

      If it’s as prevalent as you assert, there should be hundreds of references, and then no prior history of flooding. Don’t tell me to Google-it, either.

    • Sunsettommy says:

      Scott,

      Bwahahahahahahahahahahahaha!!!

      More warmist stupidity,where even when Tony shows a 100% data based chart from Satellite showing no warming from 1998 to 2016. The IPCC in EVERY report say it was supposed to warm at LEAST .20C per decade,with .30C being the average warming rate per decade.

      From the 1990 IPCC report,

      “Based on current model results, we predict:
      • under the IPCC Business-as-Usual (Scenario A) emissions of greenhouse gases, a rate of increase of global mean temperature during the next century of about 0 3°C per decade (with an uncertainty range of 0 2°C to 0 5°C per decade), this is greater than that seen over the past 10,000 years This will result in a likely increase in global mean temperature of about 1°C above the present value by 2025 and VC
      before the end of the next century”

      http://www.ipcc.ch/ipccreports/far/wg_I/ipcc_far_wg_I_spm.pdf

      But it is ZERO rate since the 1990’s,which means you are full of baloney.

      Meanwhile not only have you failed to counter that valid chart,you also failed to make a data based counterpoint to Tony;s post,just the usual brainless warmist babble is all you have here.

      This is why realists laugh at you.

  9. AndyG55 says:

    RSS anomalies are now available.. third decimal place stuff.. so NO WARMING SINCE 1998

    2016… 0.559
    1998… 0.550

    Looking just at December data….

    In RSS December 2016 is NINTH place (1987 was one of the warmer Decembers)

    IN UAH December 2016 is in =5th place (1987 ditto)

    Big drops in USA since November for both RSS (-3.1ºC) and UAH USA48 (-1.85ºC)

  10. Colorado Wellington says:

    “Global warming is the biggest fraud in science history.”

    I know you alarmists don’t like Tony saying it but this is a testable hypothesis. All you have to do is find a bigger fraud.

    Good luck with that, comrades.

  11. CheshireRed says:

    As if by magic our old friend Dana Nutty pipes up in the Guardian about the ‘return of the hiatus / pause’.

    He is of course predicting such claims precisely because he knows they’re coming very soon. El Nino is over, the cooling la Nina now in place, nothing on the horizon to offer any ‘global warming’ and on top of all that Trump will be coming into office to drain the climate swamp just as global temperatures really do start to revert from the El Nino high and will thus show as cooling. Not so much a pincer movement as a complete rout is coming his way, and he knows it.

    https://www.theguardian.com/environment/climate-consensus-97-per-cent/2017/jan/06/prepare-for-reanimation-of-the-zombie-myth-no-global-warming-since-2016

    • Gail Combs says:

      Watch for the newest OH! Look a SQUIRREL! To take attention away from the fading CAGW scare.

      They had the ‘Russians Are Coming’ —err cracking— scare all lined up and then Trump won…

  12. Some posting peer review perporting to show no sea level rise consider this, the global temp is going to go beyond 4 degrees, It’s up 1 . something already We don’t really know if anything we do now will stop it due to lag time in climate and the gigatons of methane releasing from the thawing in Siberia. feedback loops and the fact that the Human race is a heat engine spell doom unless we unite to send a stronger louder message to the 1% today More solutions 1: orbiting shades, 2: action group at http://localgroup.weebly.com/

    • tonyheller says:

      Utter nonsense at all levels

      • AndyG55 says:

        You really do have to wonder what some of these twerps are taking.

        Is there a new form of highly brain-damaging, hallucinogenic drug on the market, which they are adding to their Klimate Kool-Aide.???

    • Sunsettommy says:

      Alexander,

      The warming rate since 1979,by Satellite is less than half the projected PER DECADE rate as published by the IPCC,which is .30C per decade,while Satellite shows about .12C per decade.

      CH4 is a negligible GHG,since its main absorption bands are in the LOW energy part of the IR,well away from the main IR outflow from the planets surface. You have showing your vapid ignorance here since even few warmist scientists that exist,knows that Methane is short lived in the atmosphere,that it is a trivial absorber of IR. They know that most leftists like you are going to too ignorant to realize you are being fooled by their CH4 mania.

      The much talked about but never seen Positive Feedback loop never goes away,since it is a warmist fantasy that needs to be held onto since all of their few short term modeling fantasies have already failed. Something that have NEVER happened in the last 1,000,000,000 years.

      For most of Earth history,CO2 levels in the atmosphere was at least above 1500 ppm,at times over 3000 ppm,with ZERO evidence of serious warming catastrophe you leftist eco loony brain dead morons keep babbling about. The current CO2 rate will reach around 550 ppm by 2100.

      The basic Logarithmic CO2 warm forcing rate is nearly done at the 400 ppm level,which means very little future warming from CO2 can occur,according to this link,

      http://joannenova.com.au/globalwarming/graphs/log-co2/log-graph-lindzen-choi-web.gif

      You are so whacked with baloney……

    • Colorado Wellington says:

      Alexander, are you by chance the same guy who was explaining some decades ago at the west end of the Pearl Street Mall how the Earth’s overlords developed the human race directly from anapsids after they exploded the Siberian Traps and killed almost everyone else? And do you remember asking tourists passing by to touch your temples as evidence?

  13. Bill says:

    I sold some of the most sensitive laborstory and filed instruments for measuring do-called greenhouse gases (CO2, CH4, NO2) and isotopic analysers to resesrchers around the world.

    Nice prople in genral but it was a religion to them, and my Dad told me ask a kid to never argue religion with somebody who you didn’t want as an enemy.

    Trying to discuss that H2O is a larger IR absorber or did rsising temps from solar activity cause CO2 solubility to drcresase in the oceams and go into the atmosphere was like asking a Muslim how a horse flew into the sky or a Mormon why they wear special underwesr. It will not get you anywhere- because tgat’s what they believe as a matter of faith.

  14. Lewis Austin says:

    Of course these are only local New England data:

    https://pubs.usgs.gov/fs/2005/3002/

  15. Mark says:

    If you wanted credibility, your graphs you are posting would actually have a legend and some descriptors as to what people are looking at. I just laugh when you folks want to prove a point with graphs, but yet fail to enlighten us to what the graph even is showing. And then I laugh further when commenters comment on a graph without even being able to know what the graph is showing.
    Thanks for the good laughs.

  16. Mark says:

    http://www.cpc.ncep.noaa.gov/products/analysis_monitoring/enso_advisory/ensodisc.pdf

    Here’s a link to the latest La Niña advisory. You are a little late to think La Niña is going to cool the globe. It’s weak and ending next month!

    • gator69 says:

      Why would we think that La Niña will cool the globe? We are still warming out of the LIA. But thanks for sharing your ignorance of us, and science.

  17. csaaphill says:

    I see in Portland on OPB some kid is holing up a sign about global warming etc… I guess there’s a big protest or something? But do they know there isn’t any significant change since 1997, or are they just Socialists and want to control us?
    My guess is, the kid is duped while most others know the truth?
    I used to fall for this long-ago but and not truly convinced it’s fake either, just not as emotional over it as I used to be.

Leave a Reply to AndyG55 Cancel reply

Your email address will not be published. Required fields are marked *