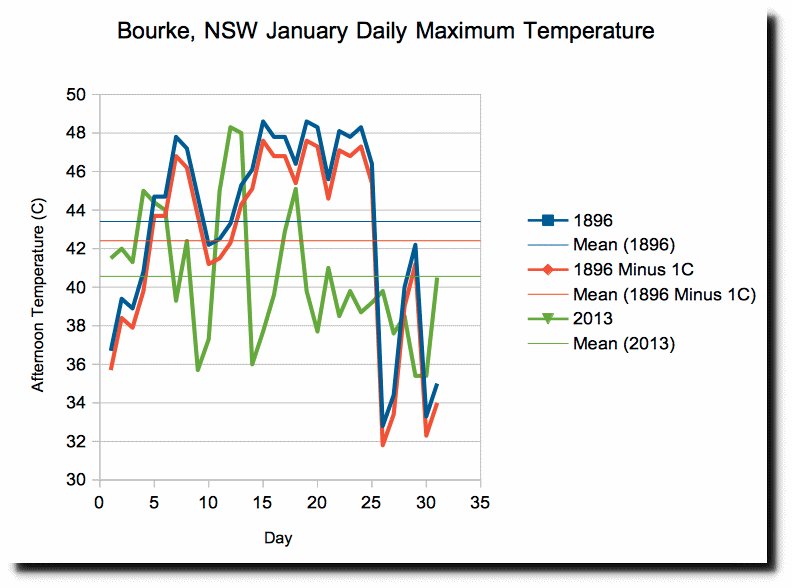
Australia’s Bureau of Meteorology hides the January 1896 heatwave, because they say measurement techniques exaggerated afternoon temperatures by 1C.
In 1887, Todd set up what must be one of the longest-running scientific experiments ever, when he installed thermometers in a Stevenson Screen and on a Glaisher Stand at Adelaide Observatory (as seen in the illustration here). Observations were taken in both exposures until 1948.
The results of this 61-year experiment show that summer daytime temperatures measured using the Glaisher Stand are, on average, 1C warmer than in the Stevenson Screen.
You will find that, after the adjustments they make to the data (to ensure the early data can be reliably compared with modern data), some years in the 19th century were indeed warm. But nothing like the heat we endured across the country in 2013.
According to Berkeley Earth, the Australian average daily maximum temperature in January 1896 was about 1C hotter than the 1951-80 January average. But January 2013 was a full 1.5C hotter again – really, the late 19th century temperatures don’t come close to modern extremes.
That’s why the Bureau’s official temperature records start in 1910 – before that date we have good grounds for believing that the data are poor and biased (and would be difficult to adjust for the many problems).
I tested out their theory by comparing the 1896 heatwave vs. the 2013 heatwave. Even after subtracting 1C from the 1896 temperatures, 1896 was still 2C hotter than 2013. In 1896 they had weeks of extremely hot weather, whereas in 2013 they only had a small handful of hot days.
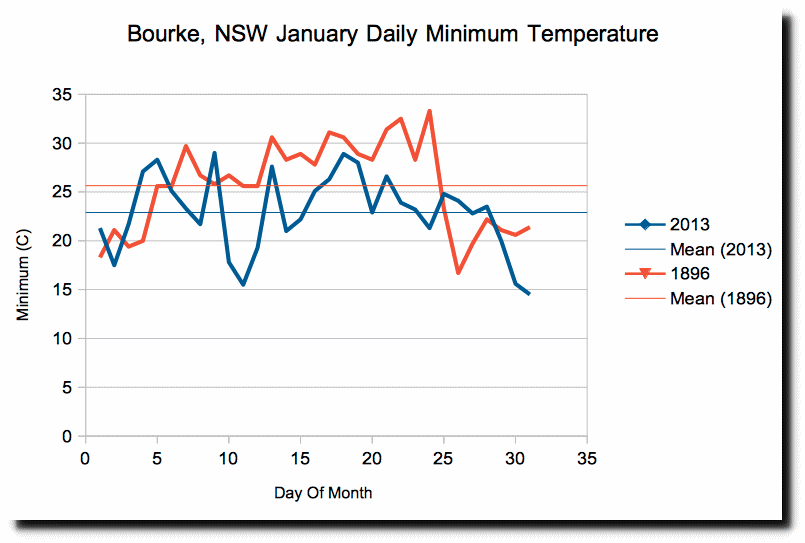
Nighttime temperatures were also 2C hotter in 1896 than 2013. Nighttime temperatures aren’t affected by stand type. Ignoring the 1896 heatwave is malfeasance, not science.
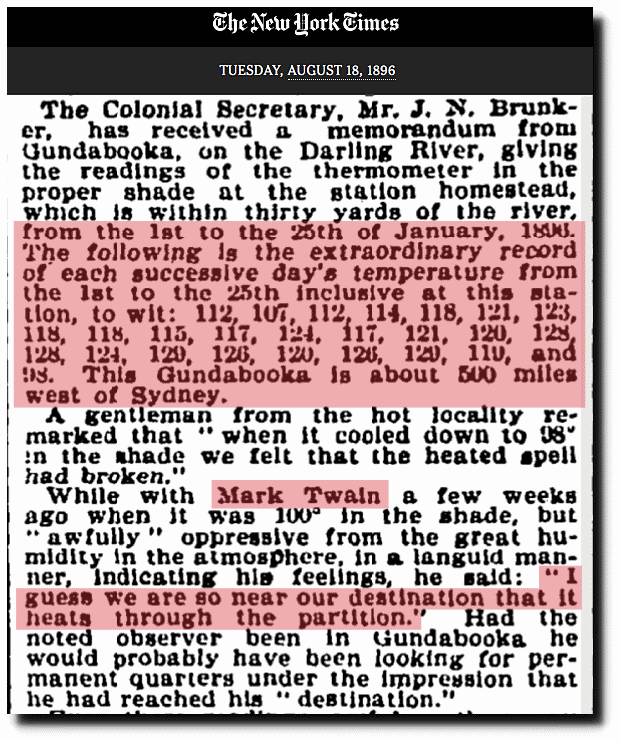
January 1896 was incredibly hot. BOM is hiding it because it wrecks their global warming scam.
TimesMachine: August 18, 1896 – NYTimes.com
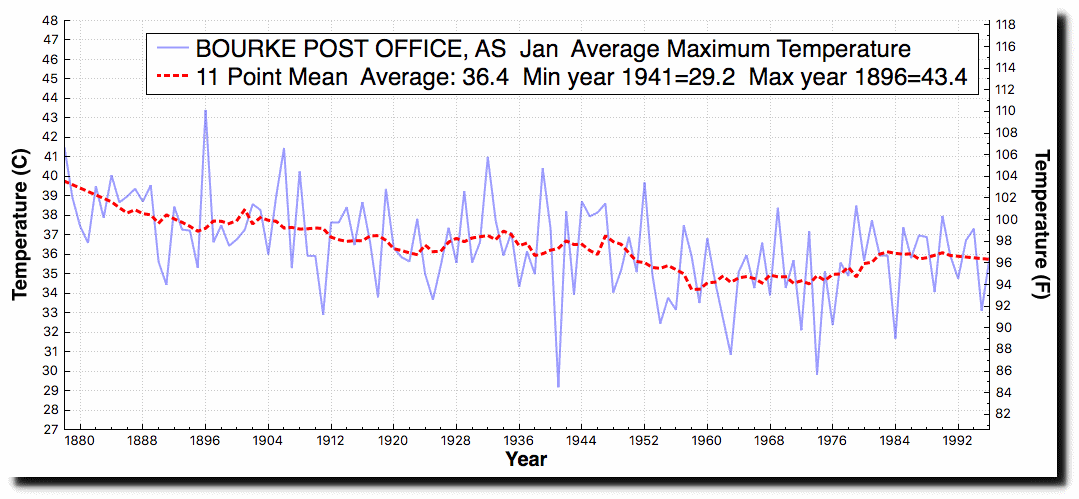
Summers in Australia used to be much hotter. There is no indication of a step change at Bourke correlating to a change in stand type. There is no justification for throwing out pre-1910 temperatures.
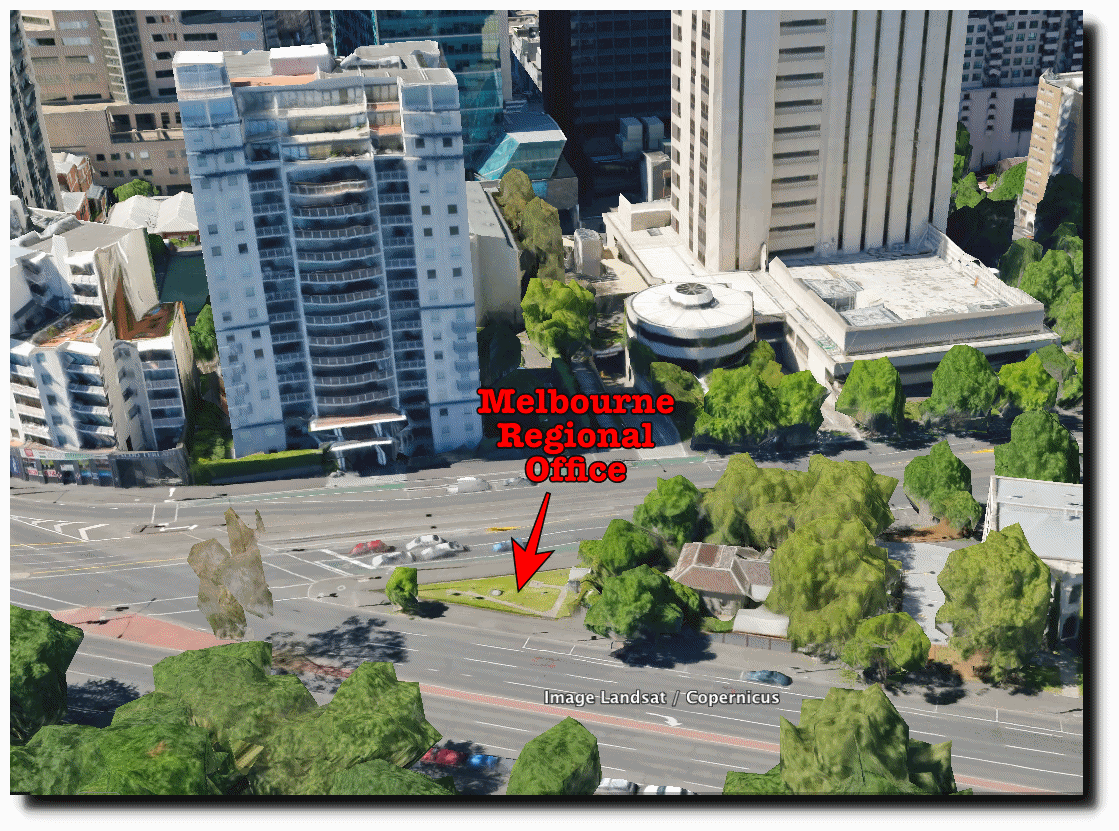
But the story gets worse. BOM is more than happy to use garbage UHI afflicted thermometers like this one in Melbourne, which probably report 3-5C too high.
Global warming is the biggest scam in science history, and government agencies use every excuse in the book to hide inconvenient data.


I find it frustrating that BoM has removed temperature data before 1940 from the weather stations Laverton RAAF and Essendon Airport, and absent also on other sites, in order to determine the temperature rise over the past 120 years or so.
Using the existing data from BoM the average annual temperature rise (based on maximum daily temperature measurements) is 1.3 degrees C between 1940 and 2023.
The CSRIO website mentions 1.5 degree C rise (excluding the stated tolerance levels) from 1910 to the present.
It appears that the 1920 (or earlier) temperature measurements have been excluded by BoM because purportedly, “the measurements were unreliable”.
It should be abundantly obvious to BoM staff that there are many informative texts written on issues of reading errors of thermometers, calibration issues, the statistical treatment of such issues for interpretation of raw data.
For this reason, I believe BoM should make the RAW temperature measurements available for the at least the first three decades of the 20th Century or even records from the 19th Century if available and simply make qualifications, in BoM’s view, where the RAW data may have quality or compromised accuracy.