New release with a ton of new stuff,
This release requires new versions of ghcn.py (Linux/Mac) or ghcn.exe,(Windows) and new files US_final.tmax.txt and US_raw.tmax.txt . You will need all of the files in this directory on Google Drive. I’ve updated US.txt in file US.zip in that directory, to the latest GHCN data. US.txt needs to be unzipped and placed in the same directory on your computer as the other files.
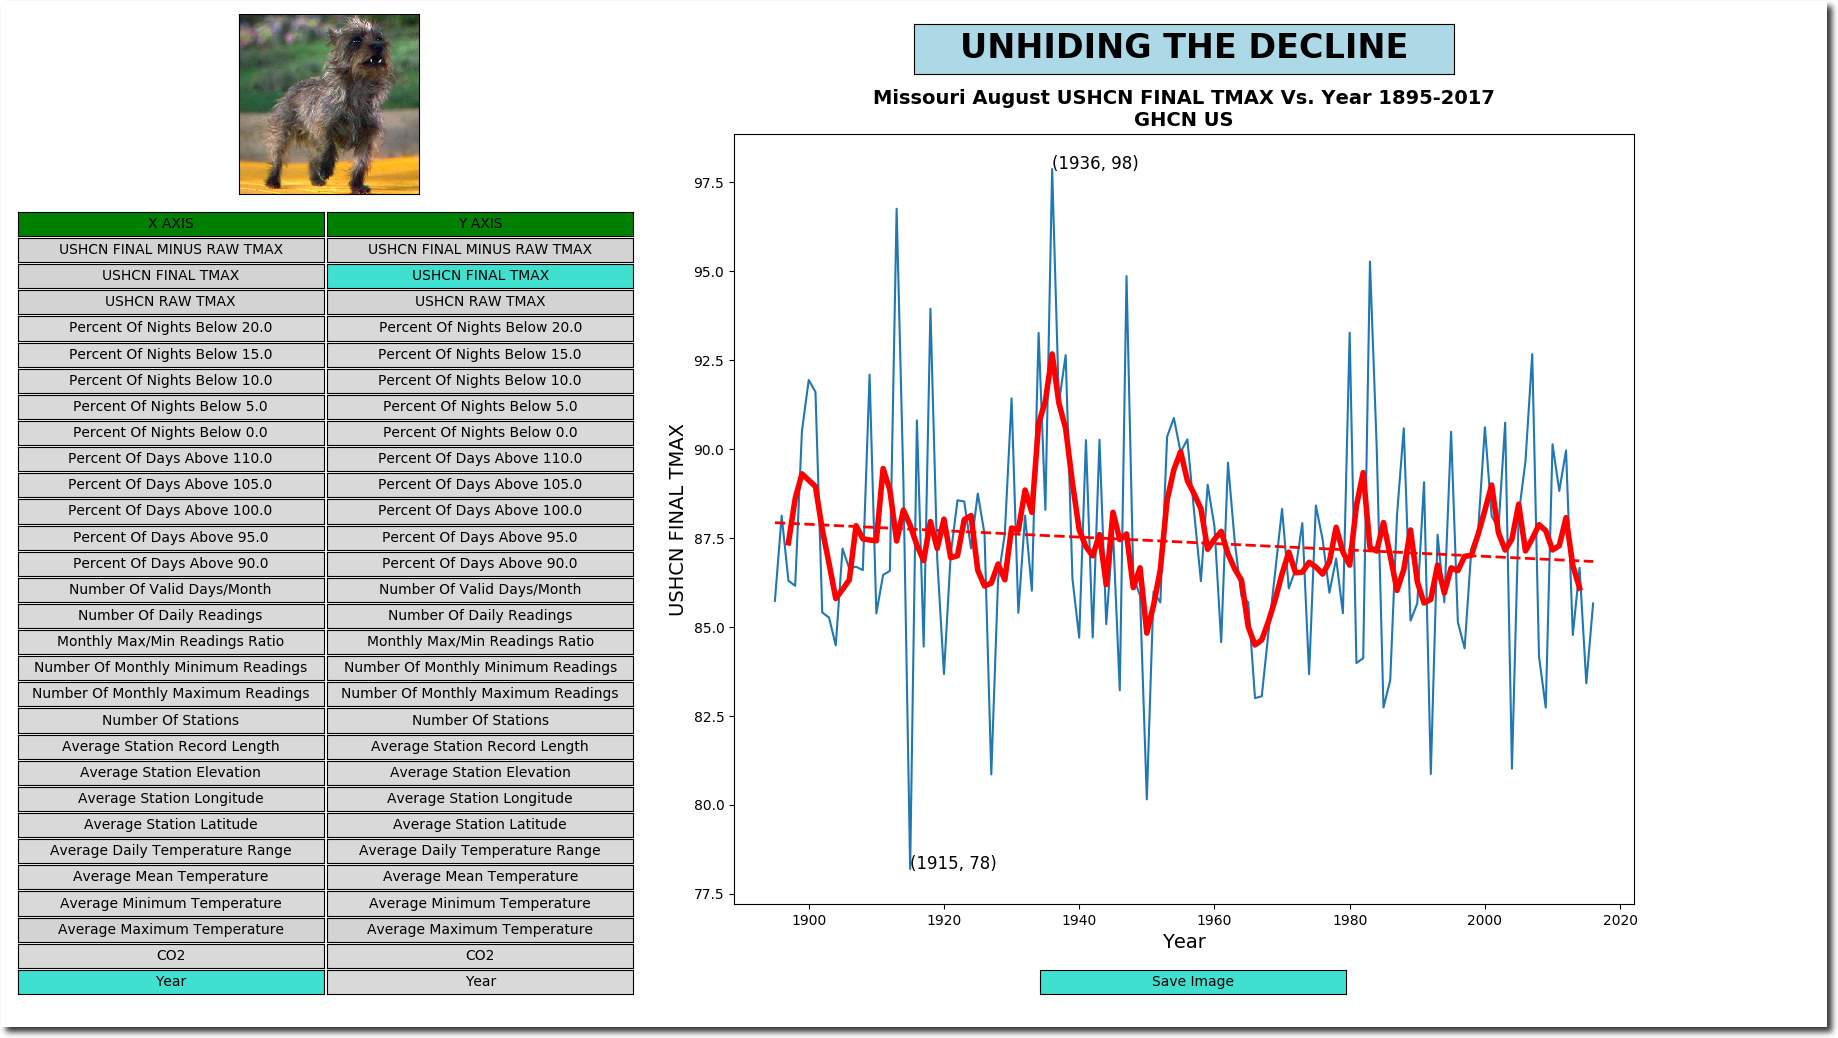
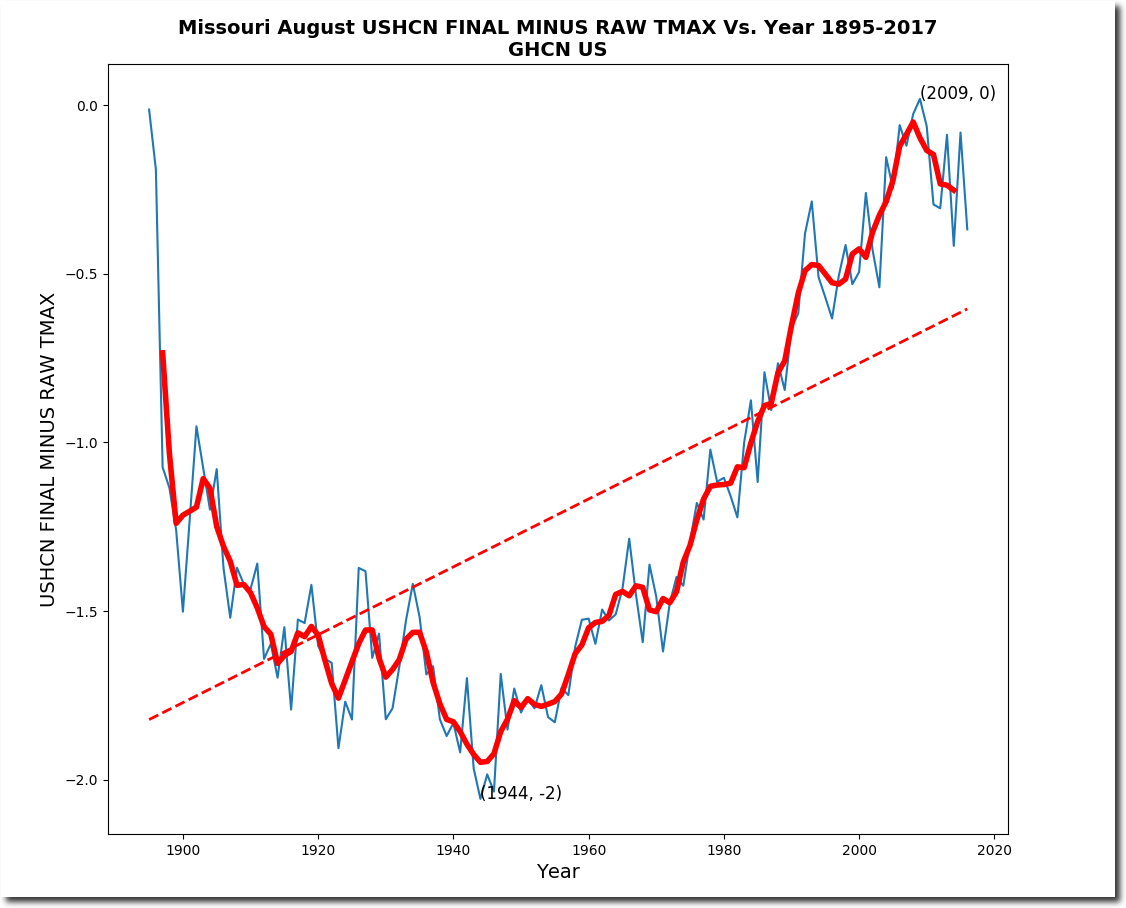
The most obvious change is the addition of USHCN monthly data – the original version only had daily. What the new release gives you is the ability to see how NOAA tampers with the monthly data.
You can see how they “hide the 1940 blip.” The plot below was generated with the command line :
(Linux/Mac) : python3 ghcn.py US.txt month=08 state=MO
(Windows) : ghcn.exe US.txt month=08 state=MO
For serious users, UNHIDING also dumps out a .csv file in the same directory which gives you access to lots more stats.
I think you just released a thousand clones of yourself… Nice looking product!
better: “unleashed”
linux/mac/cygwin syntax nit: call from >python3 … vs >python …
Otherwise, runs good.
Great product! Already shut somebody down with a graph who was espousing something different. Thx.
Figured out issue before. Virus program would not allow execution until it examined it.
I type in CMD what you say to type in, but get December data. Also, no average line for USHCN RAW, FINAL, or FINAL MINUS RAW.
Don’t know if it is me or a bug with Windows version.
Try downloading the ghcn.py or ghcn.exe files again.
Hi Tony!
The new update is working great!
Is there a way I can adapt this program to pull in Canadian temp data as well? If so, can you point me in the right direction to get started?
You don’t have to adapt the program, you just have to create a data file Canada.txt
I will write a blog post explaining how to do that.
Fantastic! Thanks so much!!
Great program. I wish I had heard about the update last year. I have posted a lot of erroneous graphs :( I know I am late to the party, here, but is there global dataset that will work with this? Even just to generate reagional, temp graphs from UAH or RSS data would be big help.
I’m a huge fan. Love the software! I think NOAA has messed with the data to break yoru program. Latest data set and version does not produce same results as the graph above. I just get a flat red line. I just downloaded usa.txt on 10/7/2019.