
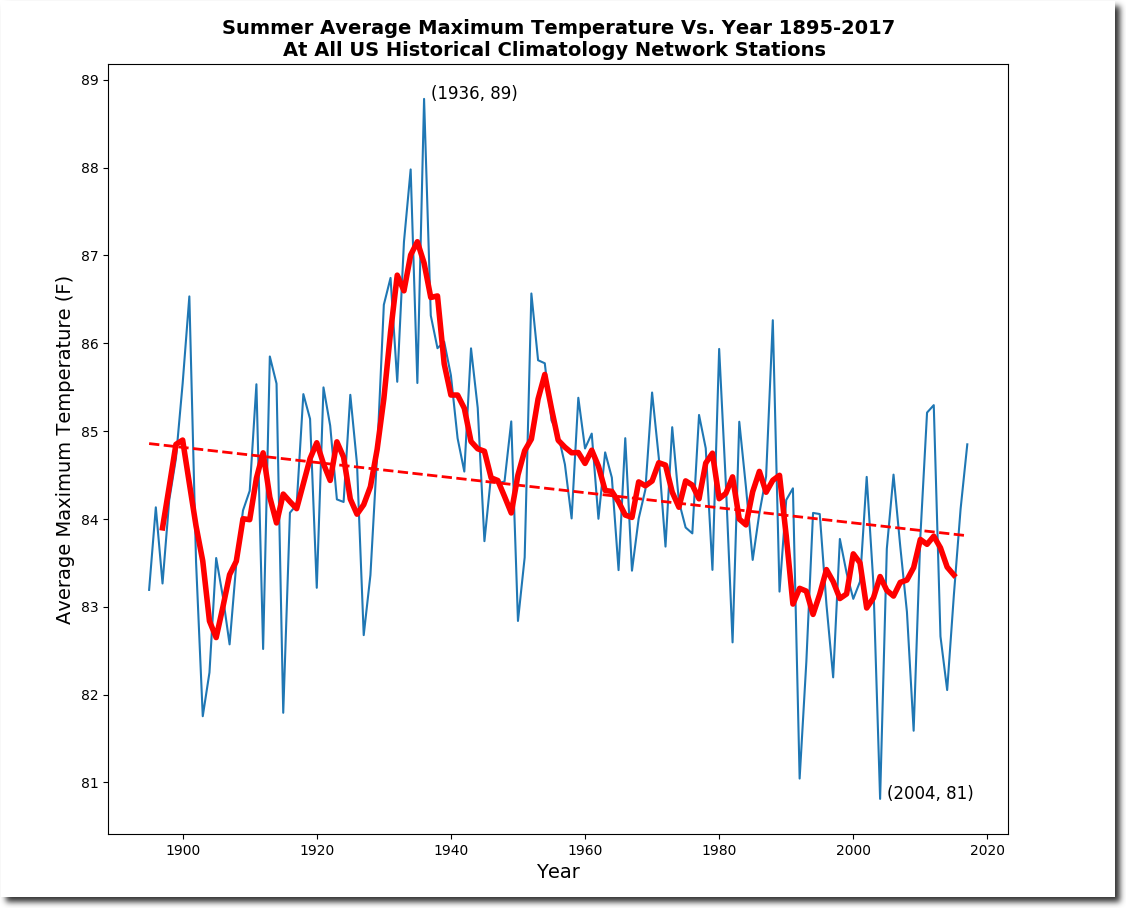
My new UNHIDING THE DECLINE software shows that US summer temperatures never recovered after the fall following the eruption of Mt. Pinatubo in 1991. I’m using a new, fairer algorithm for calculating this which weights all stations equally, regardless of how many days they report in a month. It also shows a 120 year cooling trend. My previous software showed 1992 cooler than 2004. I believe the new algorithm is more accurate.
NOAA’s fake graph shows the exact opposite. It shows an immediate recovery from the eruption, and a long term warming trend.
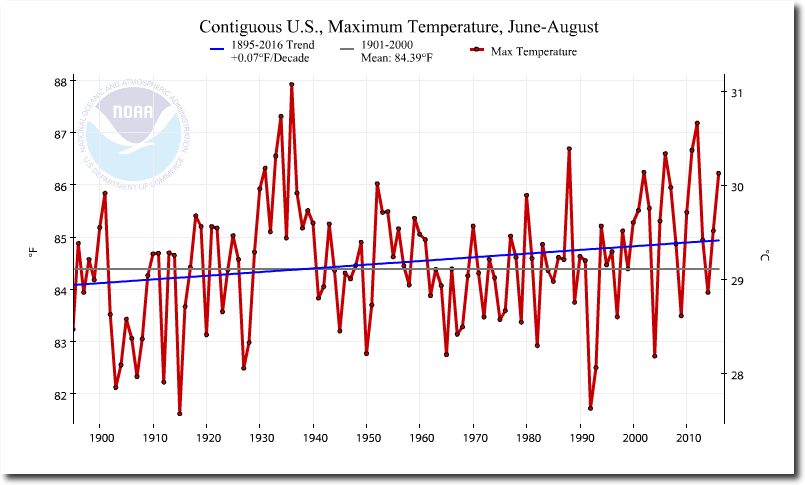
Climate at a Glance | National Centers for Environmental Information (NCEI)
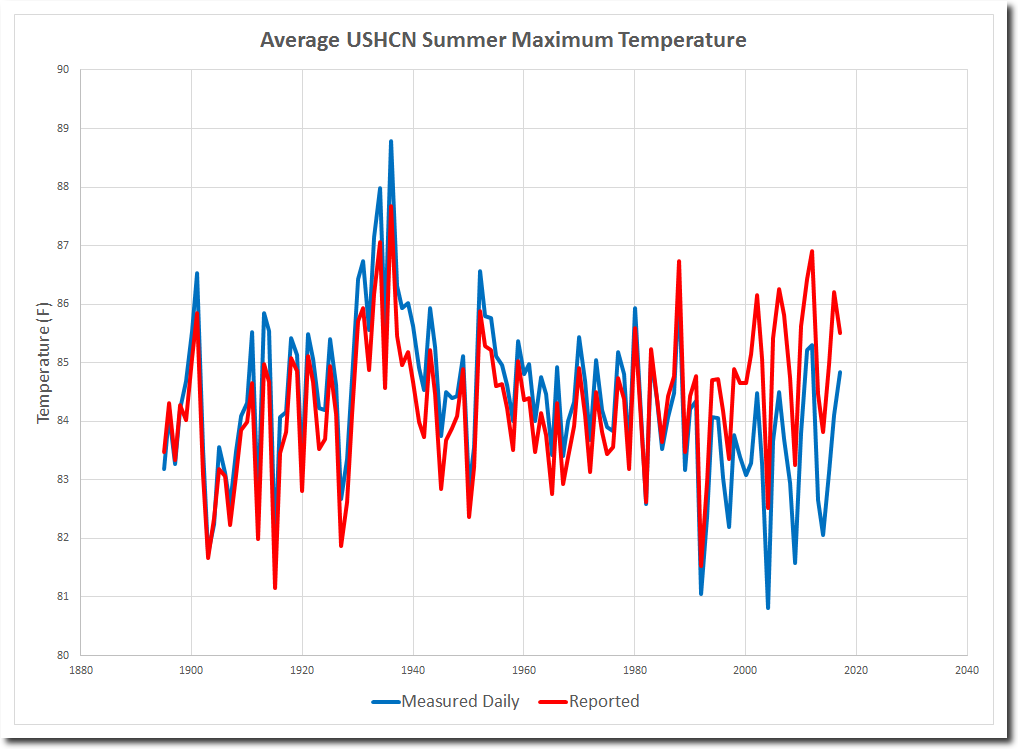
The next graph plots both sets of data. Note the massive divergence after Pinatubo.
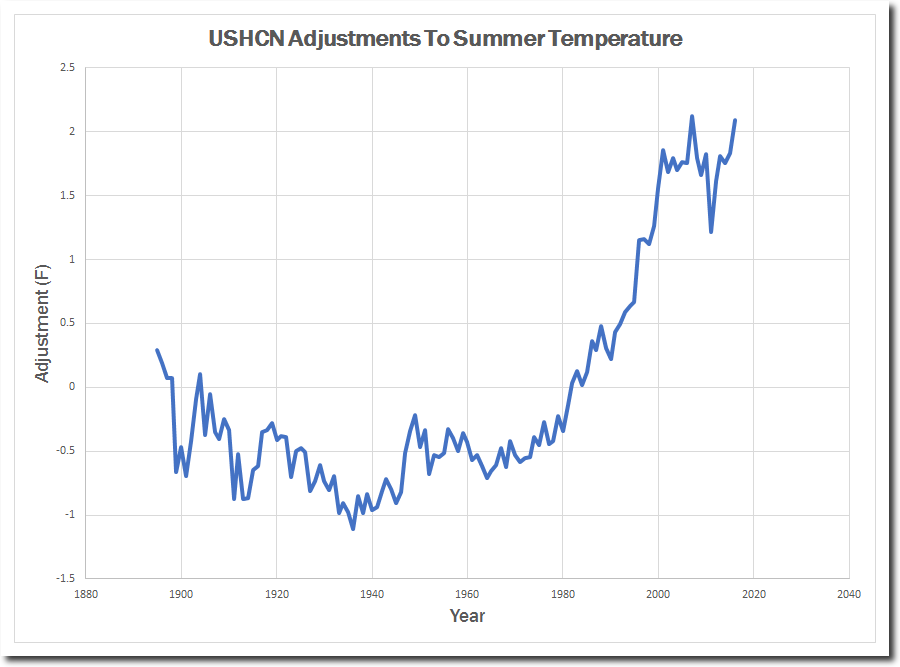
This graph shows the massive data tampering NOAA is engaged in. Nearly three degrees, and a hockey stick after 1990.
Since 1990, NOAA has gone from 6% fabricated temperatures to almost 50% fake data in 2017.
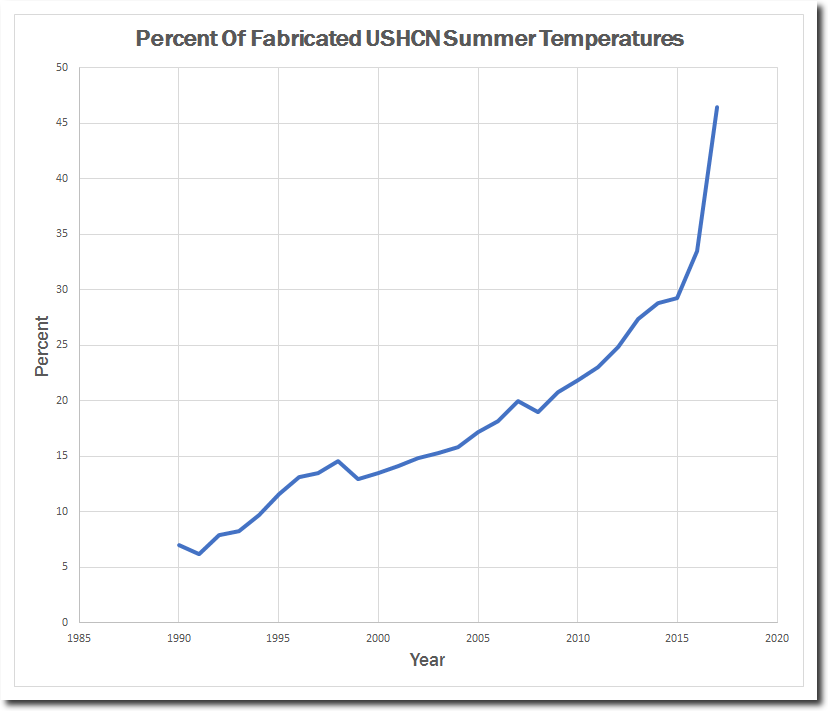
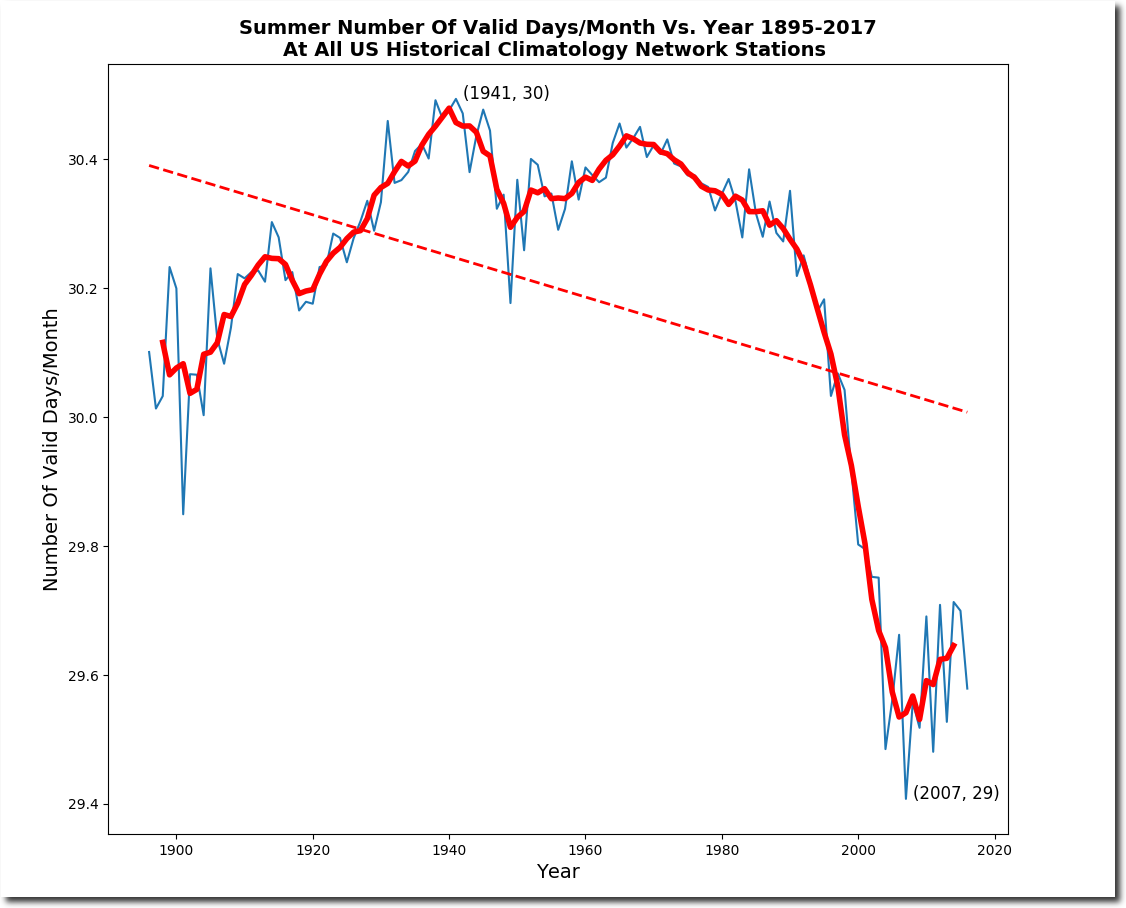
Note that since 1990 they have had a huge decrease in the number of temperature readings per month listed in their database. Between missing stations and missing days, adjusted data is almost half fake.
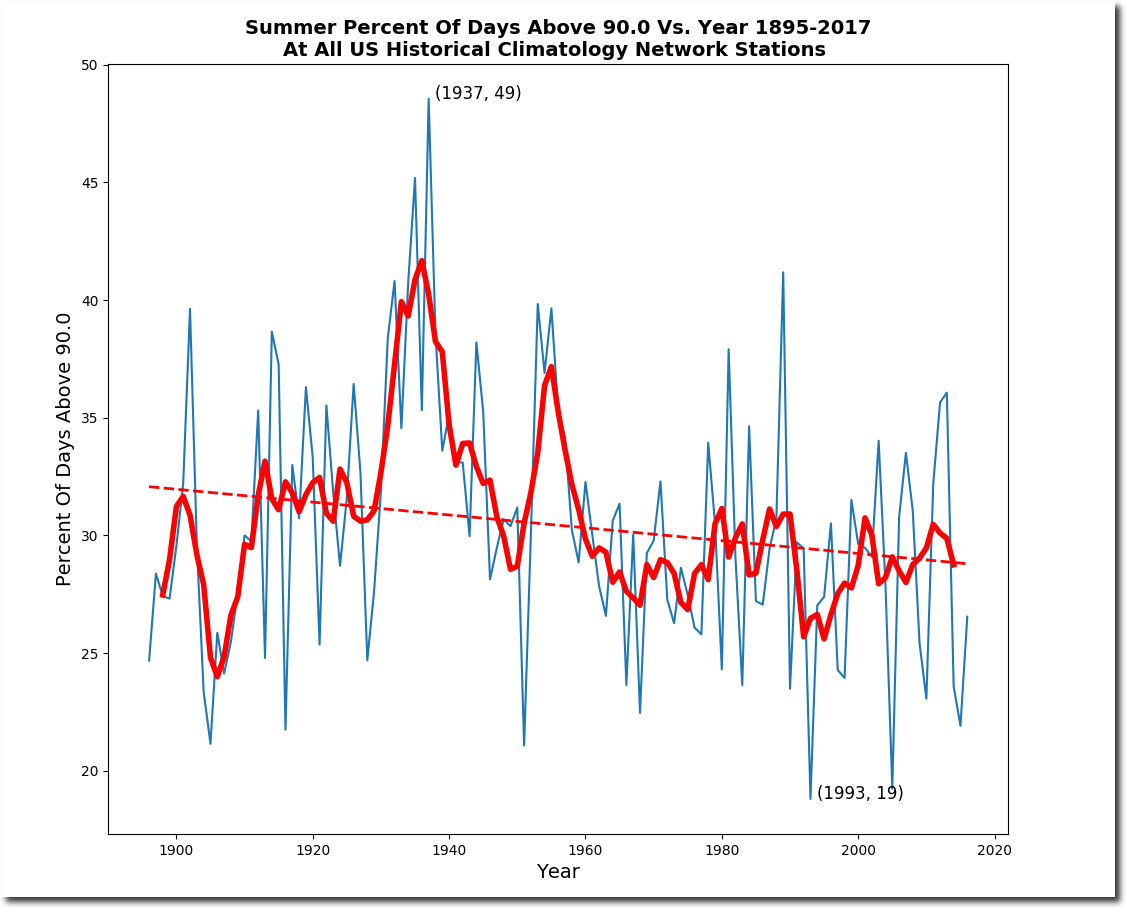
Other evidence is the frequency of hot days, which shows the same pattern as the raw averages.
It is possible that I have a bug in my new software. It is also possible that I am closing in on nailing down how their temperature data racketeering works. It appears that they are replacing cold readings with fake hot ones.
