The trouble with our Liberal friends is not that they’re ignorant; it’s just that they know so much that isn’t so.
Ronald Reagan
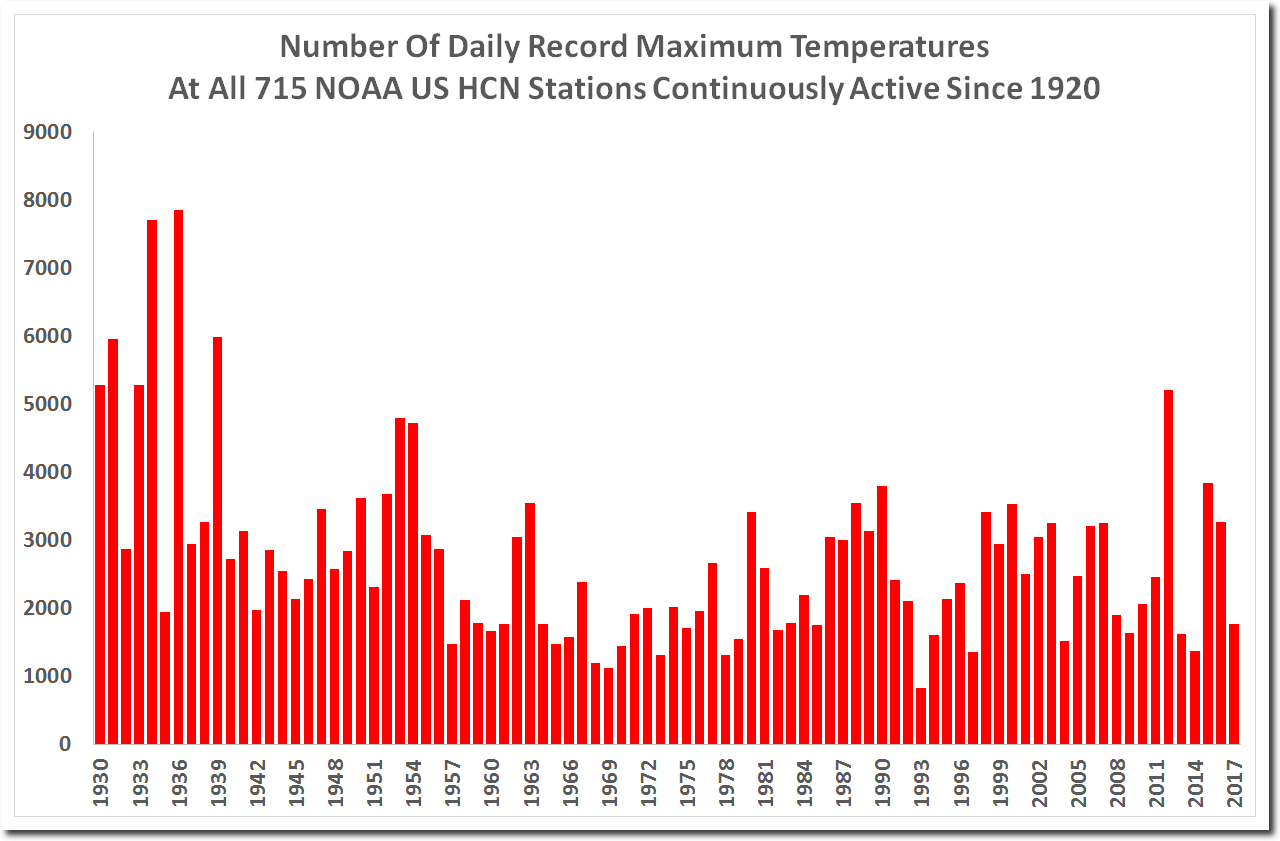
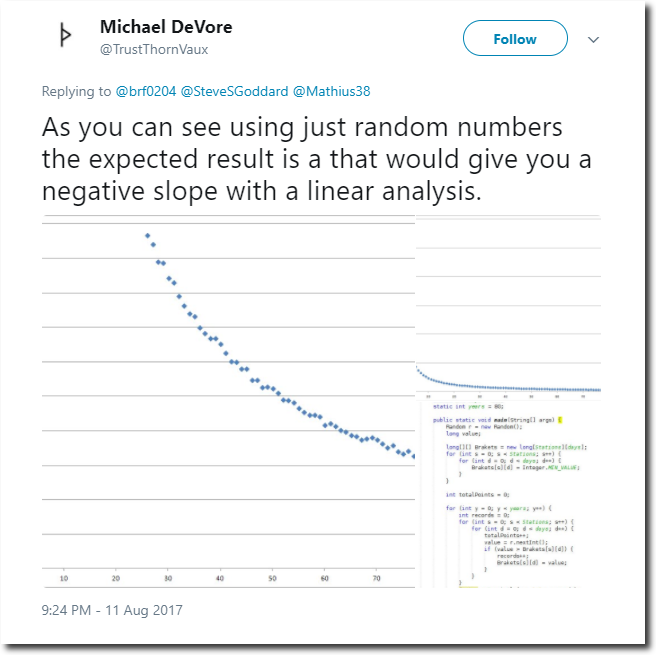
Every time I post a graph like this, some geniuses weigh in and say – of course the number of records go down – because it becomes harder to beat the old records.
This is a typical response.
Here is the algorithm. It makes no difference if you run it forwards, backwards or randomly. The graph gets the same results. There is no time bias.
RECORD_TMAX = 0
RECORD_LIST = []
for year in range(1895, 2016) :
    if (TMAX[year] >  RECORD_TMAX ) :
        # New record becomes the only entry in the record list.
        # All prior holders are cleared
        RECORD_LIST = [year]
        RECORD_TMAX = TMAX[year]
    elif (TMAX[year] ==  RECORD_TMAX ) :
        # Ties are added to the record list
        RECORD_LIST.append(year)
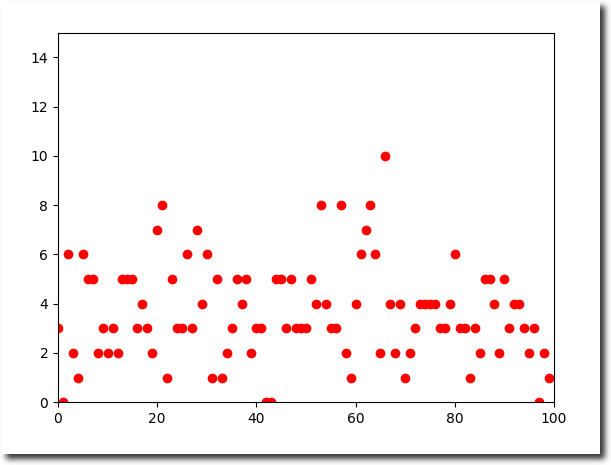
If the world was warming, the graph would be mirrored and the number of records would be increasing. Enough fake excuses! Here is an actual test of the algorithm.
import random

YEAR = []
RECORD_COUNT = []
for year in range(0, 100) :
    YEAR.append(year)
    RECORD_COUNT.append(0)

for day in range(1, 366) :
    TMAX = random.sample(range(0, 200), 100)
    RECORD_TMAX = 0
    RECORD_LIST = []
    for year in range(0, 100) :
        if (TMAX[year] >  RECORD_TMAX ) :
            # New record becomes the only entry in the record list.
            # All prior holders are cleared
            RECORD_LIST = [year]
            RECORD_TMAX = TMAX[year]
        elif (TMAX[year] ==  RECORD_TMAX ) :
            # Ties are added to the record list
            RECORD_LIST.append(year)

    for record in RECORD_LIST :
        RECORD_COUNT[record] += 1

import matplotlib.pyplot as plt
plt.plot(YEAR, RECORD_COUNT, "ro")
plt.axis([0, 100, 0, 15])
plt.show()


