
Australia used to be very hot, which is why BOM hides all temperatures before 1910
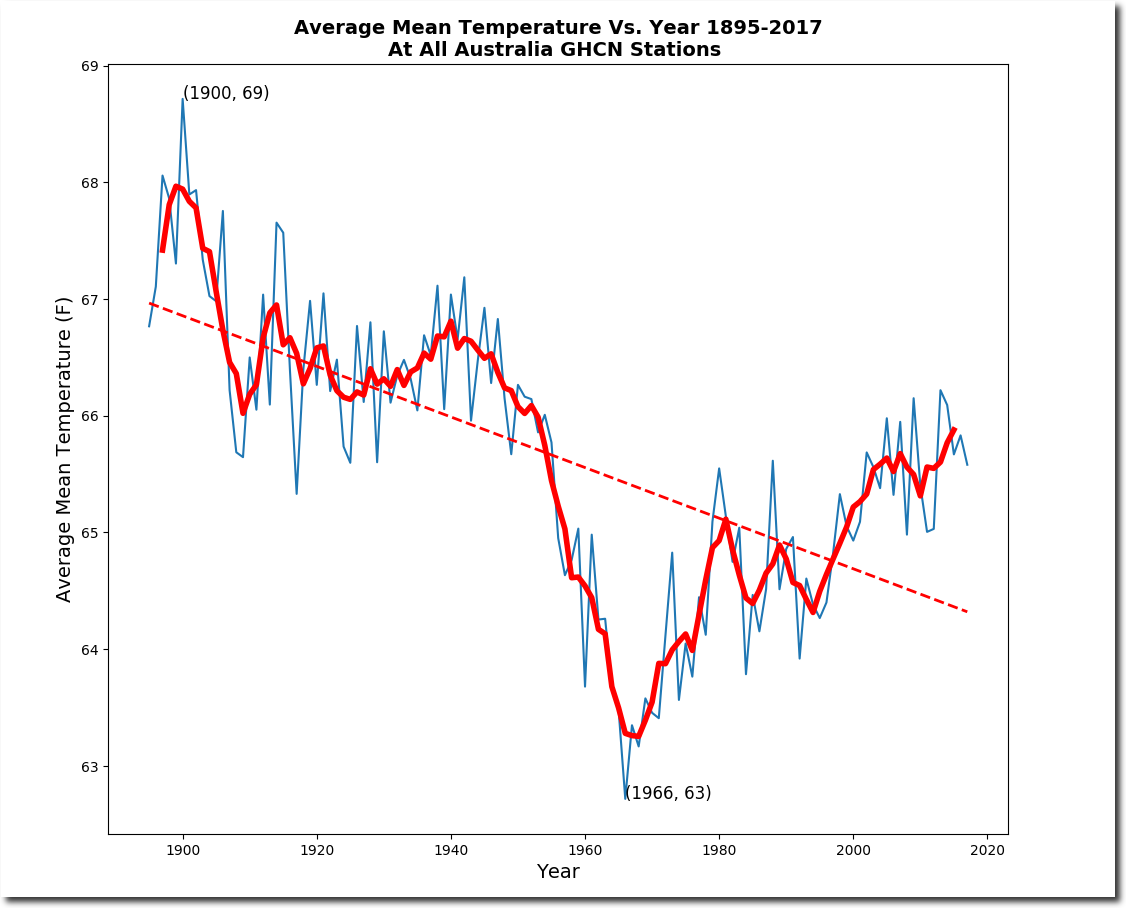
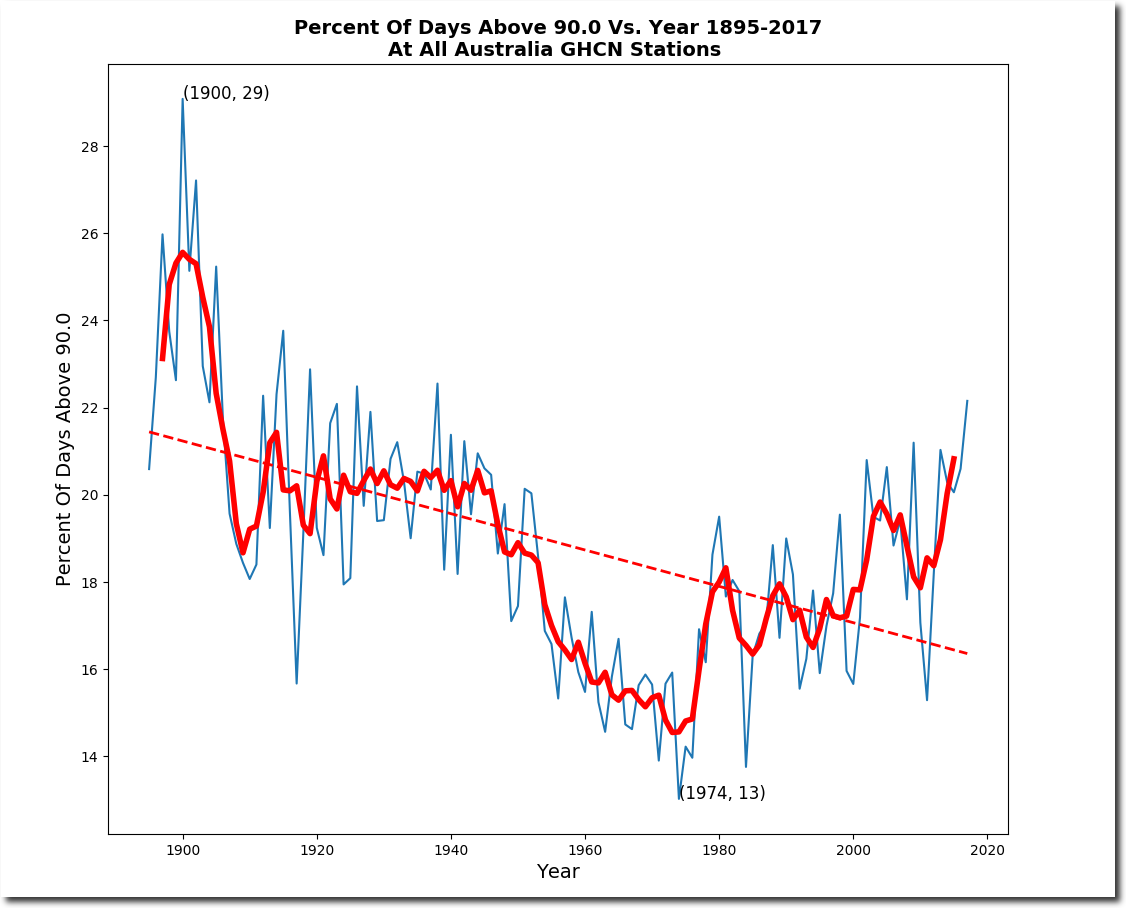
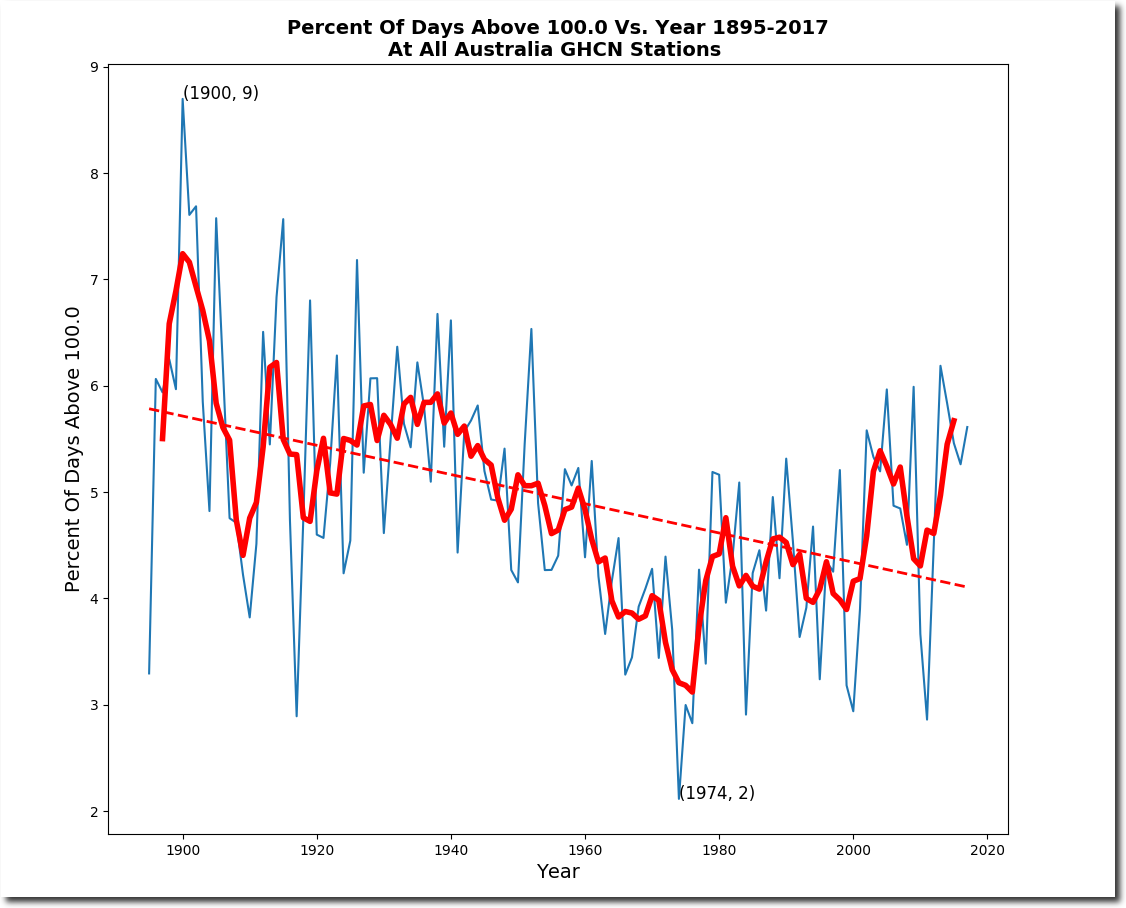
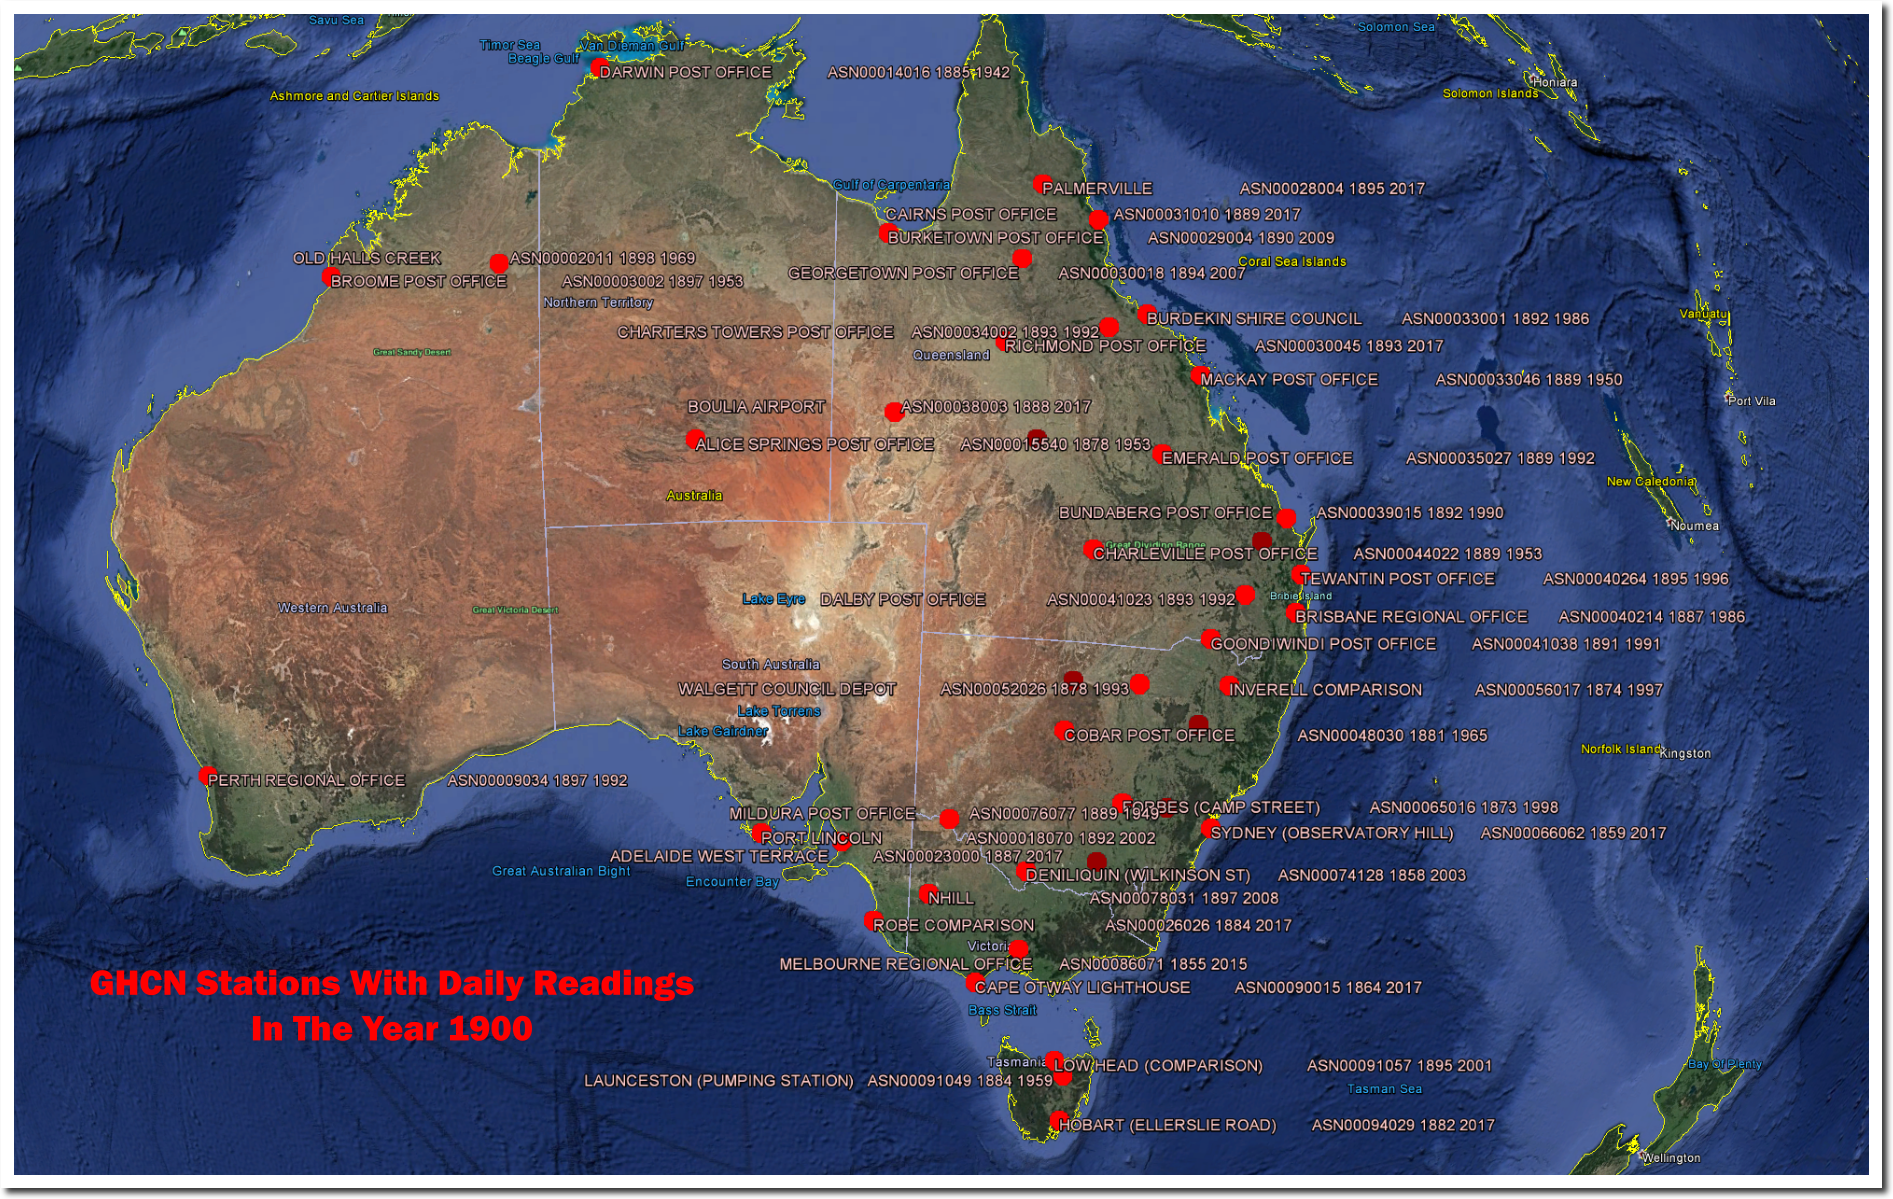
The hottest year in Australia was 1900. This is where GHCN stations were located than year.
Australia used to be very hot, which is why BOM hides all temperatures before 1910
The hottest year in Australia was 1900. This is where GHCN stations were located than year.
