
Twenty years ago, government experts said 1.5C warming in the Arctic from 1840 to 1950 was largely due to natural forces, but recent warming “must be attributed to greenhouse gases”
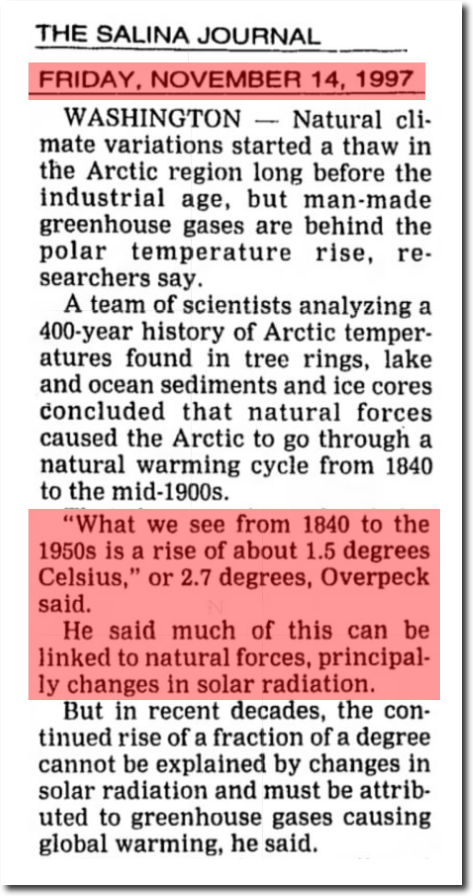
14 Nov 1997, Page 7 – The Salina Journal at Newspapers.com
Overpeck’s conclusion about recent warming was undoubtedly due to using fake NASA/NOAA graphs like this one.

Data.GISS: GISS Surface Temperature Analysis
The graph above was massively tampered with to cool the past. The next graph shows the data has been altered.
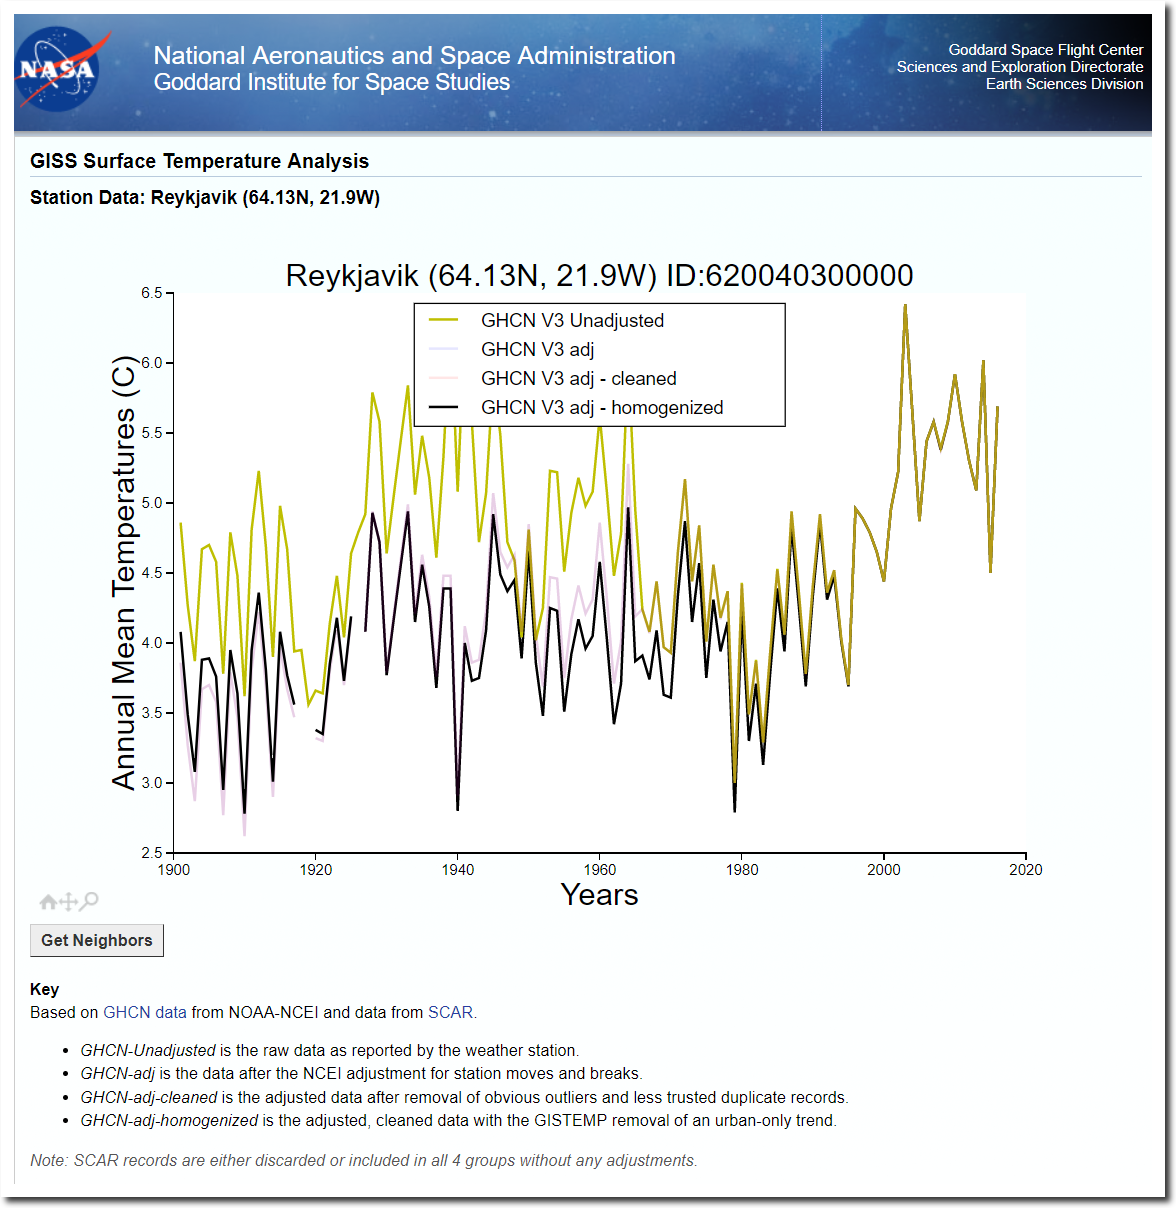
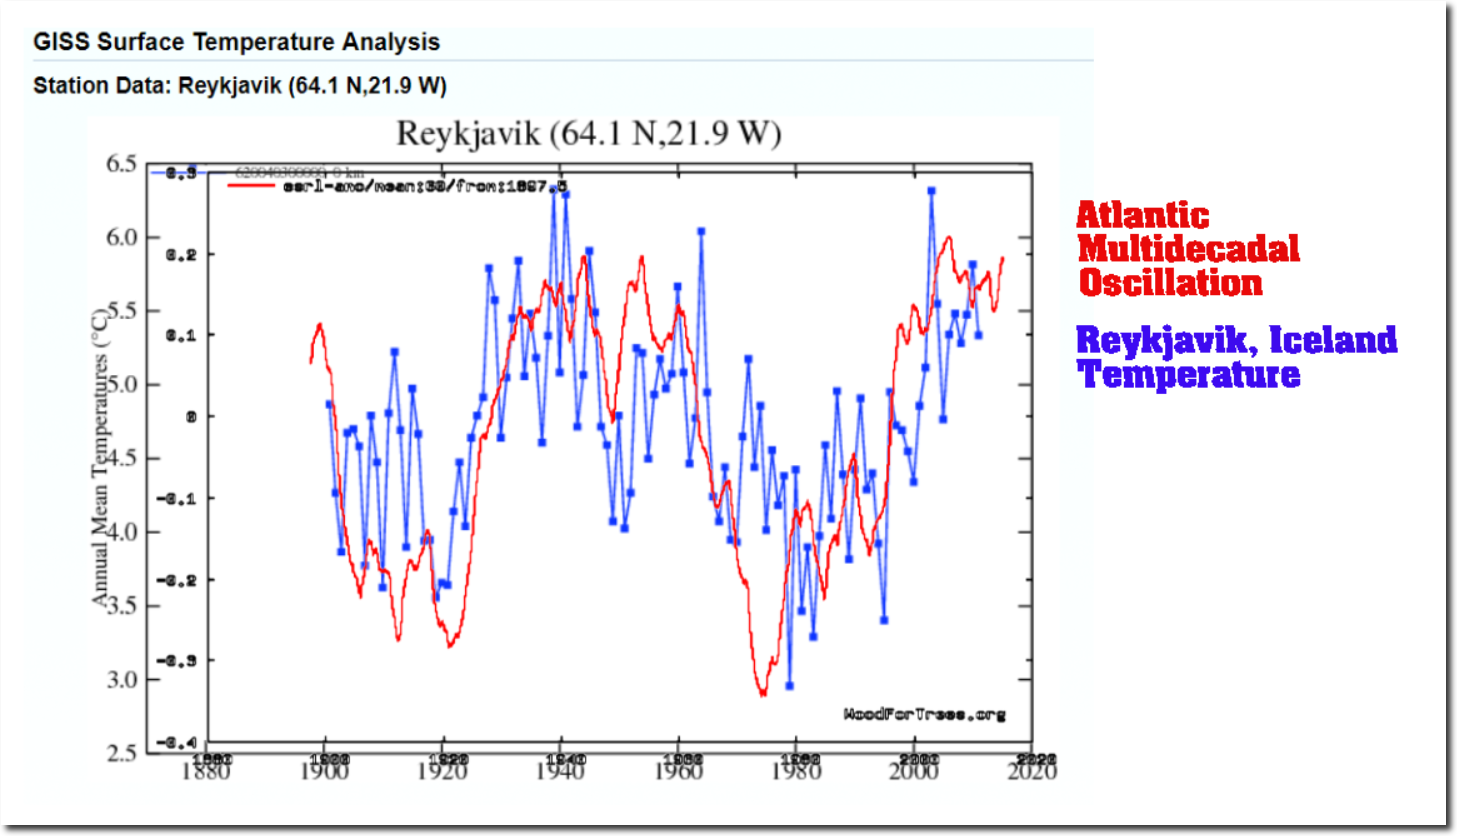
Data.GISS: GISS Surface Temperature Analysis
Had Overpeck used the raw data, he would have seen a nearly perfect correlation between Eastern Arctic temperatures and the Atlantic Multidecadal Oscillation (AMO.)
The AMO peaked about ten years ago. Since then, the Arctic sea ice minimum has gotten larger.
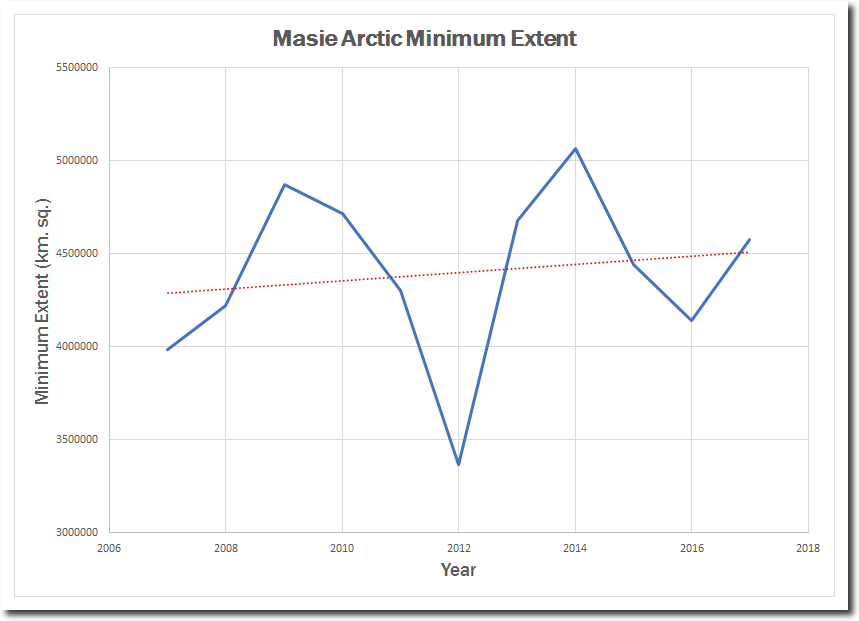
masie_4km_allyears_extent_sqkm.csv
There is no reason to believe that changes in greenhouse gases have had any significant influence on the Arctic climate. Observations show that Arctic temperatures rise and fall with the AMO. 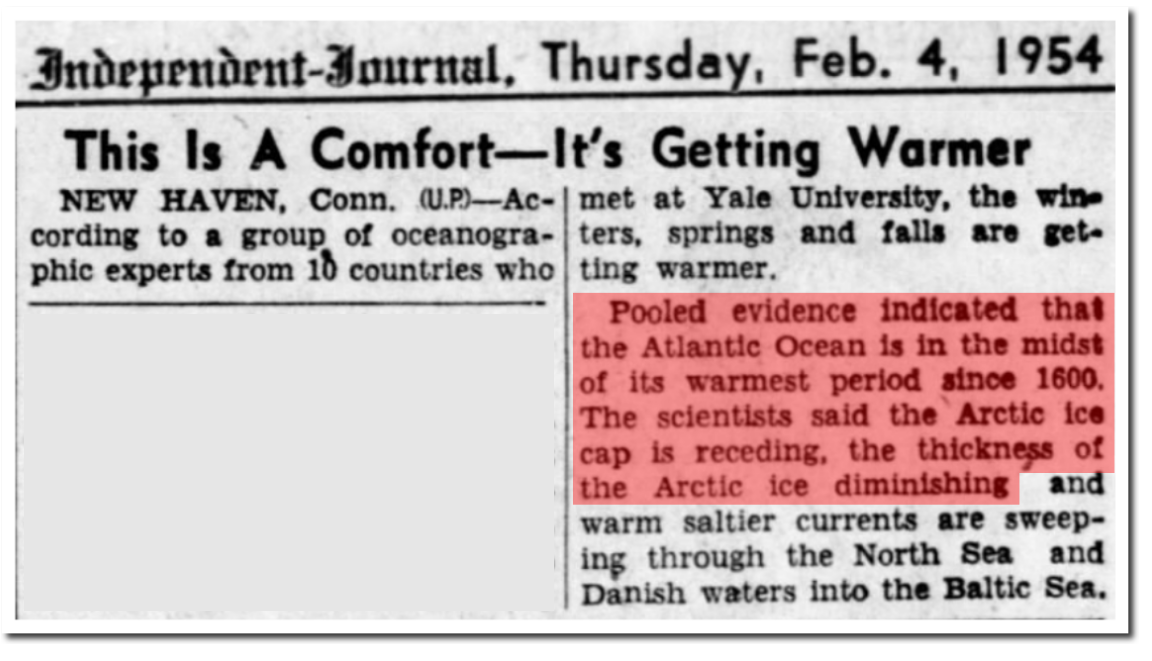
04 Feb 1954, Page 26 – Daily Independent Journal at Newspapers.com
NASA and NOAA are destroying science and policy with their data tampering.
