Arctic sea ice extent is normal, and is much higher than one year ago, five years ago, and ten years ago.
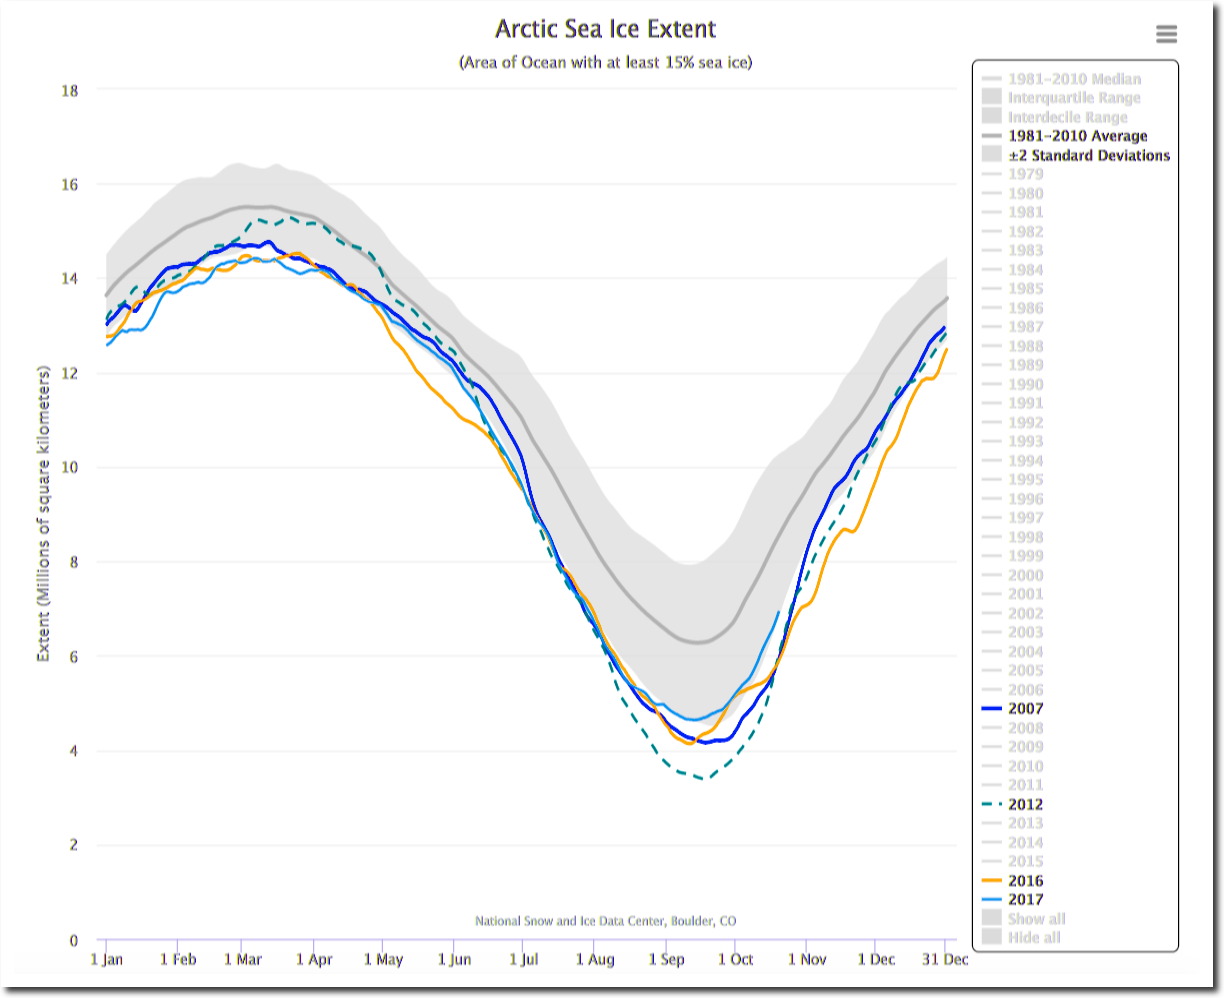
Charctic Interactive Sea Ice Graph | Arctic Sea Ice News and Analysis
Greenland’s surface has gained more than 100 billion tons of ice since September 1, just below last year’s record high levels.
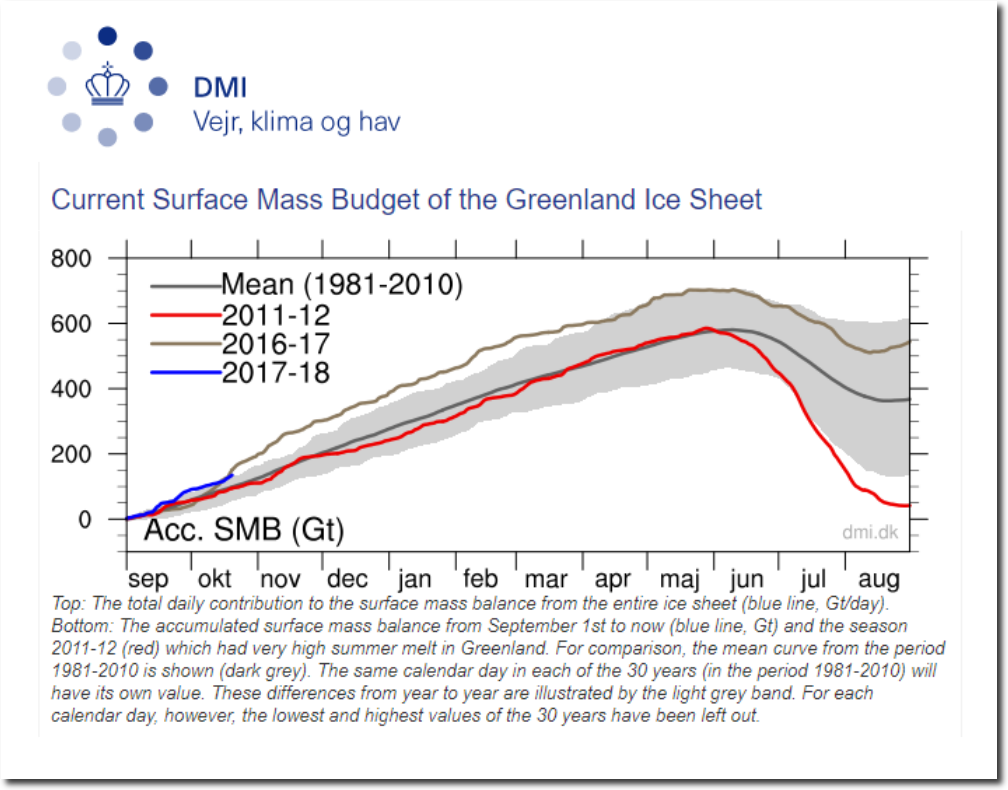
Greenland Ice Sheet Surface Mass Budget: DMI
Meanwhile, criminals in the press and scientific community continue to lie about the state of the Arctic. Deceiving the public is what they do for a living.
MASIE is also above the 10 year average.
Climate alarmists seem lost in the fog of their own phony stats.
Tying your two posts from today together, one wonders how the warmist sea level fictional rise has occurred when ice melt is demonstrably seasonal and local to the poles on a cyclical basis. Just so long as I didn’t have to engage in explaining a MSL datum, plate techtonics, complex systems behavior, or the metonic cycle as a result, it might be fun to ask the question.
This news will infuriate alarmists, as ‘melting polar ice caps’ has been probably their ace in the pack. More than anything else it’s been played as THE trump card, a sure-fire sign of looming climate catastrophe caused by mankind burning fossil fuels, so to see it kicked in the balls this hard will be rather painful for them. They will of course say nothing about these two inconvenient facts.
They lie about temps so why would anyone think they wouldn’t do the same with ice?
But what is the problem with an ice free Arctic?
Melting sea ice does not cause sea level rise, more open waters will increase radiative loss thereby acting as a negative forcing, and more open water will increase cloudiness again acting as a negative feedback, and yet further, additional clouds will cancel out any reduction in albedo due to loss of ice.
Was regularly summer ice free during the first 7000-8000 year of the Holocene.
And guess what
The World is STILL HERE.
Humans and other animals not only survived.. THEY THRIVED. !!
“But what is the problem with an ice free Arctic?”
Nothing at all, except that the ever varying Arctic Sea ice was apparently intentionally selected by the doomsayers as their most important canary in a coal mine. I think it is funny as hell that they pay so much attention to it and lie about it so much as if that ice is a harbinger of climate doom. Every year they make predictions for it’s demise, and every year they’re disappointed. They are more faithful than Cubs fans were during over a century of World Series drought.
If the world’s ice were disappearing, as alleged, that would be (on balance) a good thing.
Warmth supports life, cold kills.
Unfortunately they are lying (as usual) and ice is increasing on most timescales.
How can Arctic ice be disappearing while Northern Hemisphere snow cover is increasing? Doesn’t make sense.
Greenland SMB seems to change every time I see it put up. There may be two versions by different groups?
I have seen one with a lot more peaks and troughs a free weeks ago.
Is it a backwards smoothing applied to the levels?
Does it show on the wayback machine if anyone knows how to use one.
Anyone else notice the peaks and troughs changed?
I think you seeing two different graphs from DMI. Here is the link showing both.
http://www.dmi.dk/en/groenland/maalinger/greenland-ice-sheet-surface-mass-budget/
The top chart shows Gt/day
The bottom shows cumulative Gt since Sept. 1st.
When are the Danes ever going to modify their claim, “The calving loss is greater than the gain from surface mass balance, and Greenland is losing mass at about 200 Gt/yr”?
It was never measured except by the error prone farce that is GRACE.
Thing is Greenland sits partially over a major moving magma sack, so all gravity-based measurements are essentially meaningless nonsense.
And let us not forget the following prognostication from March of this year…
—
Griff says:
March 31, 2017 at 5:21 pm
(I thank you! as they used to say when coming on stage…)
The DMI chart is showing you that on terms they measure it, extent is no better than last year, which was one of the 3 lowest extents on record.
Other extent measurements show the ice at a record low extent
https://seaice.uni-bremen.de/data/amsr2/today/extent_n_running_mean_amsr2_previous.png
And here is the daily average sea ice thickness:
http://psc.apl.uw.edu/wordpress/wp-content/uploads/schweiger/ice_volume/Bpiomas_plot_daily_heff.2sst.png
This year is going to be another disaster for artic sea ice.
I’ll be sure to tell you each and every day it continues to be a record low.
—
Thanks for the reminder, Frank. Even if we forget her stupid serial prognostications, only morons use words like “disaster” when speaking about frozen water.
“This year is going to be another disaster for artic sea ice.”
Its certainly been a disaster for the anti-CO2 arctic sea-ice bed-wetters.
poor little griff must be totally busting to find another reason for his chicken-little cackling.
Oh, she denies that Greenland SMB is growing and that Arctic sea ice is not going away as it was predicted to do by those she believes. It really is pathetic.