
“Insensibly one begins to twist facts to suit theories, instead of theories to suit facts.”
– Sherlock Holmes
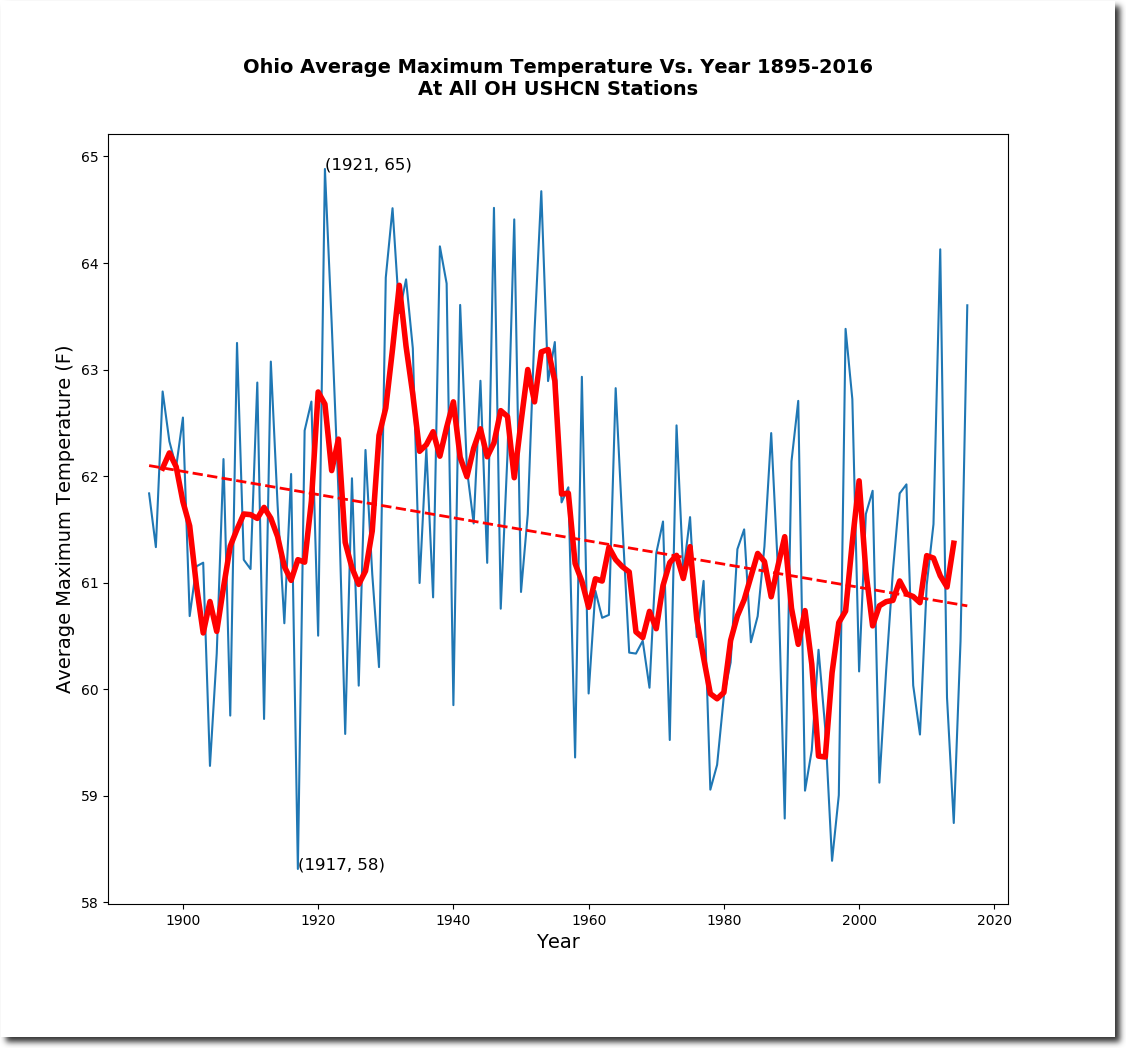
I had a request from a reader to cover Ohio temperatures/data tampering. Afternoon temperatures in Ohio were much higher prior to 60 years ago. After 1955, maximum temperatures plummeted and never recovered.
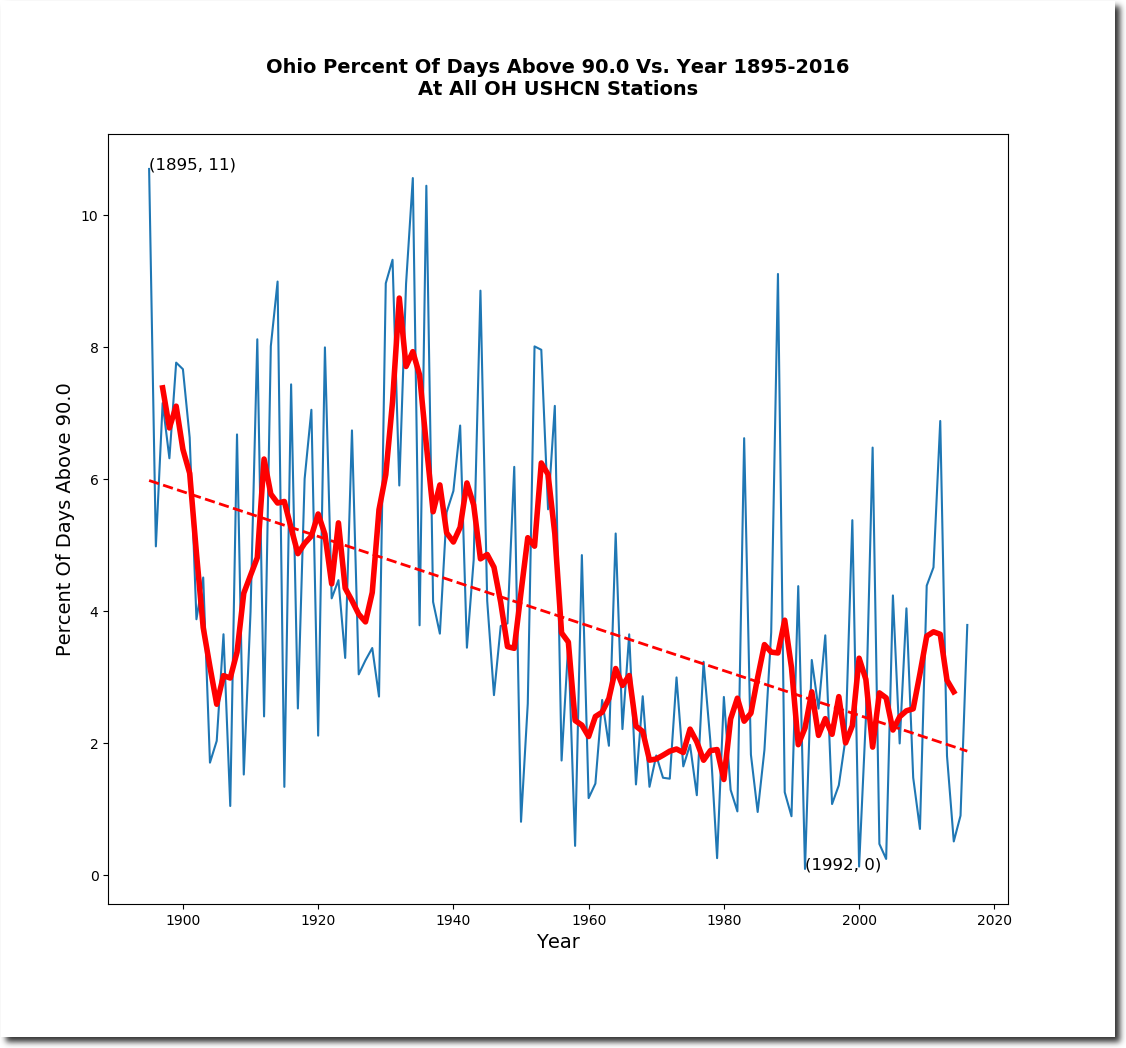
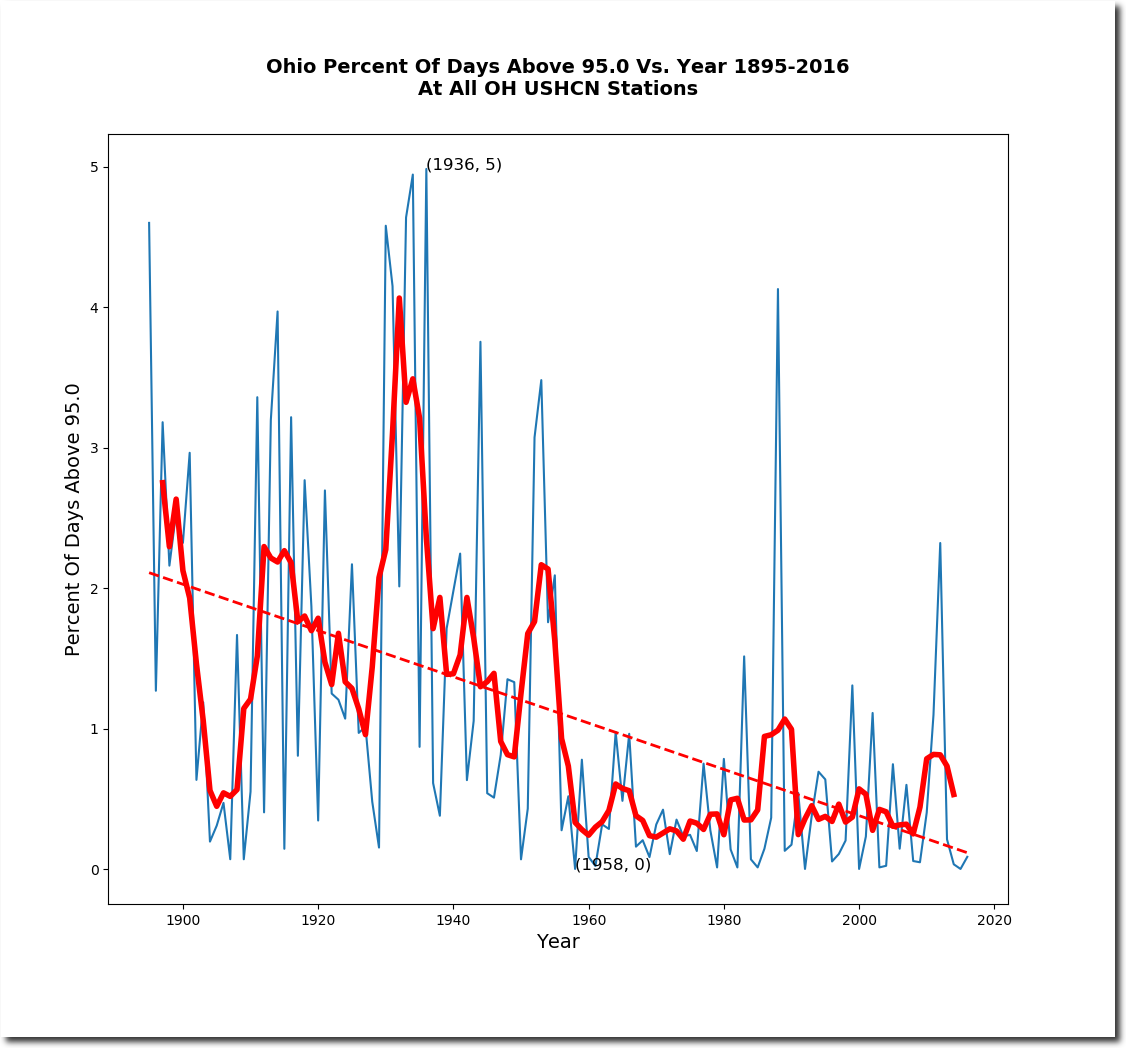
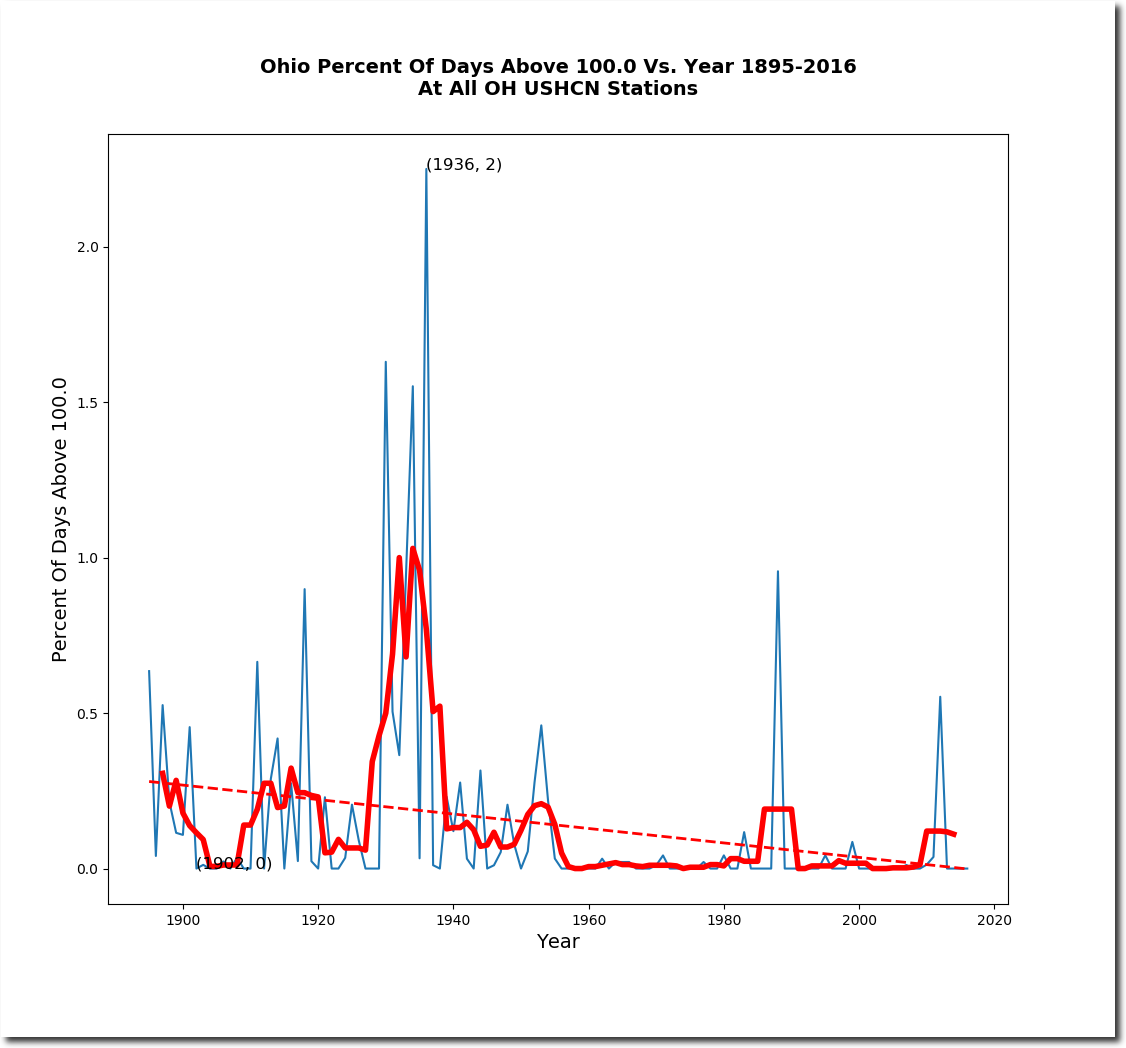
The percent of hot days in Ohio has dropped off dramatically since the 19th century.
The mean temperature in Ohio also shows cooling.
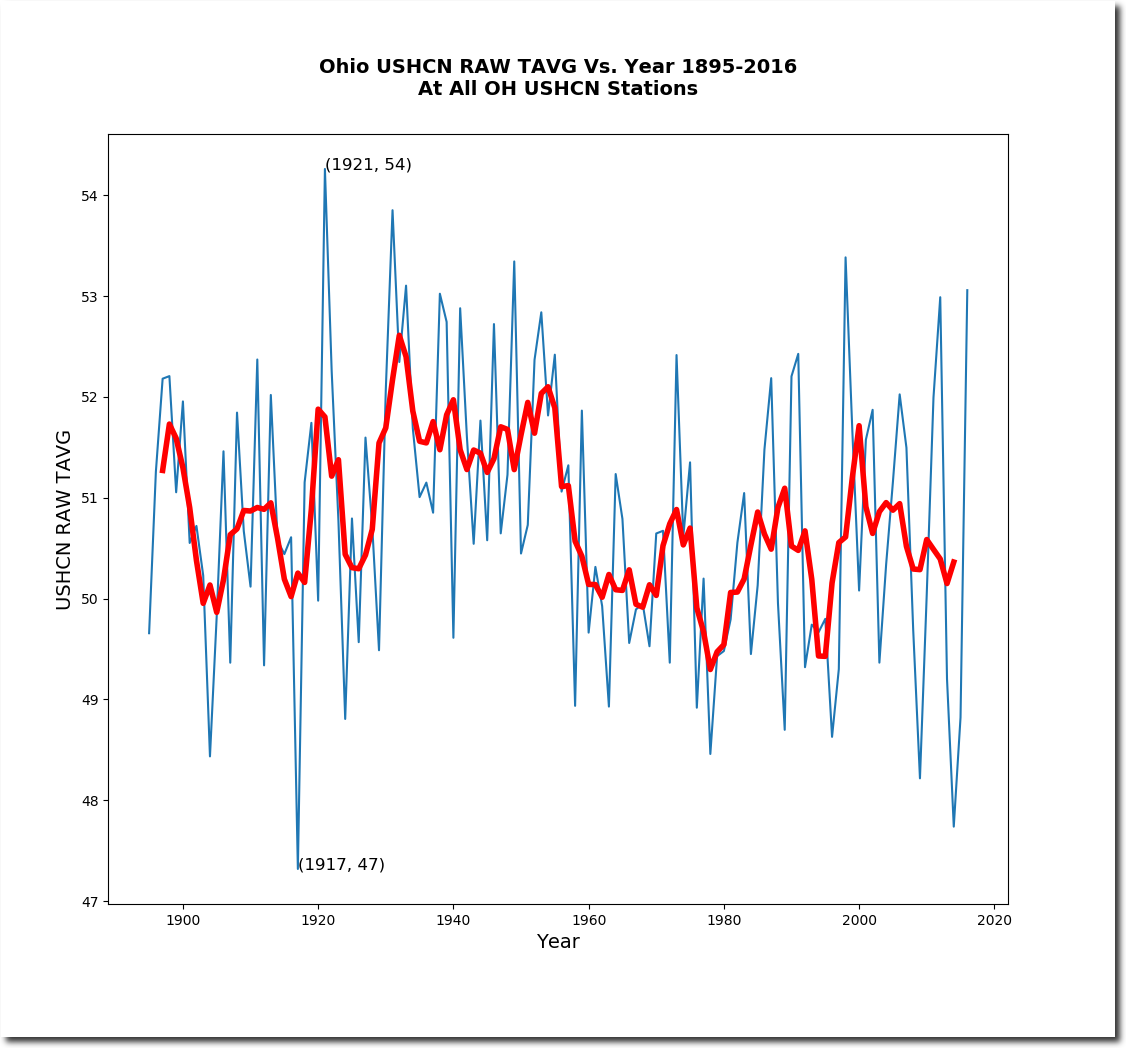
But NOAA massively tampers with the data to produce warming.
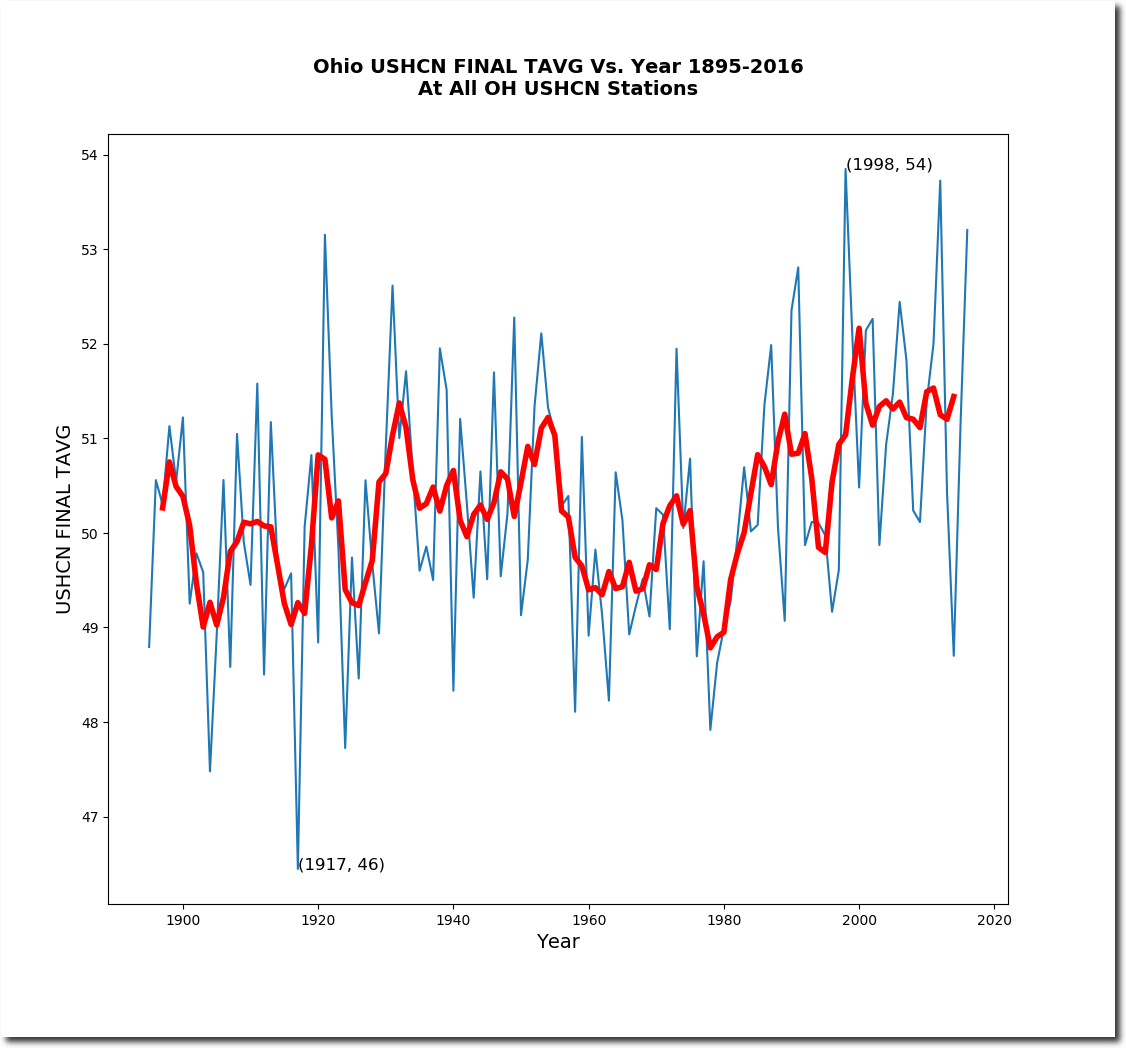
The hockey stick below shows how NOAA cools pre-1990 temperatures and warms post-1990 temperatures, to turn cooling into warming.
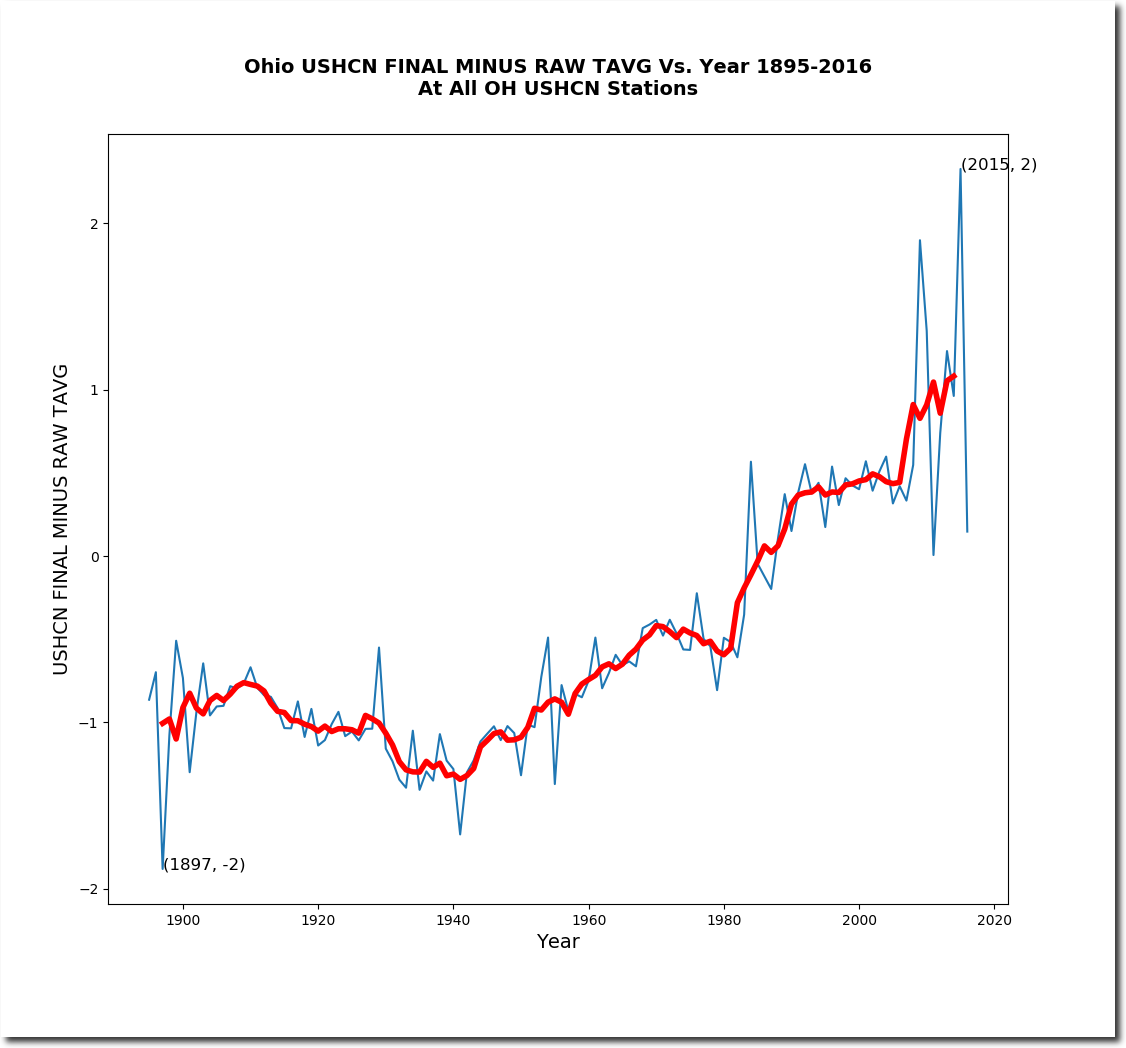
Global warming, and in particular US warming, is a fabrication of criminals working at government agencies. It has nothing to do with climate.
Below is the list of stations used in this analysis.
| BUCYRUS | USC00331072 |
| CADIZ | USC00331152 |
| CHIPPEWA LAKE | USC00331541 |
| CIRCLEVILLE | USC00331592 |
| COSHOCTON WPC PLT | USC00331890 |
| DEFIANCE | USC00332098 |
| DELAWARE | USC00332119 |
| FINDLAY WPCC | USC00332791 |
| GREENVILLE WTP | USC00333375 |
| HILLSBORO | USC00333758 |
| HIRAM | USC00333780 |
| KENTON | USC00334189 |
| MC CONNELLSVILLE LK 7 | USC00335041 |
| MILLERSBURG | USC00335297 |
| MILLPORT 4 NE | USC00335315 |
| NORWALK WWTP | USC00336118 |
| OBERLIN | USC00336196 |
| PHILO 3 SW | USC00336600 |
| PORTSMOUTH-SCIOTOVILLE | USC00336781 |
| TIFFIN | USC00338313 |
| UPPER SANDUSKY | USC00338534 |
| URBANA WWTP | USC00338552 |
| WARREN 3 S | USC00338769 |
| WAUSEON WTP | USC00338822 |
| WAVERLY | USC00338830 |
| WOOSTER EXP STATION | USC00339312 |
