
From the 1920’s to the 1950’s, the Arctic warmed tremendously. Glaciers were disappearing and collapsing, and Arctic sea ice was thinning and shrinking.
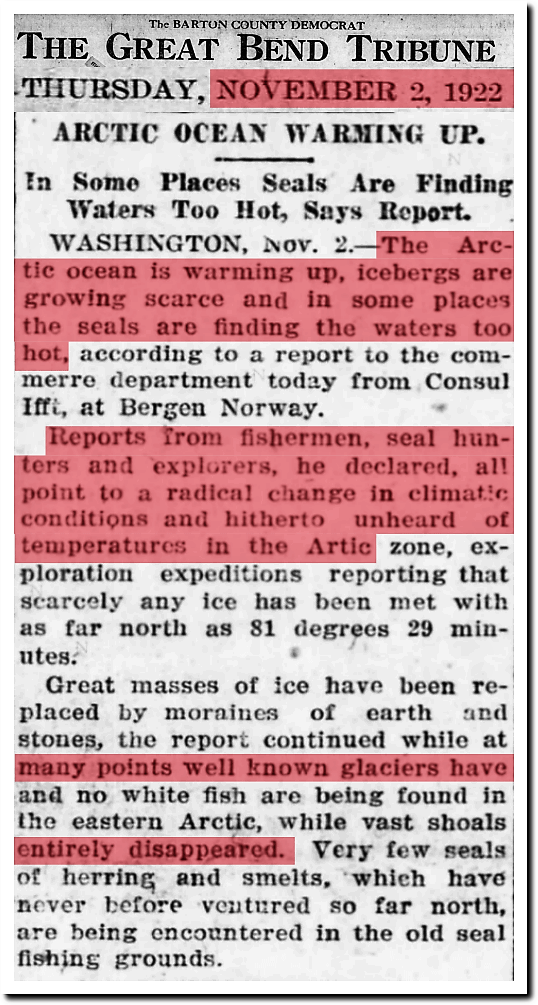
2 Nov 1922, Page 1 – Great Bend Tribune at Newspapers.com

17 Dec 1939, Page 15 – Harrisburg Sunday Courier
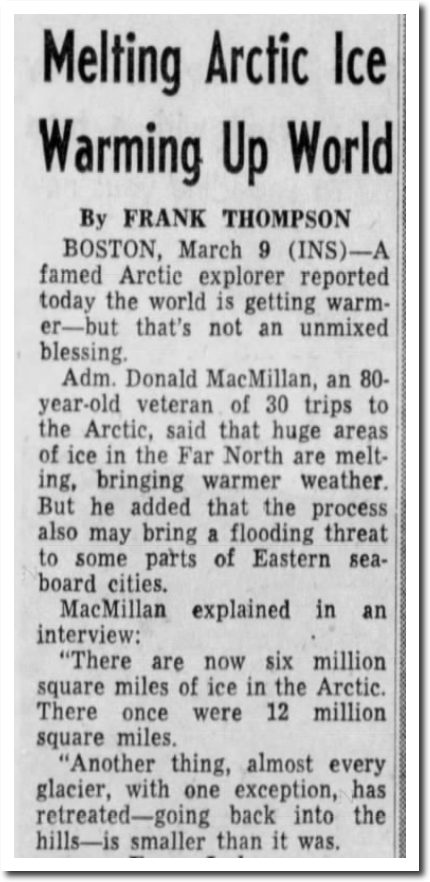
10 Mar 1955, Page 3 – Democrat and Chronicle at Newspapers.com
Sixty years ago, the New York Times reported that Arctic sea ice was two meters (seven feet) thick, and that it was fake news to believe Arctic sea ice was anything other than a thin crust.
Although the idea that a solid ice sheet covers the central Arctic has lingered stubbornly in the popular fancy, the northern cap of ice worn by our planet is actually a thin crust—on the whole, only about seven feet thick—over an ocean two miles deep in places.

The Changing Face of the Arctic; The Changing Face of the Arctic – The New York Times
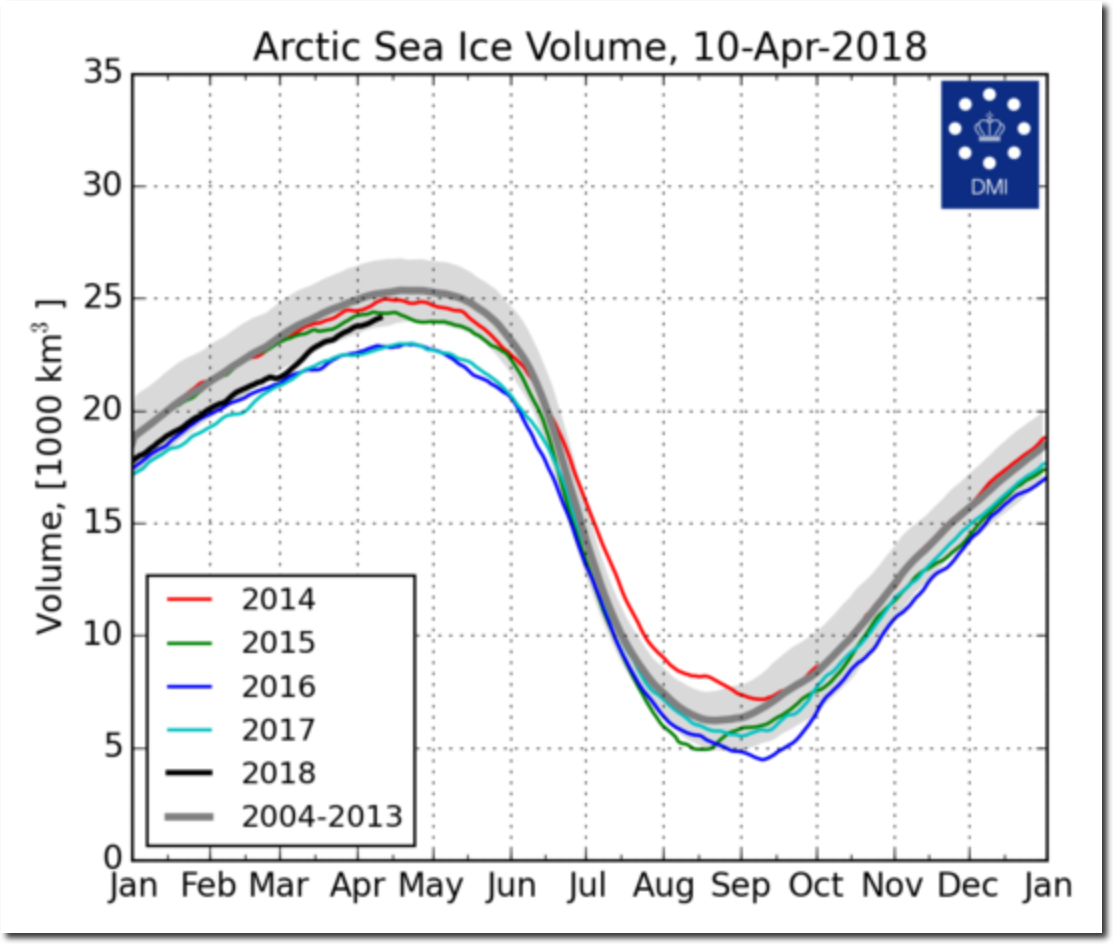
Sixty years later, Arctic sea ice still two meters thick – 24,000 km³ spread out over a little more than 12,000,000 km².
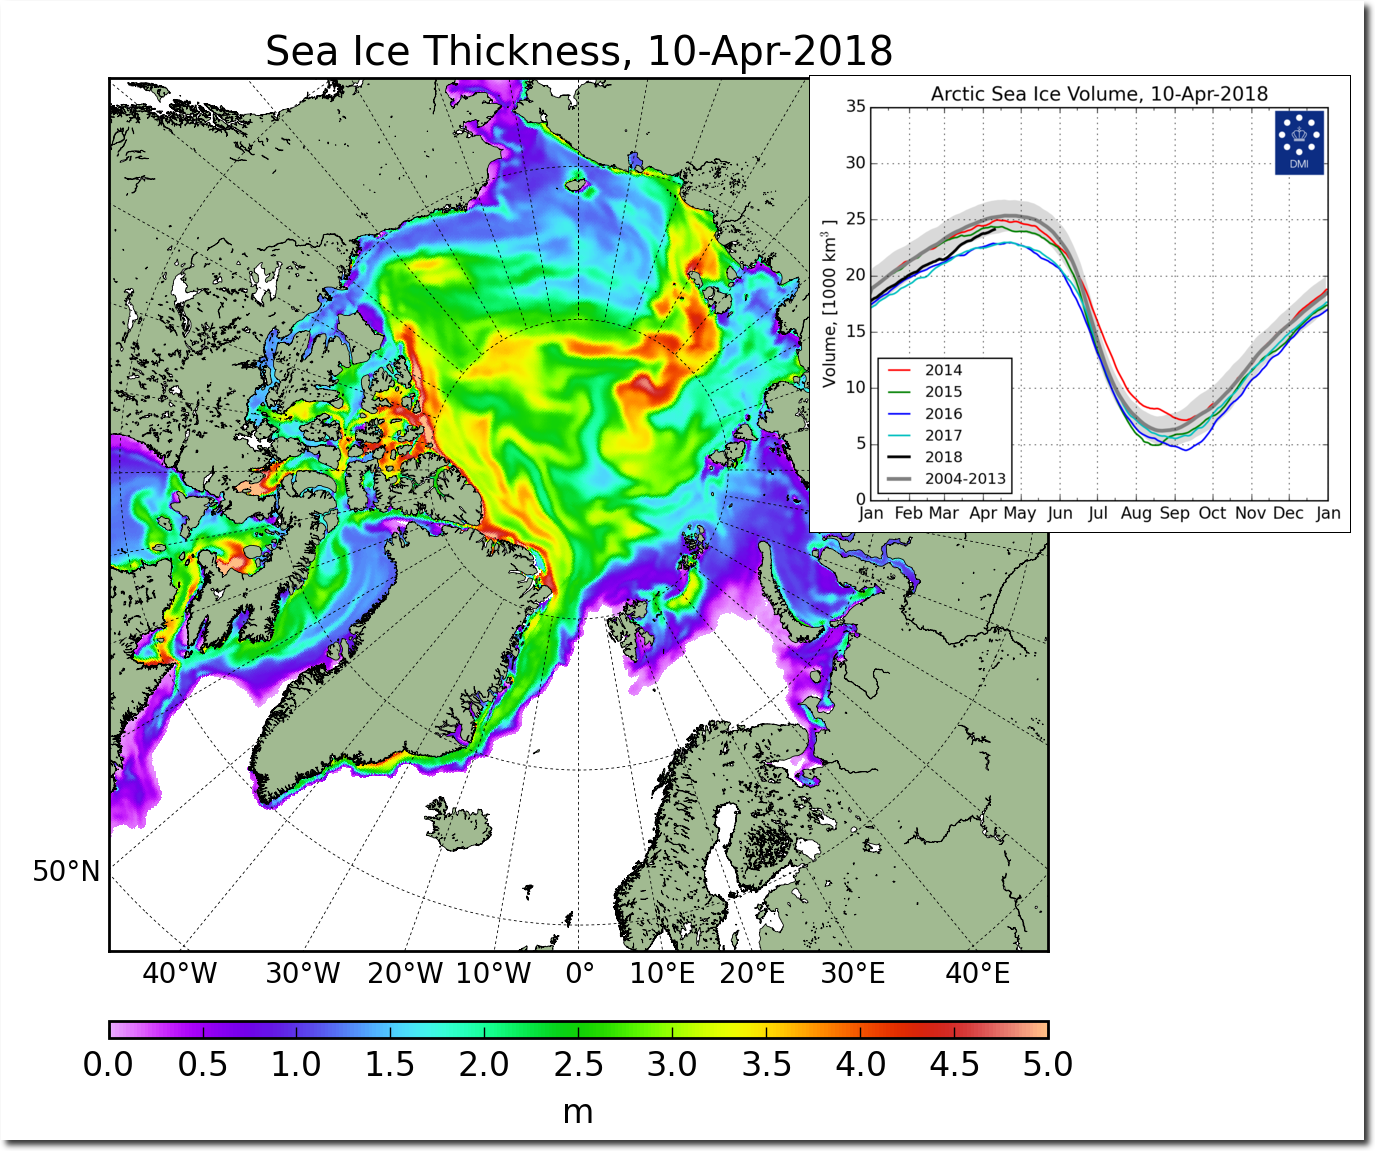
FullSize_CICE_combine_thick_SM_EN_20180410.png (1337×1113)
Cyclical changes in the weather caused the ice to thicken after 1958, and by 1961 there was unanimous consensus that Earth was cooling.

By 1970, the Arctic climate was becoming more frigid, the ice was getting “ominously thicker” – and scientists were worried about a new ice age.
U.S. and Soviet Press Studies of a Colder Arctic – The New York Times
The polar ice cap had expanded 12% by 1975. Icelandic ports were blocked with ice for the first time in the 20th century.
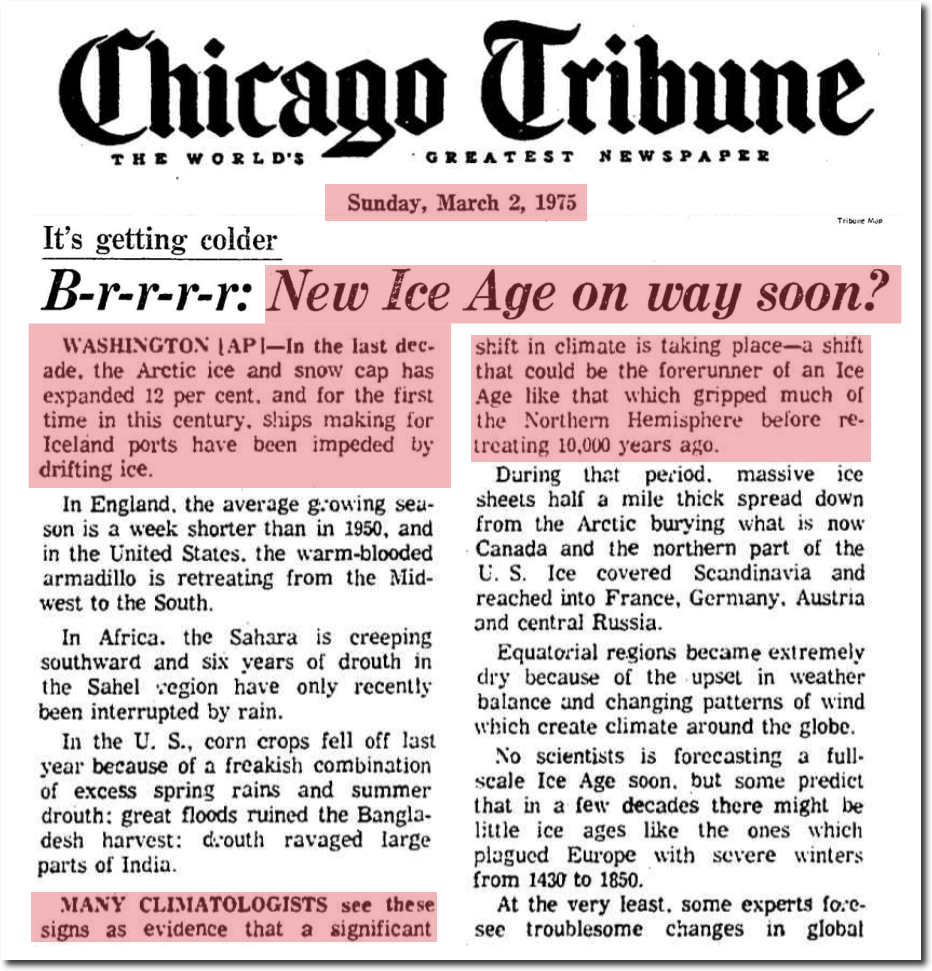
March 2, 1975 – B-r-r-r-r: New Ice Age on way soon? | Chicago Tribune Archive
In the 1985 DOE report (predecessor to the IPCC) they showed these cyclical changes in ice.

Projecting the climatic effects of increasing carbon dioxide (Technical Report) | SciTech Connect
Current NOAA graphs hide all satellite data prior to 1979, in order to make it appear that the ice is disappearing due to global warming.
ftp://ftp.oar.noaa.gov/arctic/documents/ArcticReportCard_full_report2016.pdf
However the 1990 IPCC report showed the inconvenient data NOAA is now hiding.
in 1972-1975 sea-ice extent was significantly less.
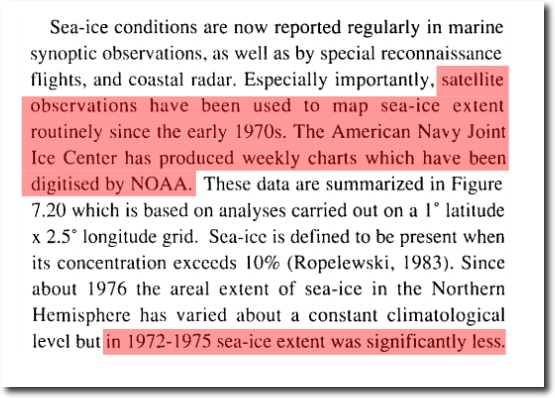
The reason why NOAA starts their sea ice graphs in 1979, is because it was the coldest year on record in much of the Arctic and the ice was very thick. By starting in 1979, they can defraud the public into believing that the ice is disappearing. In fact, the Arctic was warmer around 1940 than in any recent years.

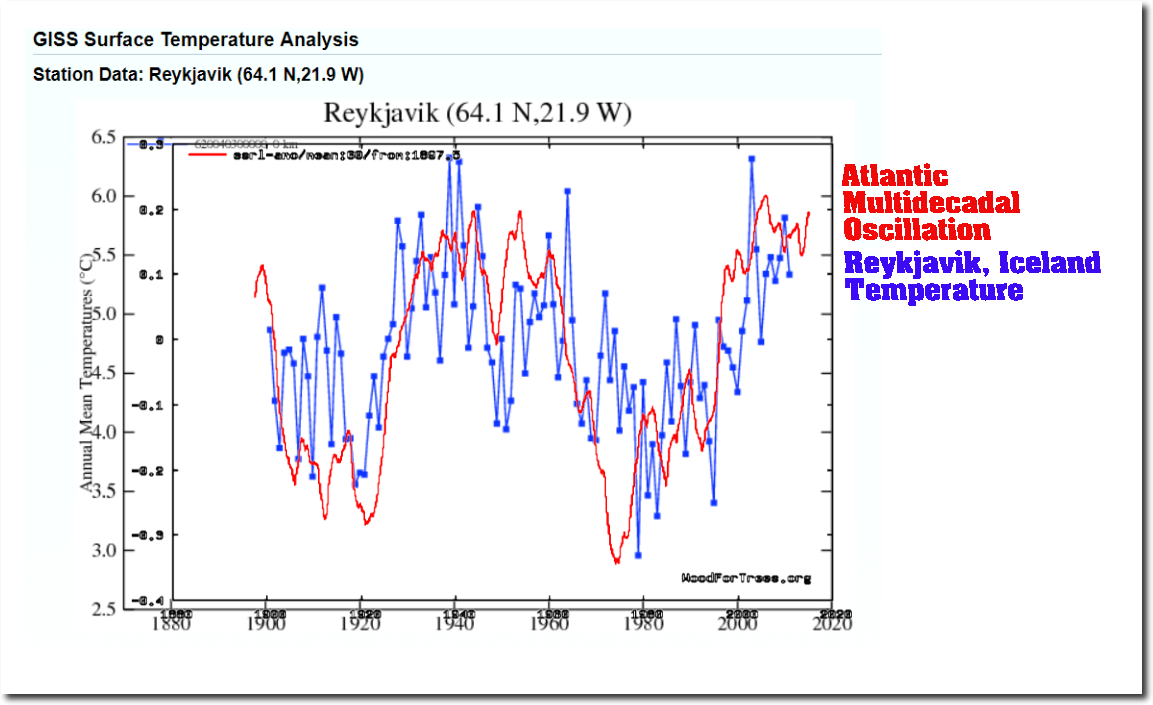
Data.GISS: GISS Surface Temperature Analysis
Eastern Arctic temperatures closely track the Atlantic Multidecadal Oscillation, and show no correlation with atmospheric CO2.
This wrecks global warming theory which is climate scientists’ bread and butter, so NASA simply erases the prior warmth.
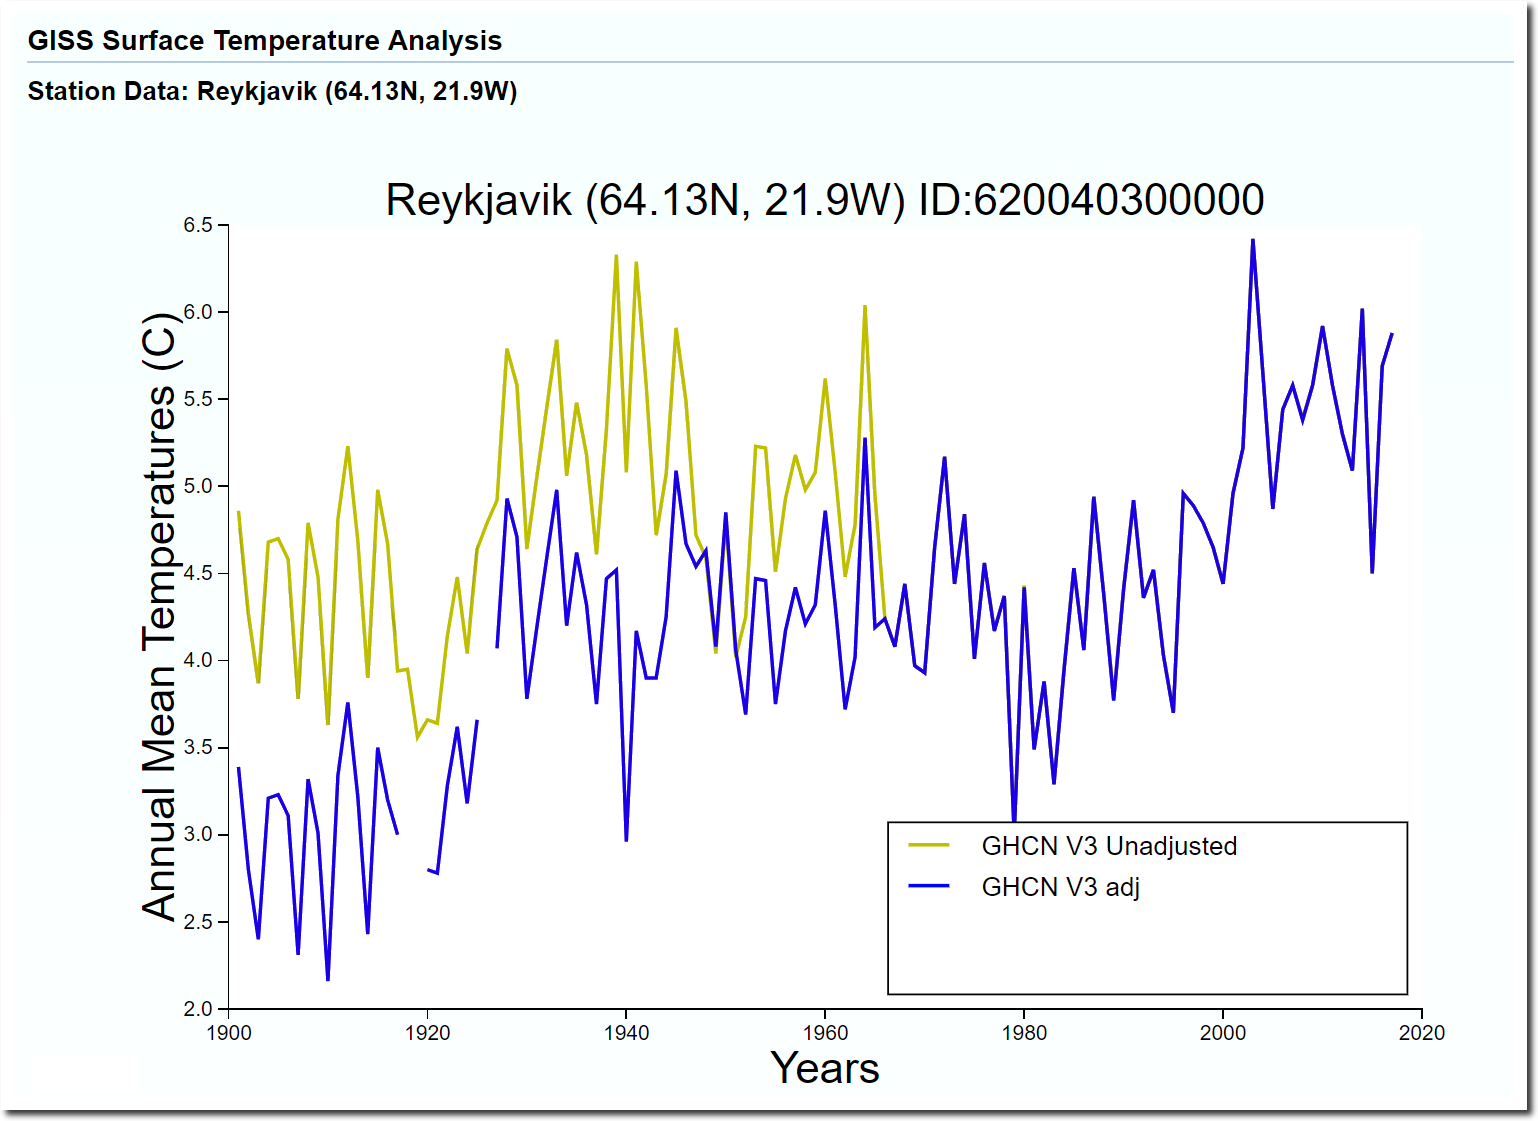
Data.GISS: GISS Surface Temperature Analysis
The good news is that skeptics are starting to have an impact on this corruption. People like myself have been complaining to NASA for years about their Arctic data tampering. This is what their homogenized graph looked like last October.
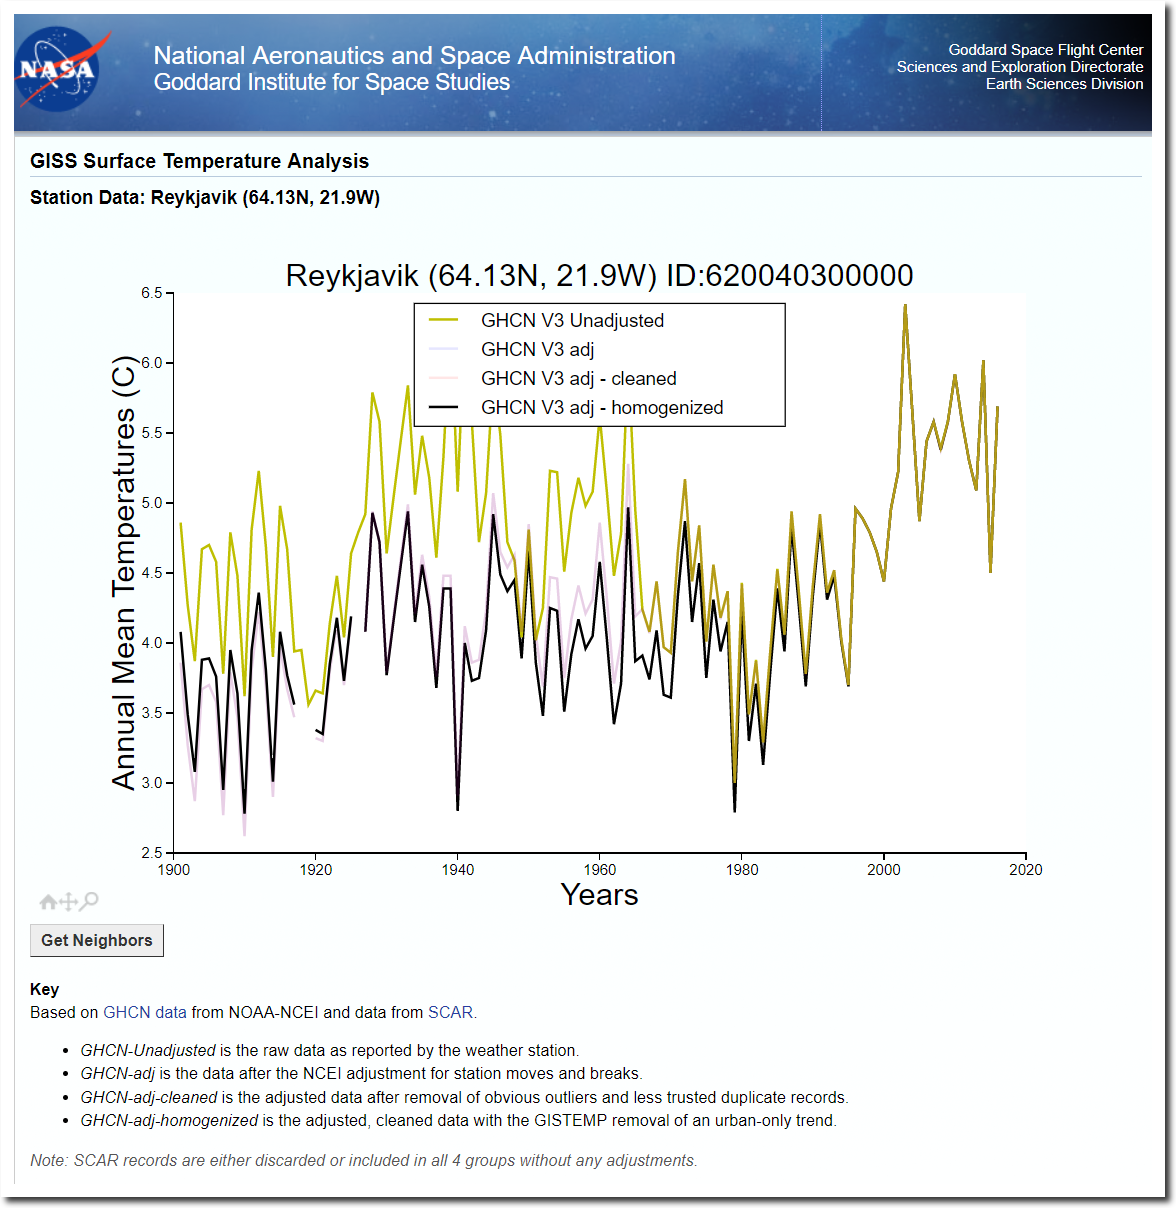
Data.GISS: GISS Surface Temperature Analysis
And this is what it looks like now. Their homogenization is much less fraudulent than it used to be.
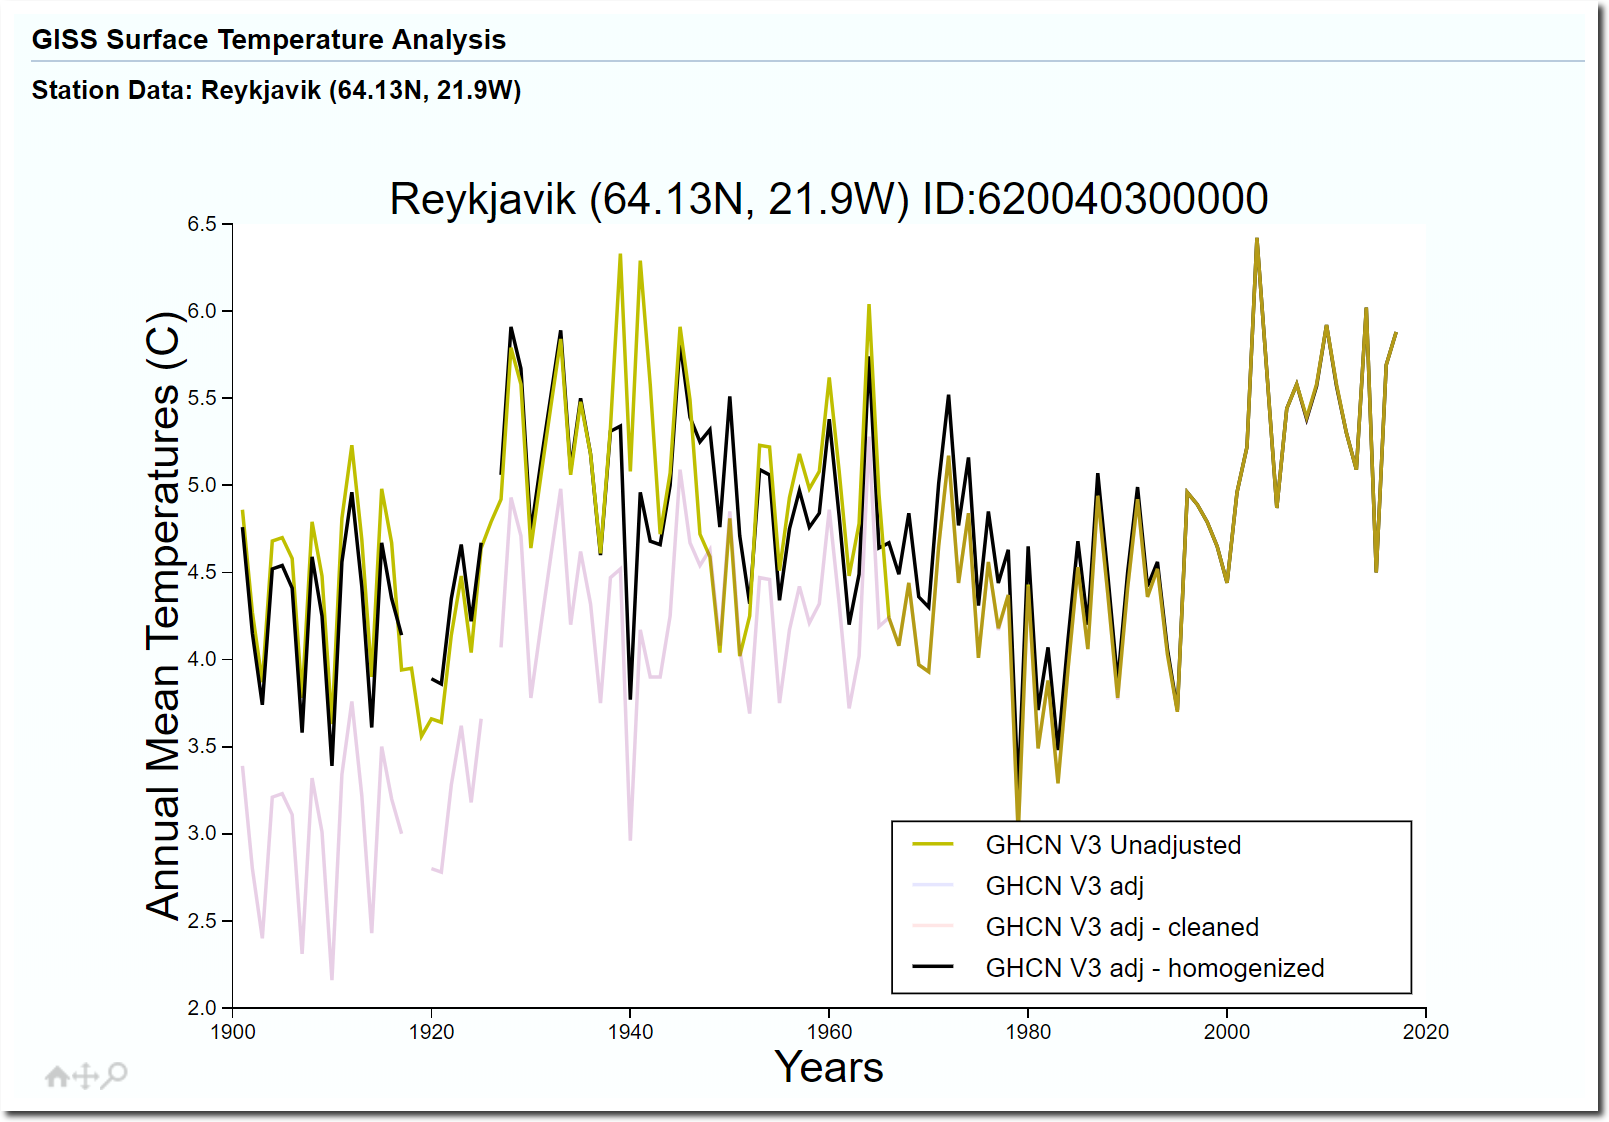
NASA has cleaned up their act considerably, thanks largely to the efforts of Queensland Senator Malcolm Roberts. Two years ago, he called NASA out on their fake Arctic temperatures. Gavin Schmidt angrily denied that they were cheating, but as you can see in the graph above they have quietly stopped their cheating.
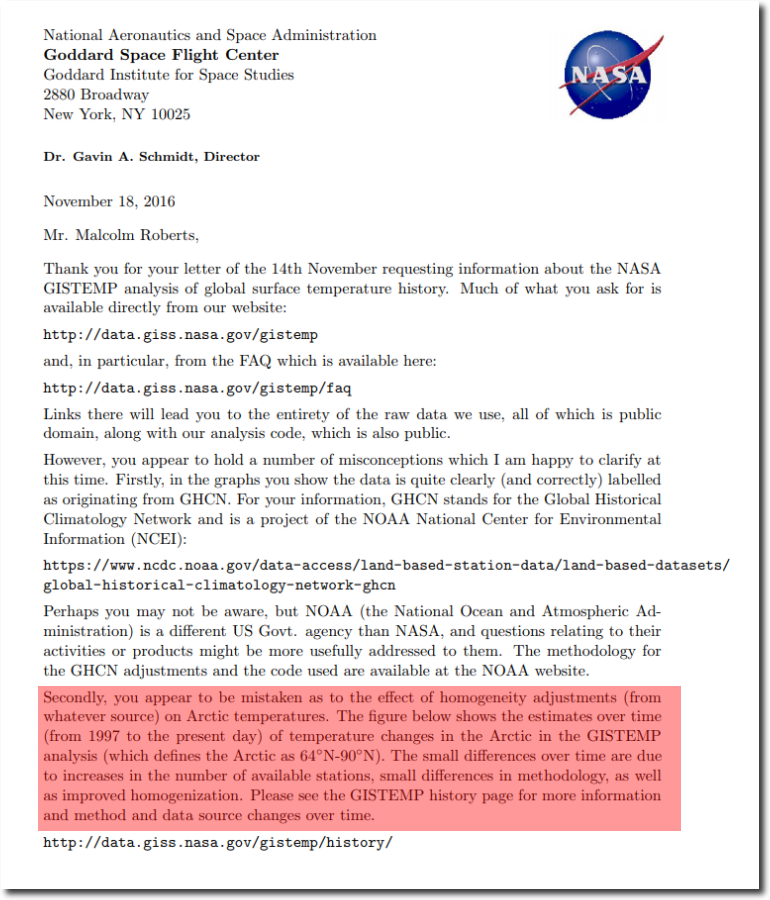
Kudos to Senator Malcolm Roberts. A brave leader making a difference!
