Climate experts frequently cite Greenland’s Petermann Glacier as evidence of the coming apocalypse.
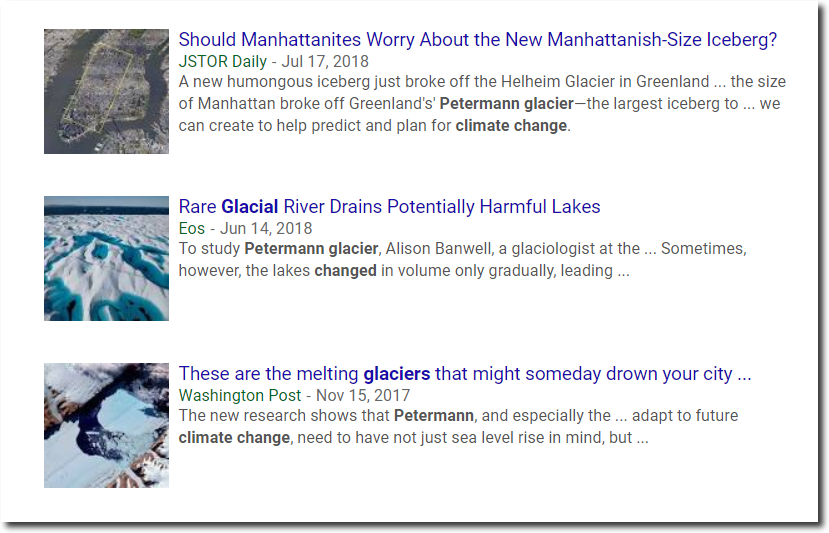
Unlike the imaginary glacier inside the minds of climate experts, the actual Petermann glacier has been growing about ten feet per day since 2012.
Greenland’s surface has gained more than five times as much ice this summer as it did in 2012, and is near a record high.
Greenland Ice Sheet Surface Mass Budget: DMI
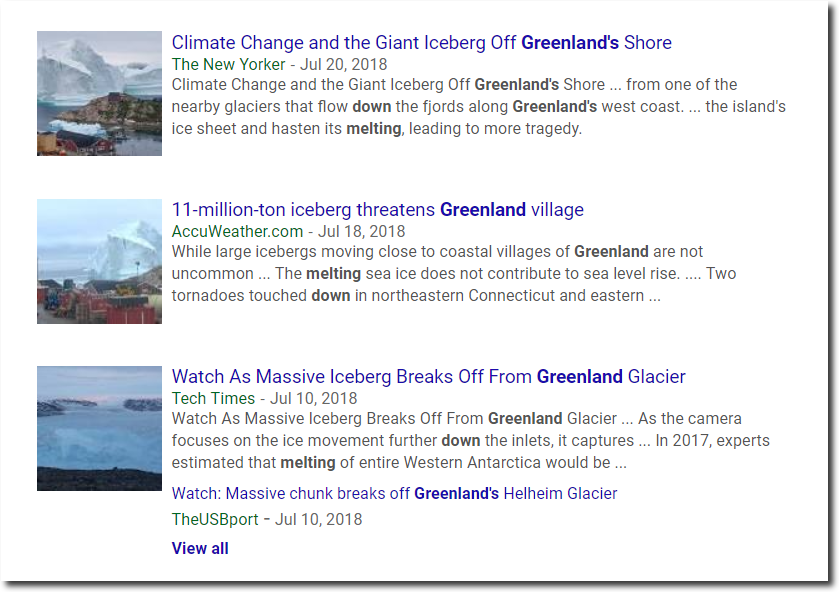
Meanwhile climate experts tell us that Greenland is melting down.
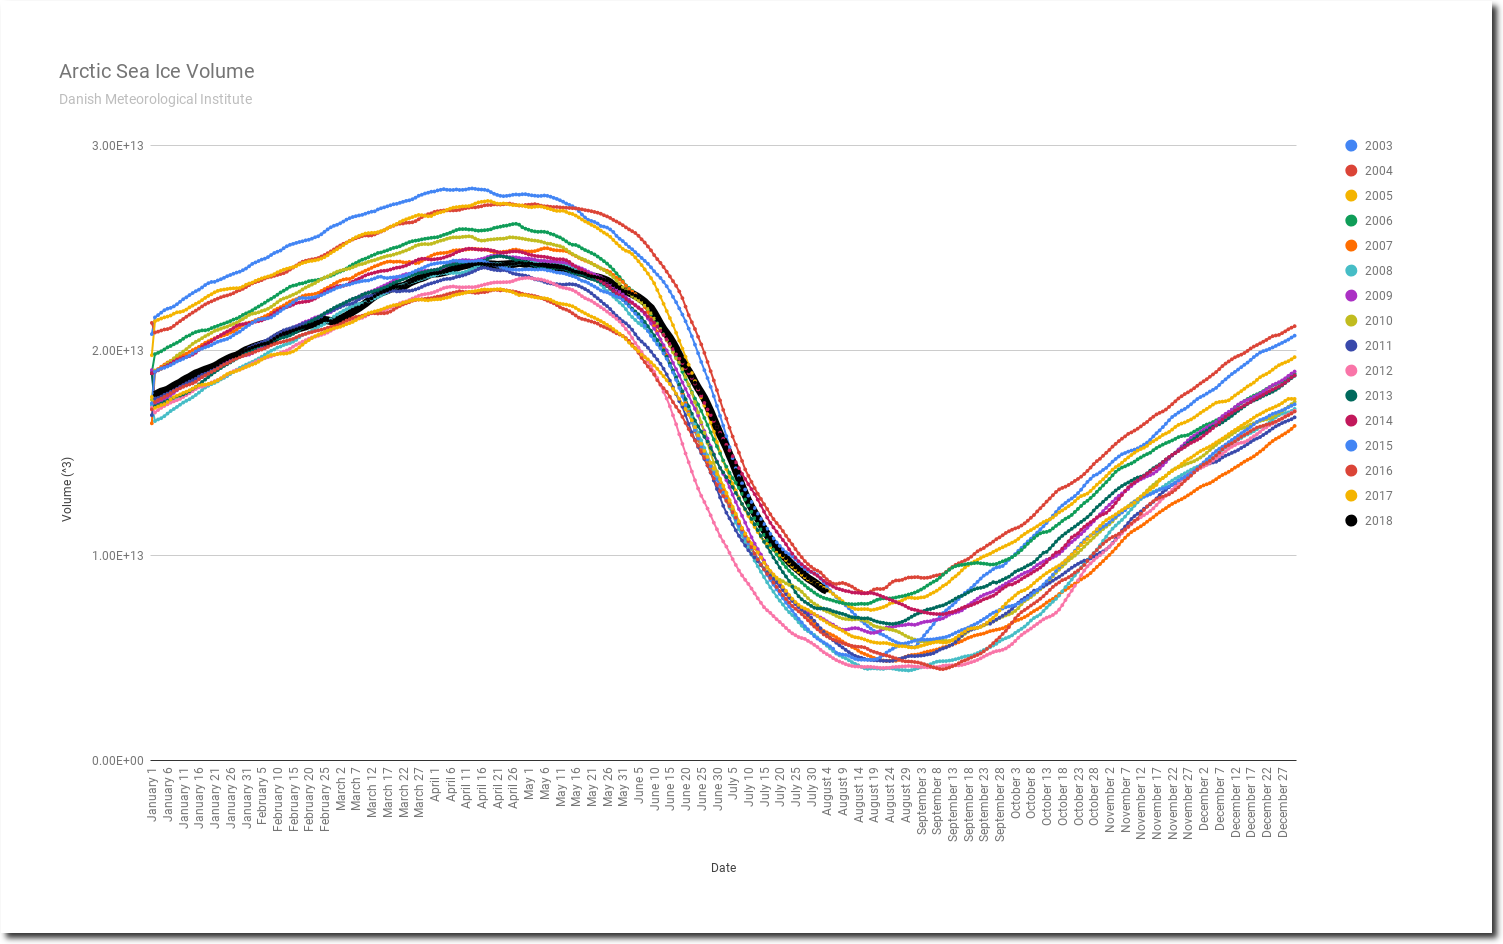
And Arctic sea ice volume is up 60% from this date in 2012.
And of course all of our official Democratic Party affiliated fake news sources claim the exact opposite.
It is all lies all the time with the Democrats – and always has been. Here is Bob Dylan fifty-five years ago, shortly before Lyndon Johnson sent 60,000 men off to die in Vietnam, for absolutely no reason.
The calving front of the Petermann Glacier is still well out on the floating tongue. Therefore contribution of calving – no matter how large or spectacular – to global sea-level = zero. Wake me up when the terminus moves up onto the land.
+100
The ignorance of alarmunists is… well, alarming.
The “party” of reason, logic, and science….NOT
Greenland, Argentina, Canadian Archipelago, Arctic Ocean, Indian Ocean, Atlantic Ocean, all do not fit in the AGW agenda, hence no sound about these areas this summer. With the useless media today, we have to read extra information on the article in order to understand the real picture. The desperate alarmists are clinging to Antarctica/Europe heat, which is skewing the whole temperature graph.
Those are anomaly temps. Antarctica at -72F cannot be referred to as “heat”.
https://www.ventusky.com/?p=-77.9;23.0;3&l=temperature-2m
Thanks Disillusioned that’s an amazing site.
You’re welcome, Rex.
And I thank Tony. ;-)
Why does northeast China / southwest Mongolia show a hot anomaly?
https://weather.com/weather/today/l/Erenhot+China+CHXX0240:1:CH
https://weatherspark.com/y/124207/Average-Weather-in-Erenhot-China-Year-Round
And my apologies ahead of time if I didn’t find a city that matches the China hotspot – my time is short right now.
Greenland Ice Sheet Surface Mass Budget: DMI
The Surface (Ice) Mass Budget isn’t the complete budget only the surface, You have to consider all the ice that is being lubricated on it’s trip to the sea by all that water that is flowing down the moulin holes and the warm sea water that it melting the ice front from underneath. These are the effects that can’t easily be seen and add up. Remember, in environmental issues, especially Climate Science, it’s what you can’t see that’s gonna getcha!
Hi Guys
A couple of decades ago, I worked as a Geo on a mineral showing inland from Juneau Alaska. The property was south of the Taku River, on the British Columbia side of the border. At that point, the river drains West. The glacier runs South, feeding the river.
However.
It was not too difficult from our camp to get some ice from another glacier that was just below us. We determined that the ice was at least 500 years old. That when added to 7-year old Scotch “aged” it to at least 20-year-old whiskey.
Be that as it may.
I had heard stories about a self-dumping glacial lake upstream on the Taku.
Looked it up now. One just has to read about the Taku Glacier!
Bob
Has the ice regrowth exceeded the size of the chunk that broke off yet?
This is NOAA NCEP 1981-2010. Perhaps, the baseline for the averages in the Weatherspark link for Erenhot is not 1981-2010? I did not fact check the temps anomaly though but I think NOAA satellite will not lie?