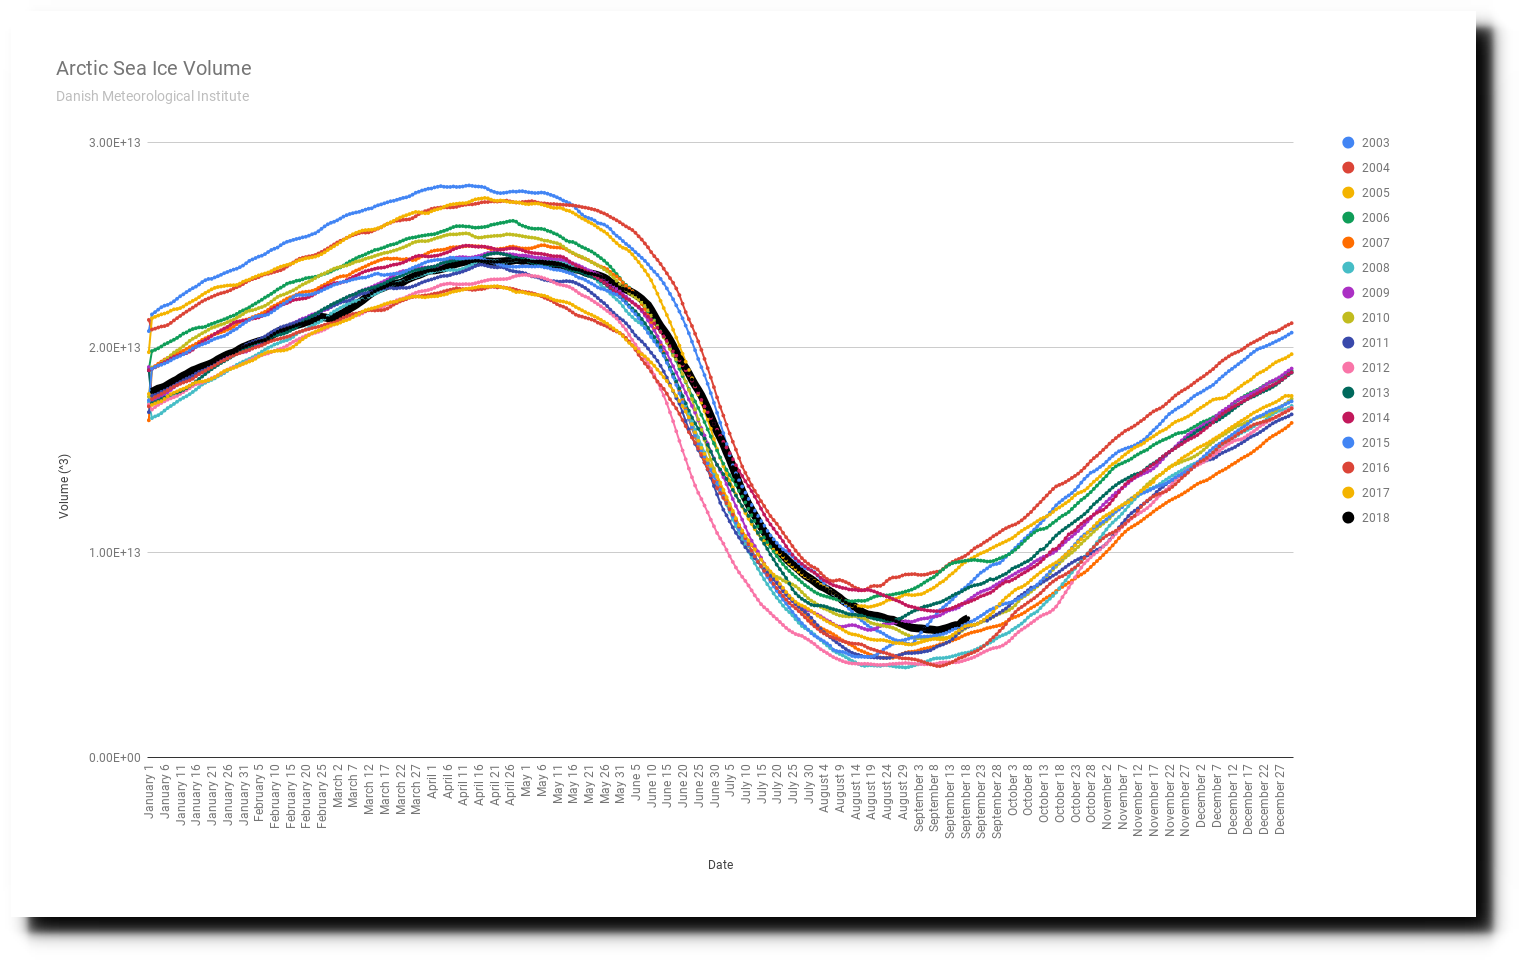
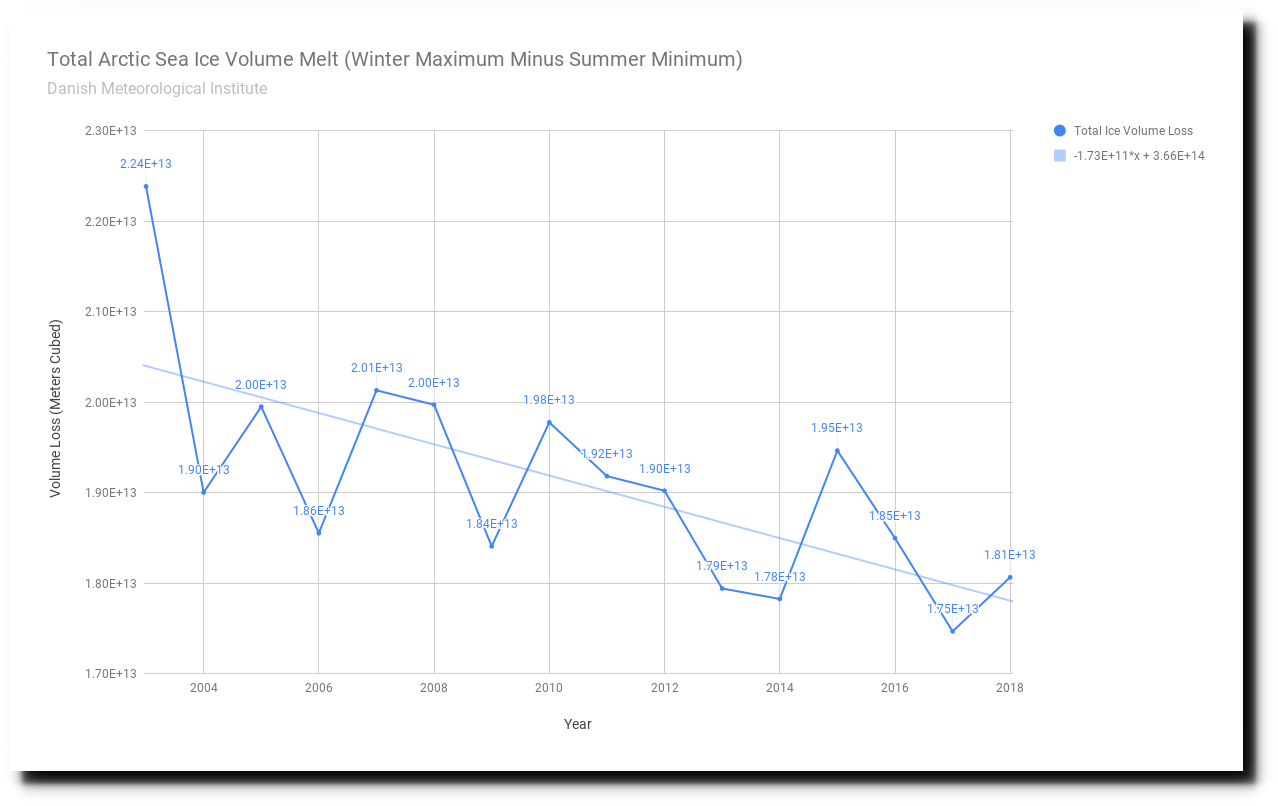
Arctic sea ice volume bottomed out on September 9, and the total melt was fourth lowest on record this year.
Ten years ago, the world’s leading climate prophet predicted the Arctic would be ice-free no later than 2018.
The Argus-Press – Google News Archive Search
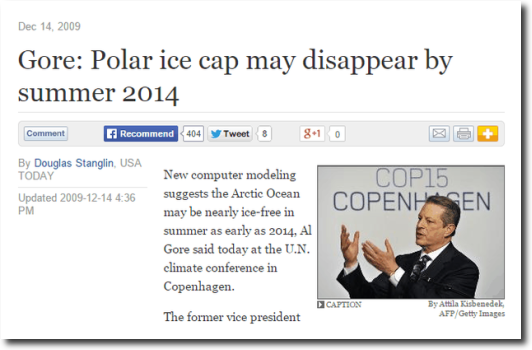
Gore: Polar ice cap may disappear by summer 2014
The Arctic sea ice volume minimum is up 41% since James Hansen’s prophesy was made ten years ago.
None of this will be reported by the mainstream media, whose policies probit factual reporting on any topic.
Verified here:
Icebreaker Battles Toughest Arctic Ice Conditions For 15 Years
A Swedish icebreaker on the way to the North Pole has encountered heavy ice conditions and had to stop just before the North Pole.The Swedish icebreaker Oden embarked to the North Pole from Svalbard last week. According to the captain, who described the ice conditions – they are the most difficult witnessed in the past fifteen years.
https://principia-scientific.org/icebreaker-battles-toughest-arctic-ice-conditions-for-15-years/
I do wonder how an increase in the number of icebreaker voyages in the Arctic has actually contributed to summer break-ups of the ice.
You always know you’re going to get some truly earth shattering knowledge when someone posts as “Anon”
In case you didn’t know, sea ice floats. It can move. And it appears in this instance to have gravitated towards the place the ice breaker wanted to go. As the article clearly explains:
“The pack ice the ship encountered north of 80° was very dense, piled together through a months-long northward ice drift in the Central Arctic Ocean, meereisportal.de reports. Overall, however, the Arctic’s summer sea ice extent is again very small; the Oden hit the ice edge only at 82°N”
Think of it like a supermarket where a large number of shopping carts found themselves in one aisle. Your progress would be severely impeded. Perhaps impossible. What was the reason for the confluence of the carts? Who knows? A special offer? A run on bottled water or toilet paper perhaps. Free samples.
But do you know what was strange about this? The total number of shopping carts in use at the time was about 10% down from the average.
Does that help Anon?
So do you believe Hansen was correct “echoing the work of other scientists” – that the Arctic is ice-free in 2018? Or are you just desperate to change the subject?
What average Barry? The tiny cherry picked average that alarmists use? Or the realistic average that skeptics use?
Anon is looking pretty smart right now.
What average are you referring to? I was responding to Anon comment which was limited to:
“Verified here”
followed by a SELECTIVE paragraph from an article about “Icebreaker Battles Toughest Arctic Ice Conditions For 15 Years” with a corresponding link.
No reference to averages anywhere. But interestingly he chose to only include the section of the article which may have supported the main articles claim. hence the “Verified here” claim.
But surely anyone that clicked the link and is able to read could have seen the explanation. Sea ice drift.
So where, pray tell, have I misunderstood Anon’s post? I have no issue with someone correcting me but sadly your post falls way short. I’m not making any comment as to how smart Anon is but I am none the wiser as to how the article he referenced describes anything other than sea ice drift.
If i have misunderstood the REFERENCED article, please educate me.
Your 10% reference at the end of your comment…
… at the time was about 10% down from the average.
And please, keep the word count to a minimum unless you really have something relevant and useful to add to the discussion.
It looks like I can’t reply to your September 22, 2018 at 6:31 pm post so I’ll reply here.
If my post is too long, don’t read it. Storage space is cheap. Comments even cheaper.
I don’t know if you are being obtuse of simply don’t understand. Maybe that’s my fault but I tried to explain it as best I could.
The 10% you referenced are not my words. They were from the original article referenced in Anon’s original comment. I included the complete quote rather than being conveniently selective.
So Anon’s article was about shopping carts? LOL
Who is obtuse, Barry?
Just runnaway, there is no salvaging your ignorant statement.
Sorry Barry, but there are lot more shopping trollies in use now than there was for the first 9500 or so years of the current interglacial.
Try not to remain ignorant of this fact.
And you have data to support this claim?
And you?
Find a blog where people are dumber than you to pass your nonsense Barry, and good luck finding one! LOL
The reason they stopped where they did was because they needed to find a suitable floe to carry out the two month long experiments. They reconnoitered using a helicopter to find the right one (size, thickness, ability to anchor the ship to the floe etc.). One of the problems during the journey was lots of fog which meant they couldn’t check out the route with the helicopter so they reduced speed. When the fog cleared they found a suitable floe and anchored to it.
https://polarforskningsportalen.se/imagecache/a943d660281d5bfb923565a85ff670d7/1024/567.jpg?source=https%3A%2F%2Fportalen.polar.se%2Fwp-content%2Fuploads%2F2018%2F08%2Farctic-ocean-2018-ice-floe-asa-lindgren.jpg
Fog? Fog? You mean like water vapor that has significant albedo over open water? Say it ain’t so!
Fog as in warm, moist air over ice, it wasn’t foggy over the open water.
When they got closer to the Pole the fog went away.
A photo from the edge of the floe at 89ºN+
https://portalen.polar.se/wp-content/uploads/2018/08/arctic-ocean-2018-valross-open-lead-01-karin-alfredsson-1.jpg
So in this case the fog was protecting the ice from what little insolation it would be exposed to this time of year. The equinox was the 23rd and the Arctic will be in twilight then. So it wasn’t just fog. In fact it seems to me that it would be a less than ideal time to be up there looking for a stable flow considering September is a stormy month for the oceans of the NH and how little light there is.
That’s why they finished their work and left last week.
Tony is taunting the Grifftard once again …. Griffy will be along any minute to straighten Tony out about just how doomed the planet is due to all the ice melting.
Seriously I wonder if Griffy had a mental breakdown due to all his arctic projections crashing and burning so spectacularly? Griffy has been totally absent and he promised to return mid September if I remember correctly. The coward is scared to show his face and admit how wrong he was.
The guy returned in August after saying he would leave in July :).
Ms Griff reads a calendar about as well as she reads graphs.
Good one G
Maybe Griffy uses one of those new fangled metric calendars ;-)
Griffy freezing in the dark this winter would warm my soul.
The problem is the left can’t remember that far back. And if you show them the evidence they won’t believe you. How do you argue with a post?
Termites.
Did someone hacked their brains?
Ha! Termites… It took me a moment to get that. By the way, if termites eat wood, what do they use for toothpicks?
Griff is still claiming that JAXA is showing a decline.
Griff will be back. She still owes me answers.
When will the Arctic be ice free?
How much M@nn-Made CO2 will it take to melt all the Arctic ice?
We are at over 400 ppm; and we just finished 2018 with millions of sq km of Arctic ice – at the minimum.
The Arctic is suppose to be ice-free. What gives?
Looking at the sea ice thickness chart, it looks like the 2018 line is still slightly going down while the other years start to turn back up at this point.
That is an Arctic sea ice volume graph, not a thickness chart.
Total Arctic sea ice volume vs the 40-year mean can be seen here: http://psc.apl.uw.edu/wordpress/wp-content/uploads/schweiger/ice_volume/BPIOMASIceVolumeAnomalyCurrentV2.1_CY.png
Alright all you ice mavens; time to own up!
2018 Arctic ice melt season is over CO2 is at 400 ppm and there’s plenty of Arctic ice. Griff owes me an explanation. She said she’d be back in September. It’s September 21st.
Andy owes me the start-date of his Arctic Trend which is Down; except he conveyed these special insights, addressed directly to me, all in CAPS. Trend. Down. Yah. Andy, you owe me the start-date of your trend.
Here’s the total Arctic sea ice volume vs the 40-year mean.
http://psc.apl.uw.edu/wordpress/wp-content/uploads/schweiger/ice_volume/BPIOMASIceVolumeAnomalyCurrentV2.1_CY.png
No, Piomas is an agenda driven model.
And you do know that 1979 was a time of exceptionally HIGH Arctic sea ice, don’t you?
Current levels are still in the top 10% of the last 10,000 years.
Indeed, both PIOMAS and DMI volume are the results of models, DMI uses the HYCOM-CICE model. One of the problems that some people have with the DMI if that it sometimes shows ice where there is none. As they say in their website:
“Differences may occur in terms of the position of the edge of the ice in the two maps, “Extent of the sea ice” and “Thickness and volume of the sea ice”, as the model calculations do not always correspond exactly to the satellite sensors’ registration of the extent of the ice.”
PIOMAS is agenda driven,
what don’t you understand, phlop?
Funny that DMI maps pretty much tend to match Russian maps.
You do agree, however, that there is FAR more sea ice now than there has been for most of the Holocene, don’t you
Come on Phlop, you are allowed to state the facts here.
No, Piomas is an agenda driven model.
No, that’s an agenda driven statement with nothing to back it up.
Funny that DMI maps pretty much tend to match Russian maps.
Not a recommendation, the Russian chart is showing 7/10-10/10 east of Novaya Sibir where Worldview clearly shows 0-15%. As far as resolution is concerned U-Bremen shows a clearly better match with the images.
Poor phlop .. in DENIAL yet again.
Russians know FAR more about what is going on in the Arctic.
Maybe they do, but it’s not shown on that chart. At 74ºN and 164ºE they show 7/10-10/10 whereas Worldview shows disperse broken ice.
” disperse broken ice”
but still around 70% sea ice, thanks.
NSIDC increasing
MASIE increasing
DMI volume increasing
around 4.5 Wadhams at minimum
Don’t be yet another Arctic sea ice bedwetter, phlop
but still around 70% sea ice, thanks.
Not a chance, below 50%.
Here’s the worst ice that the Bremen encountered a few weeks ago in that region, they were in clear water half an hour either side.
https://static.hl-cruises.com/fileadmin/_processed_/9/0/csm_f_2018_08_280130_ded0f6ae7a.jpg
70.49° N 173.71° E
NSIDC increasing
MASIE increasing
DMI volume increasing
around 4.5 Wadhams at minimum
Don’t be yet another Arctic sea ice bedwetter, phlop
MP, you left out the FIRST 7 years of satellite data.
Don’t care about piomas. If there’s a trend, give me the start year of your trend.
MS look here for the correct graph and as gator sez the graph is volume the map is ice thickness. For some reason Tony’s graph is a few days old.
http://ocean.dmi.dk/arctic/icethickness/thk.uk.php
Rats! .. I thought for sure this was going to be the year! .. all the
Global WarmingClimate Change prophets have told me so!Well, maybe next year .. I’m sure it is another “tipping point®”
I’m just upset that the Arctic isn’t completely ice free .. I have been told for 30 years that the Arctic is melting and I have been promised for at least 15 of those years that all of the ice would be gone. I am beginning to get a little bit pissed off about this. I have been patiently waiting for an ice free Arctic and yet it is still no closer than it was 30 years ago. What gives?
Hurry up!! .. Get this thing done with already!! .. what’s the hold up?
IT DID NOT!!
The Jaxa measurement of ice extent is still going down
this will be the latest minimum till 2004 at least.
https://forum.arctic-sea-ice.net/index.php/topic,2223.msg173768.html#msg173768
Me Griff is stamping her little genocidal feet, and you have triggered her again Tony!
Nice job.
Well, there’s always hope! ;-D
About 4.5 Wadhams at base level, griff
Close to 20 time the area of the UK
MASIE, NSIDC, DMI volume, all have bottomed out are all starting to head upwards
You and ALL your pissy little Arctic sea-ice bed-wetters are a JOKE.
And you STILL are a manic CLIMATE CHANGE DENIER, deliberately remaining IGNORANT of the fact that the current level is FAR ABOVE most of the last 10,000 years.
Chuck a tantrum you poor pathetic, ignorant, bed-wetter.
And you have NOT addressed the FACT that ice VOLUME has bottomed out
Is it that you are TOTALLY INCAPABLE of understanding basic English?
You certainly have ZERO comprehension of fact, living in a brain-washed fantasy world, unrelated to any reality.
You are destined to remain DELIBERATELY IGNORANT.
Your inbuilt idiocy give you no other choice.
Yep, like all alarmists, at any time the only metric that counts is the one that they believe supports or at does the least damage to their claims.
Griff,
Where are my numbers?
How much CO2 will it take to melt all the Arctic ice, and when will that happen?
That is why you don’t cherry-pick. One researcher’s opinion is just that. Studies from the time revealed a range of dates when the Arctic summer ice could be gone, ranging from 2013 to 2050. Today, that end-date could be as late as 2060 unless unaccounted for factors play a part, just as they did in the Winter of ’07, which created the panic in the first place.
Study: Arctic ice could be gone by 2020
Wednesday, May 2, 2007
‘Researchers belonging to the National Snow and Ice Data Center (NSIDC) say that the Arctic ice caps are melting at a rate much faster than that predicted by computer models previously reported by the Intergovernmental Panel on Climate Change (IPCC), and that the ice could be gone sometime near year 2020.
“This suggests that current model projections may in fact provide a conservative estimate of future Arctic change, and that the summer Arctic sea ice may disappear considerably earlier than IPCC projections,” said head researcher of the study group at the United States-based National Center for Atmospheric Research (NCAR) and the University of Colorado’s NSIDC, Julienne Stroeve.
Stroeve says that the IPCC’s 18 computer models used in the study were out of date and that the melting of the ice has actually progressed 30 years quicker than the computers predicted. The researchers also say that the computers did not take into account the increased threat of global warming. The IPCC ultimately predicted that the ice would be gone by 2050.
Despite the predictions, since 1979, the ice has actually melted at a rate of 9% per decade.
The prediction by the IPCC was done in the Arctic Sea during September and predicted that between 1953 and 2003, the ice would have melted 2.5% per decade, but it actually melted at a rate of 7.8% per decade. Their worst case scenario between those years, which was predicted using only one computer, had shown that the ice was going to melt at a rate of 5.4% per decade.’