
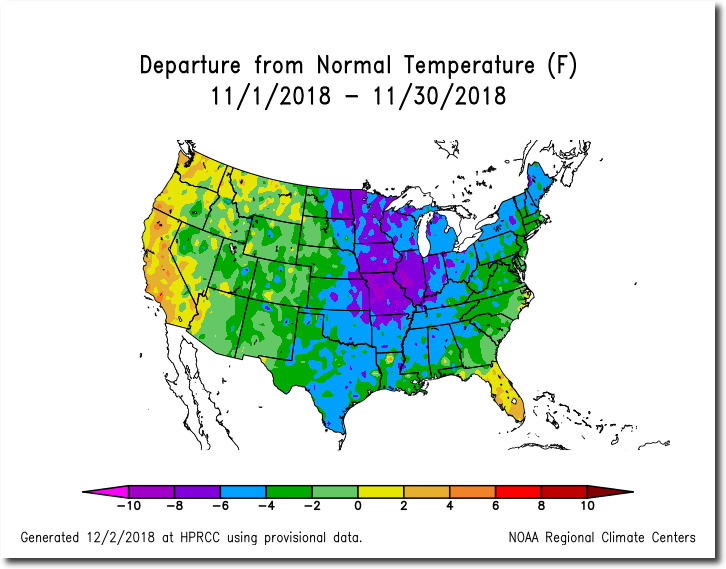
https://hprcc.unl.edu/products/maps/acis/Last1mTDeptUS.png
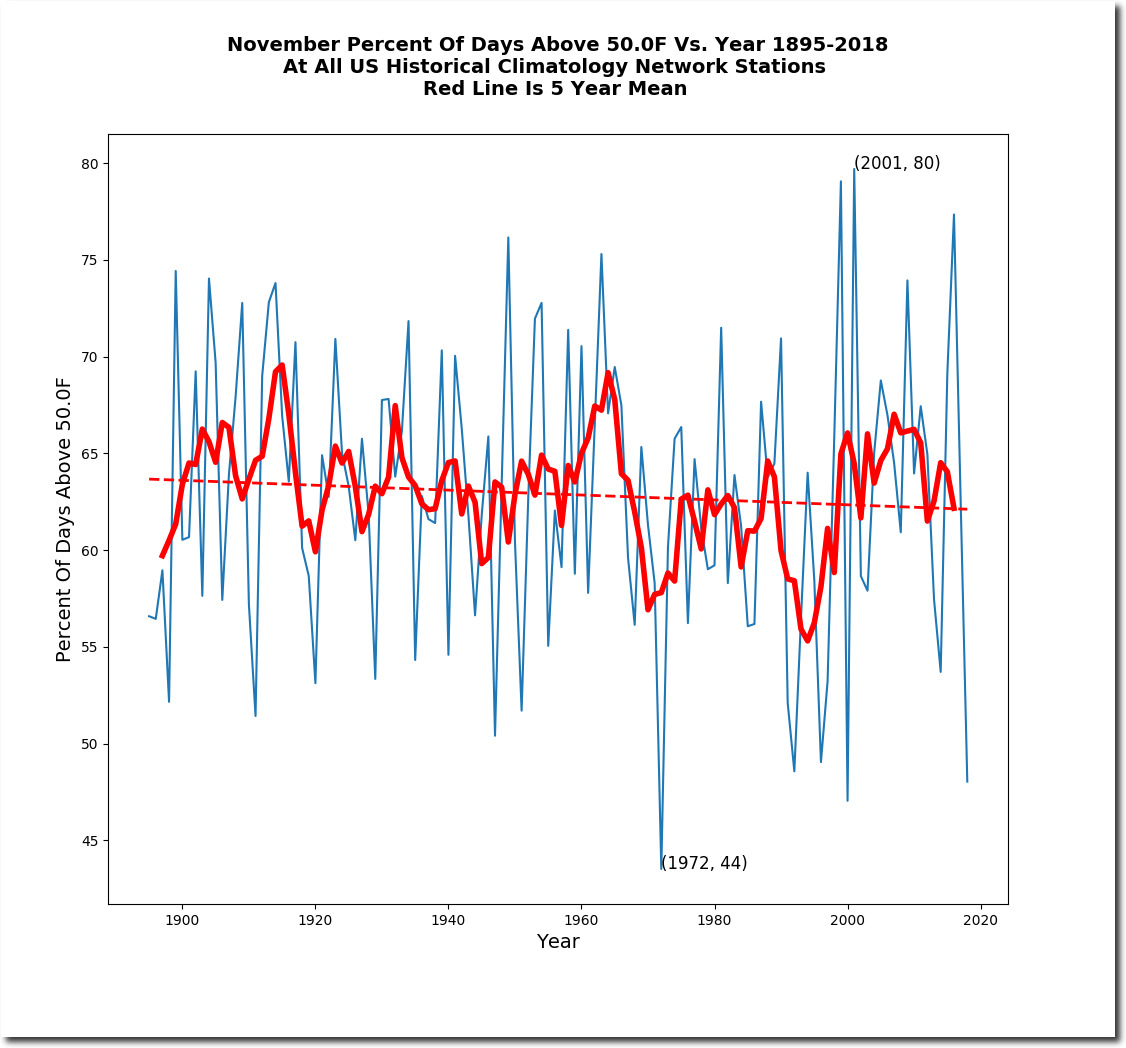
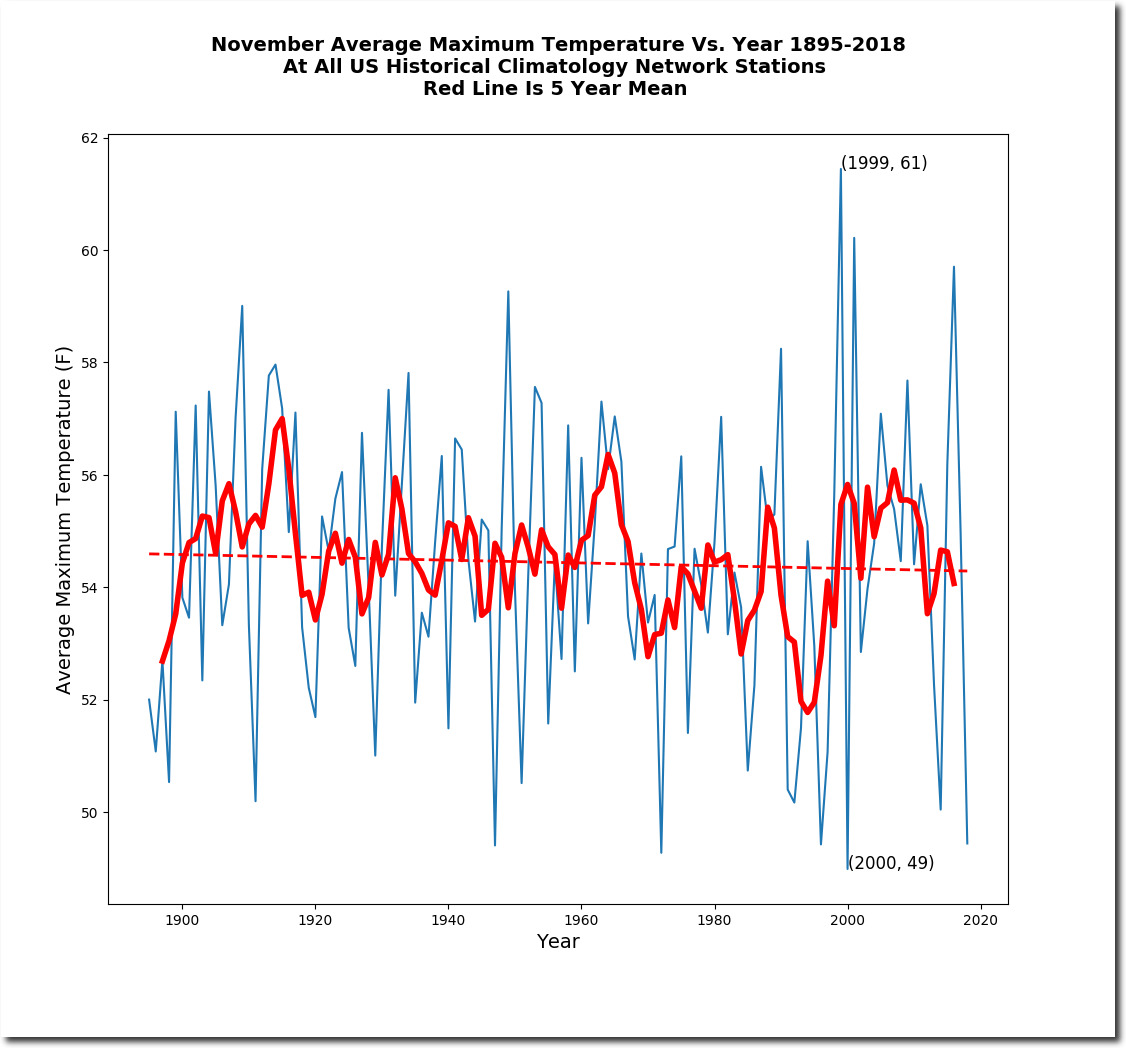
November US afternoon temperatures were fourth coldest on record, and the percentage of days over 50 degrees was third lowest on record. November afternoon temperatures have been declining in the US since the 19th century.
