November snow extent was third highest on record, and has been above normal for ten consecutive years. There has been a huge increase in November snow extent over the past 40 years.
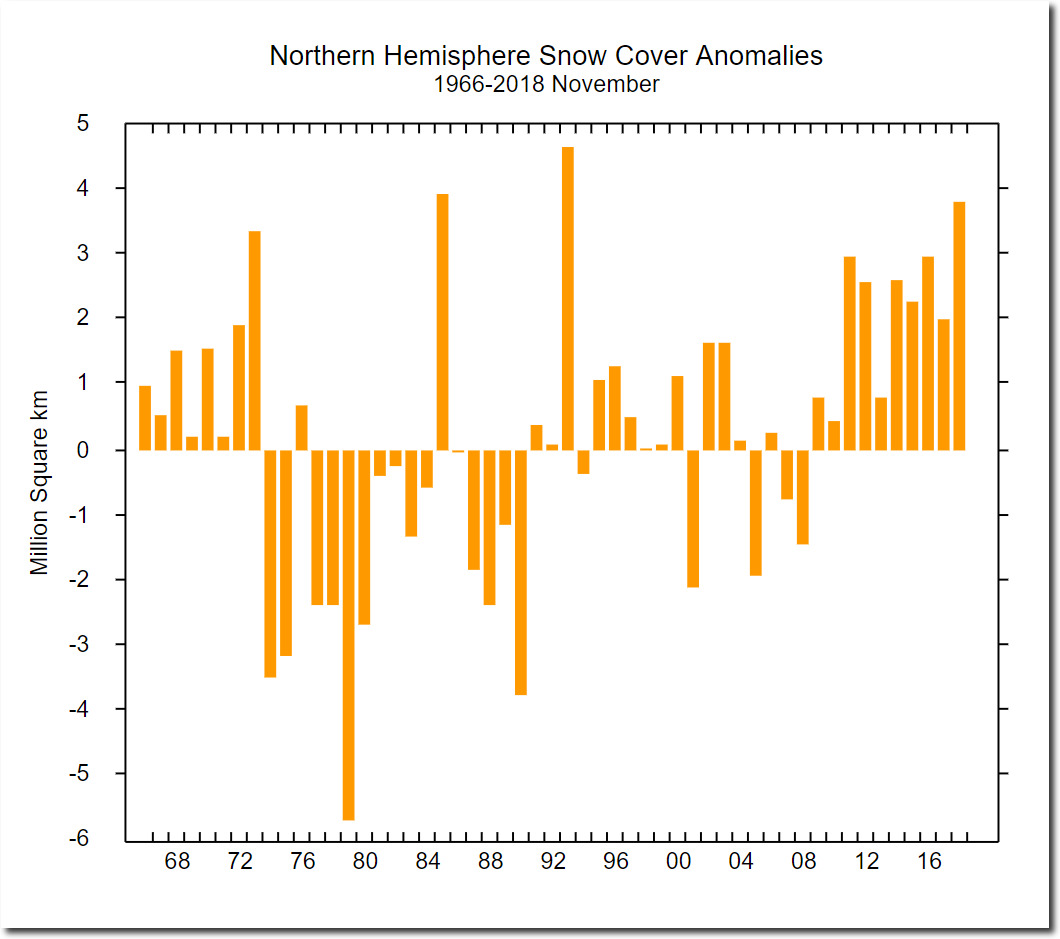
Rutgers University Climate Lab :: Global Snow Lab
The cause of this increase is cold Arctic air pushing further towards the equator than it used to. Southerly places where it used to rain, precipitation is now falling as snow.
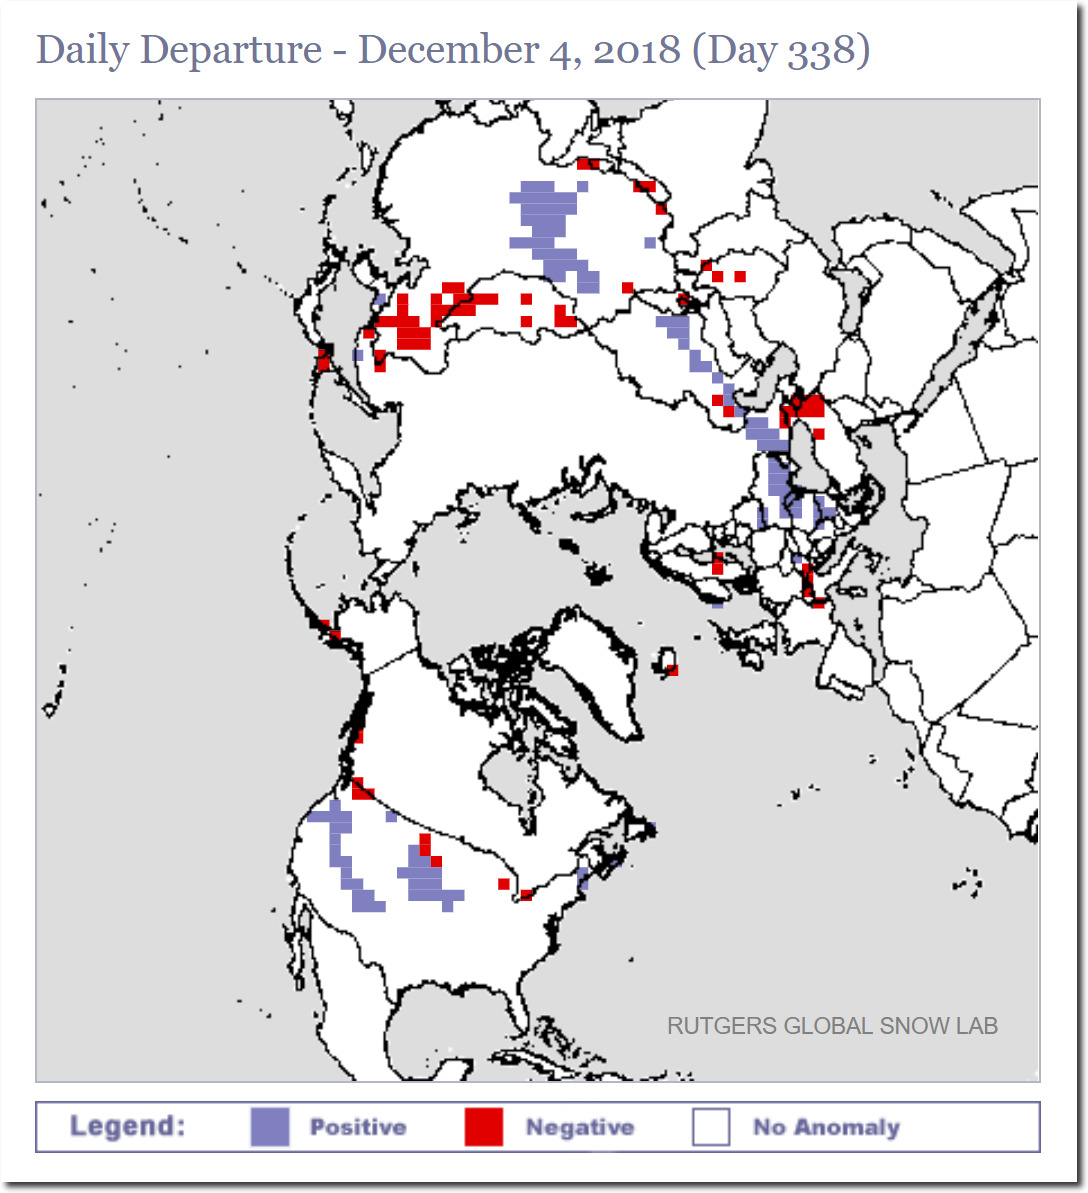
Rutgers University Climate Lab :: Global Snow Lab
Five of the eight highest autumn snow extents have been in the last five years.

Rutgers University Climate Lab :: Global Snow Lab
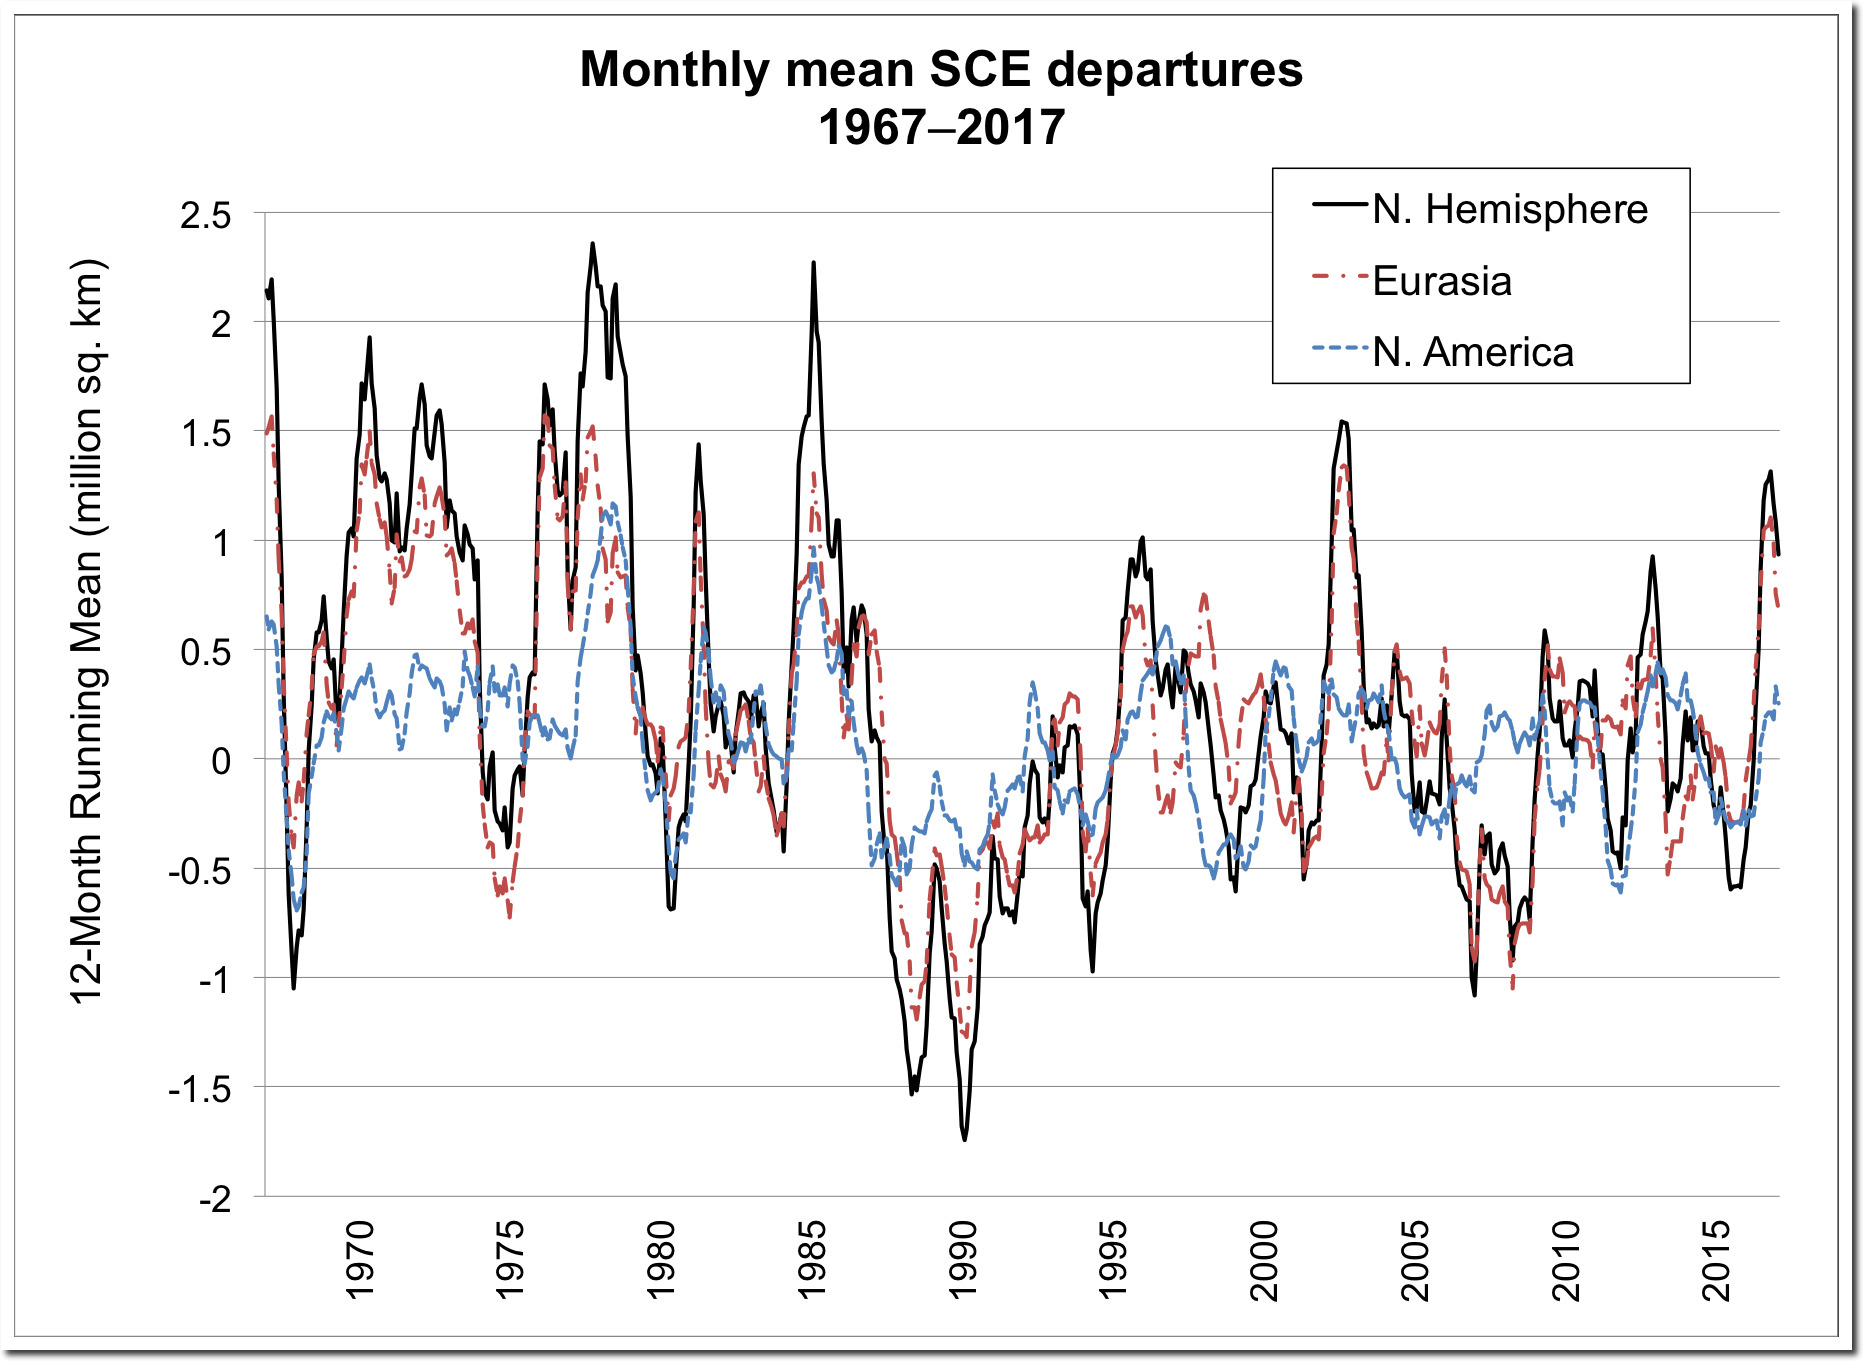
Winter snow extent is also increasing.
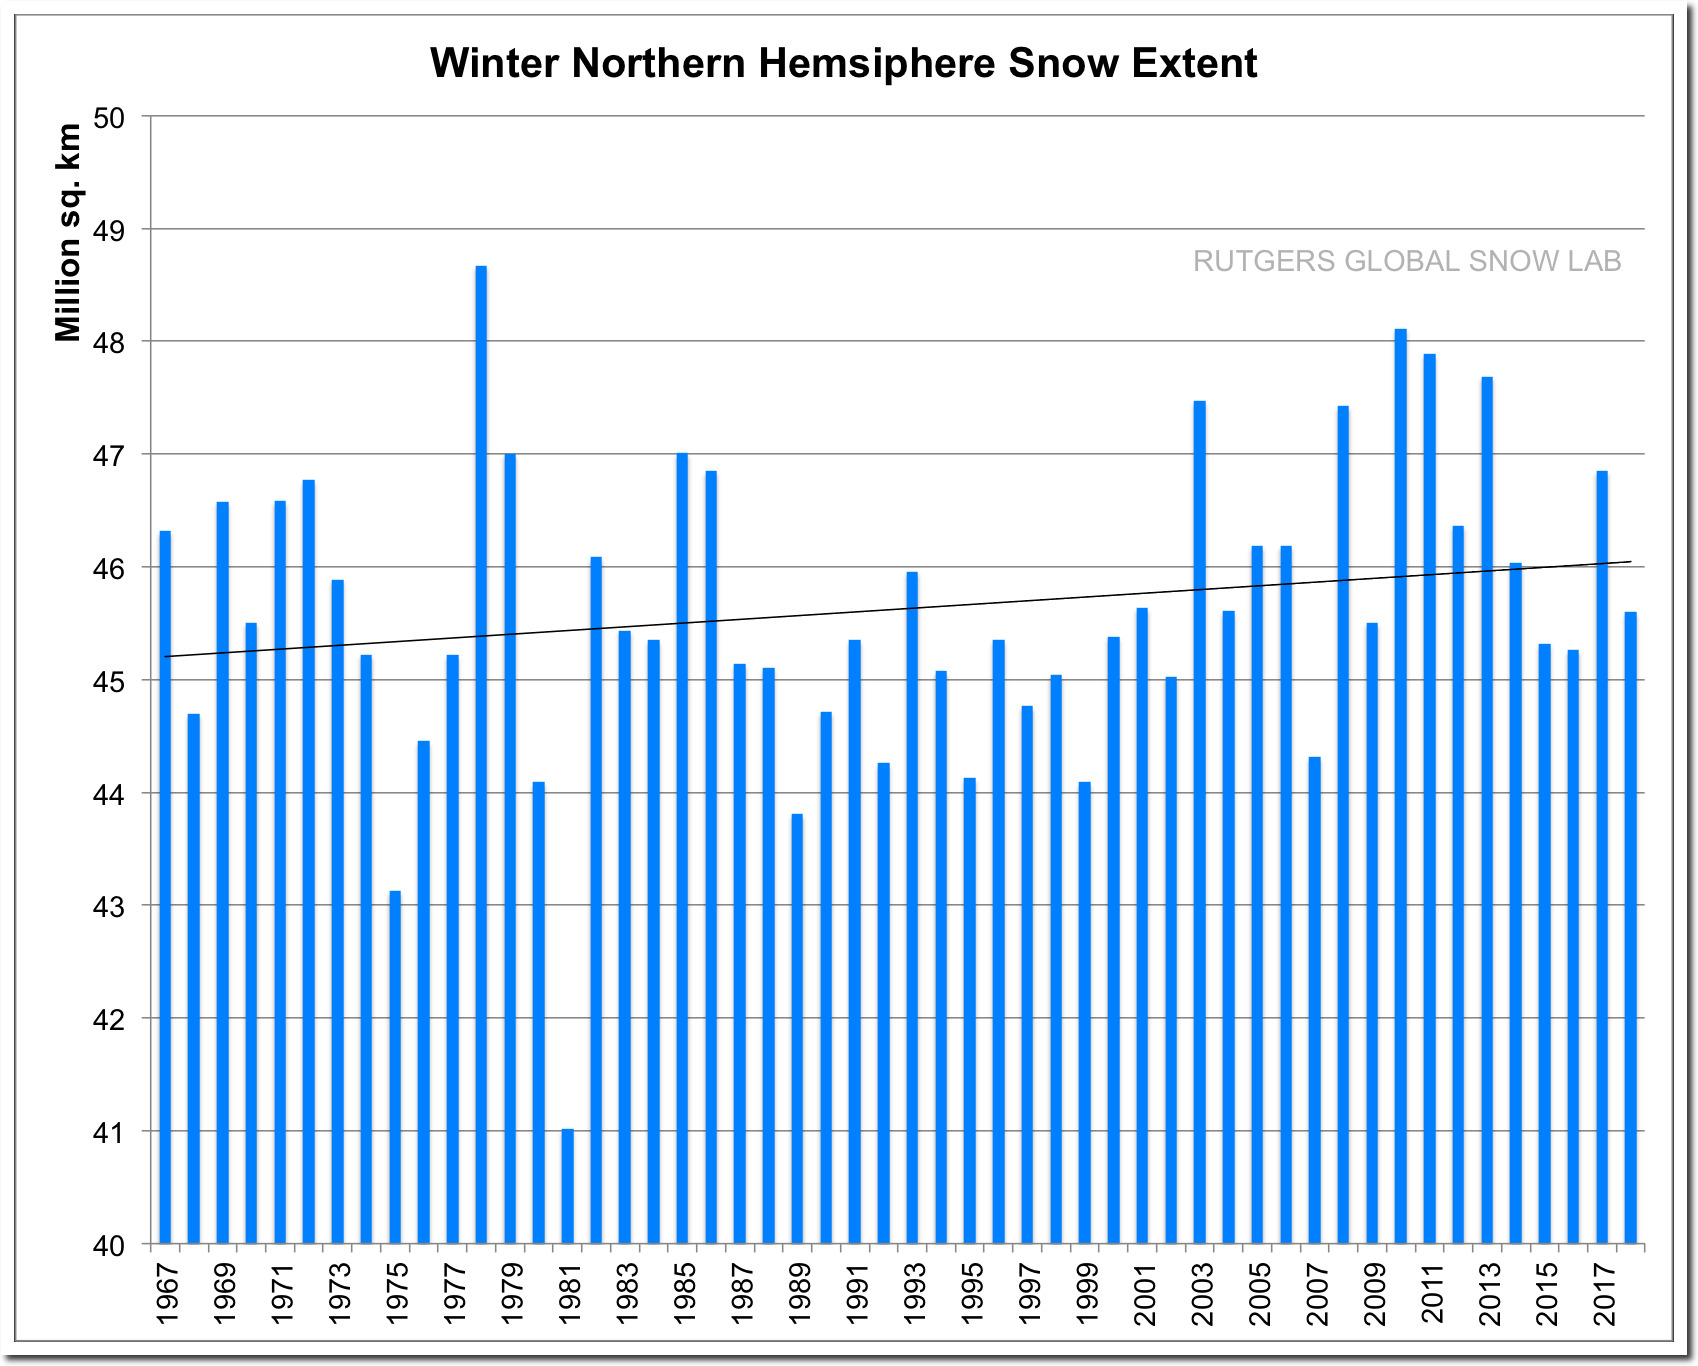
Rutgers University Climate Lab :: Global Snow Lab
Snow extent has increased sharply since CO2 reached 350 PPM in 1988, and has been above normal for several years.
Rutgers University Climate Lab :: Global Snow Lab
Arctic air is expanding towards the equator. This would not be happening if the planet was warming, so climate scientists respond by doing what they always do – they simply lie about it.
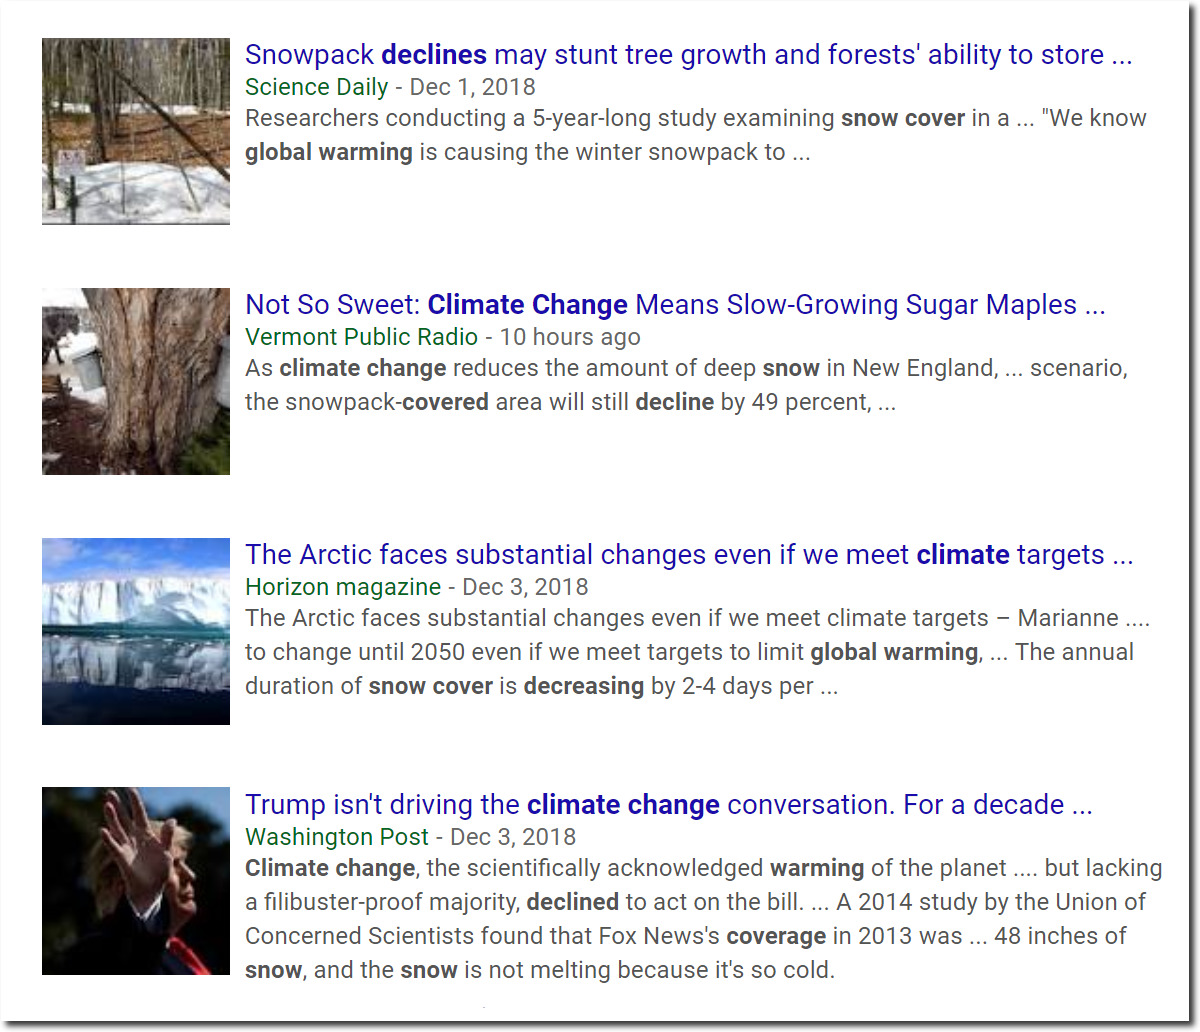
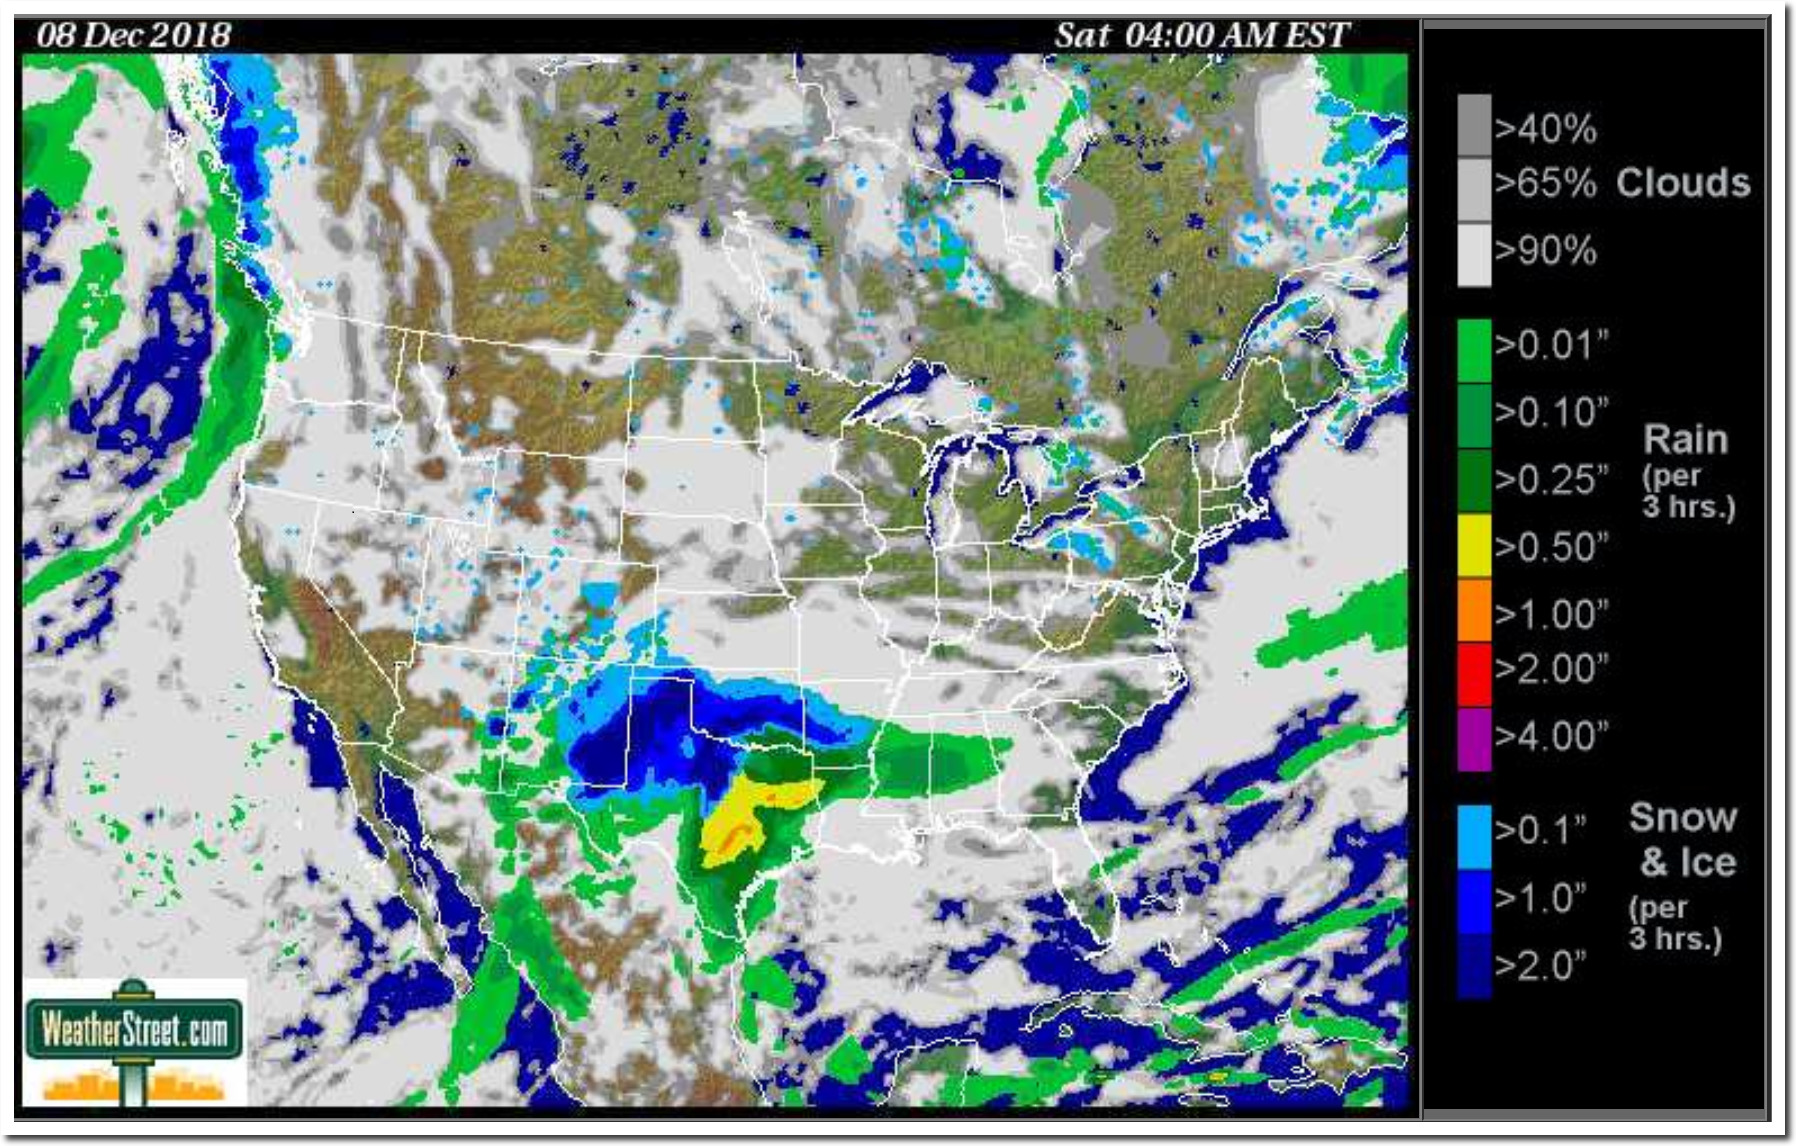
And speaking of liars, there is lots more snow headed to Katharine Hayhoe’s home in Lubbock.