Arctic Sea Ice Continues To Grow

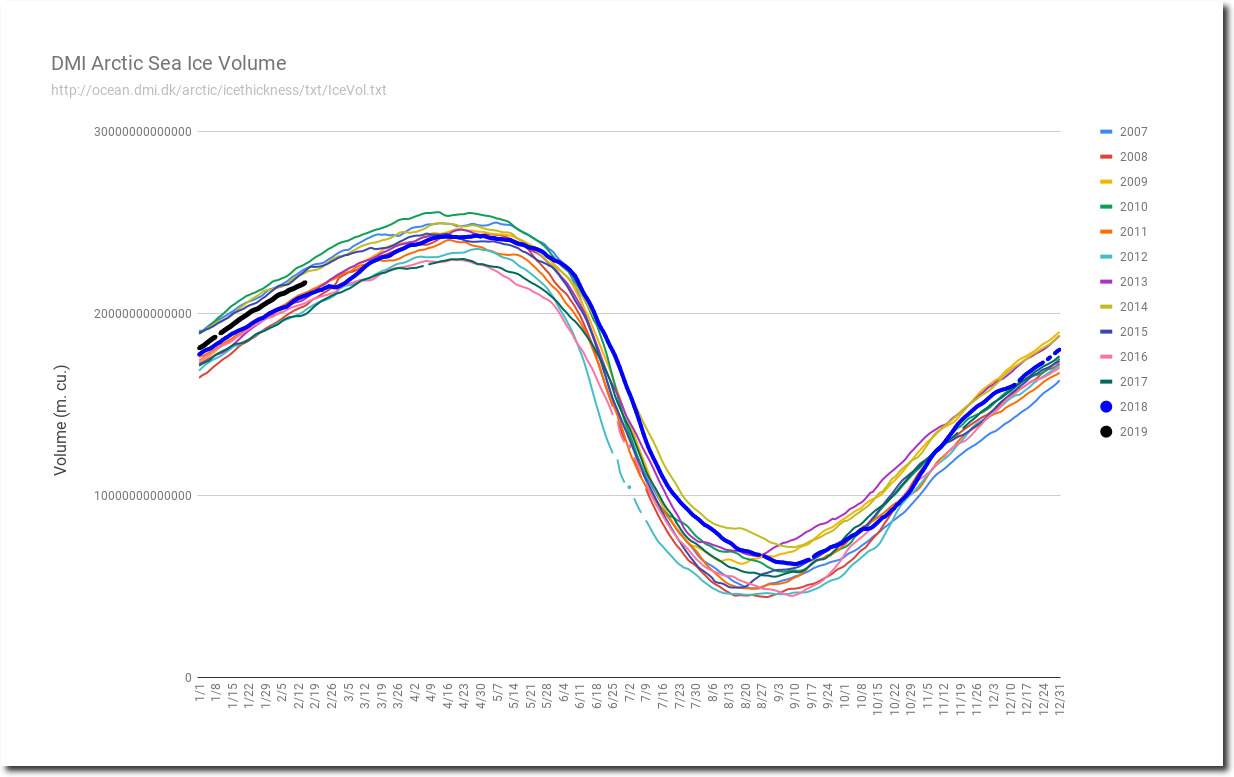
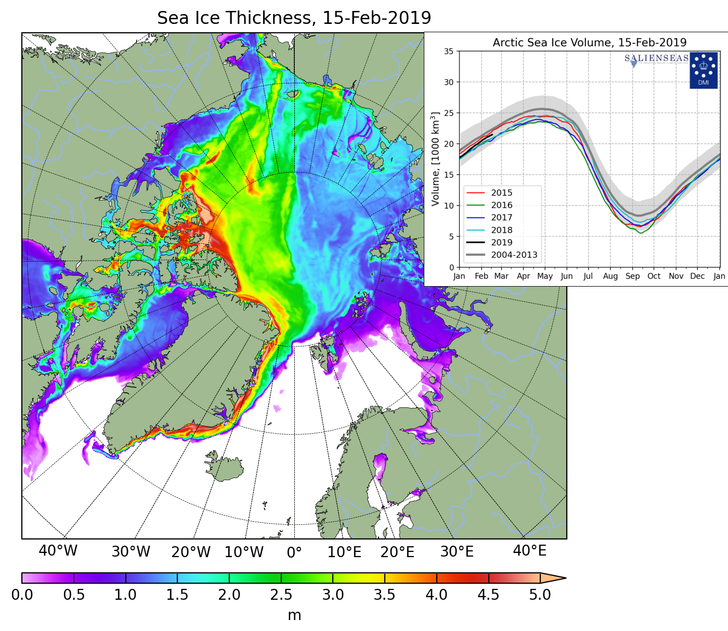
Last year had the highest June Arctic sea ice volume since 2006, and this year is well ahead of last year.

Spreadsheet     Data

Most of the Arctic is covered with ice more than two meters thick.

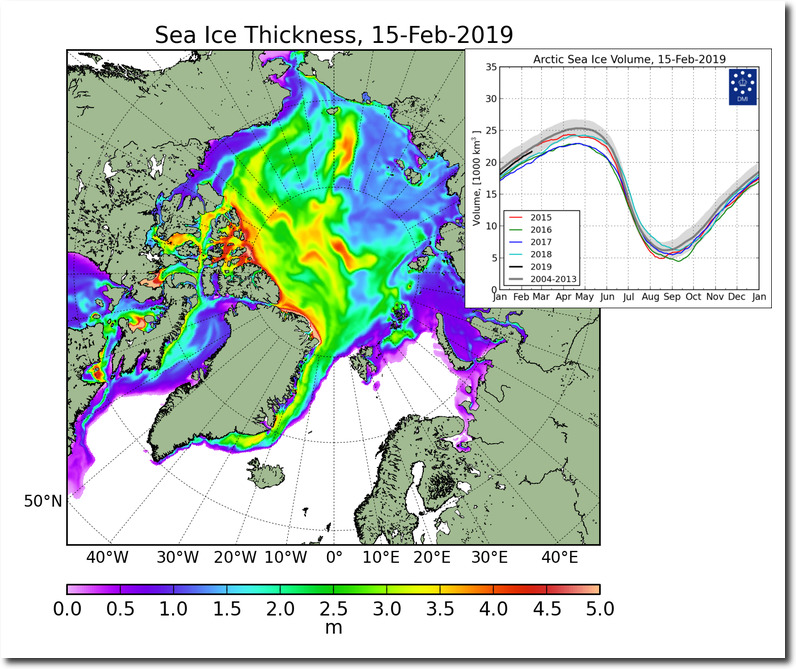
CICE_combine_thick_SM_EN_20190215.png (758×631)

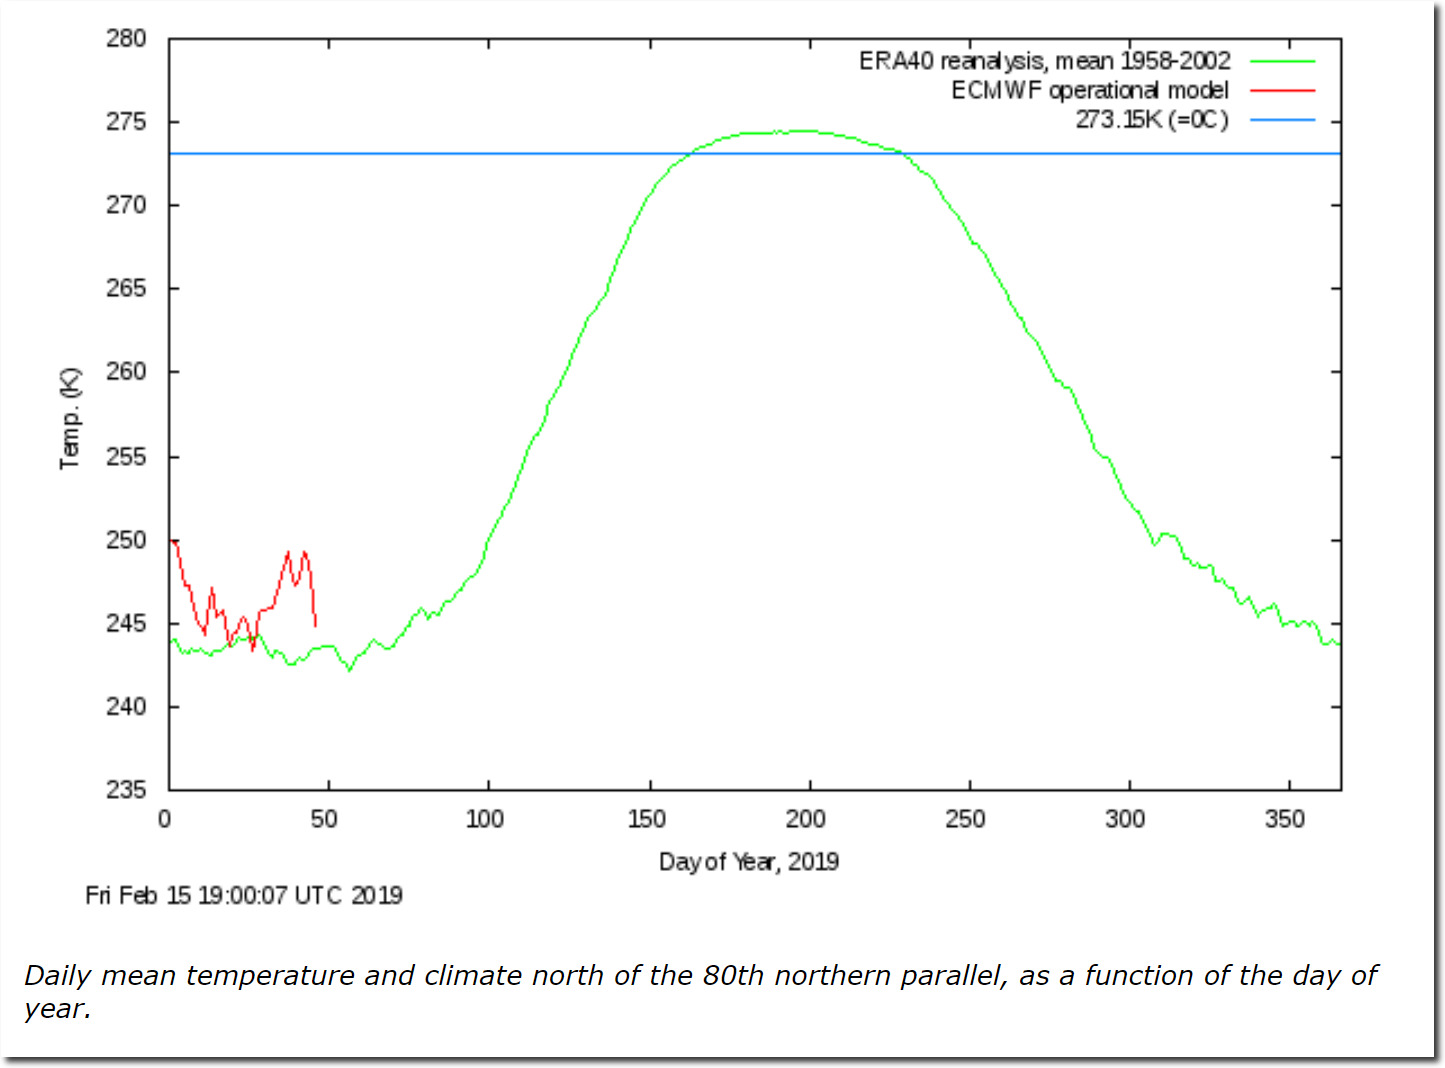
Arctic winter temperatures are running close to the 1958-2002 mean.

Ocean and Ice Services | Danmarks Meteorologiske Institut

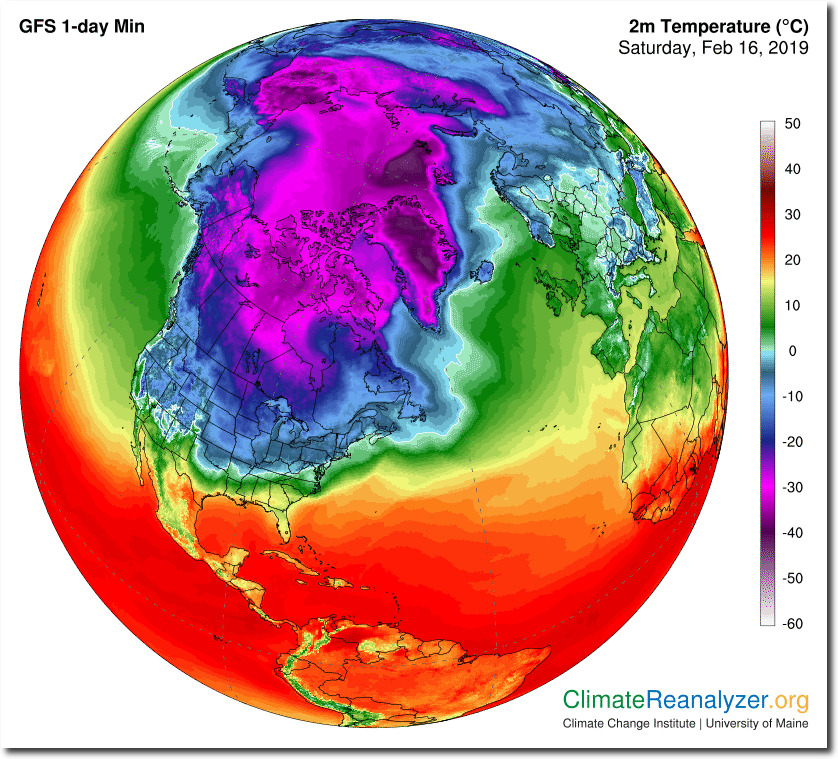
Temperatures are running around -30C from North Dakota to Siberia.

Climate Reanalyzer

Meanwhile, “scientists say” the increase in ice is a “horror story of melting.”

This entry was posted in Uncategorized. Bookmark the permalink.

29 Responses to Arctic Sea Ice Continues To Grow

  1. John F. Hultquist says:

    ” . . . the Arctic may be ice-free by 2040. ”

    I wake to find the goal posts have been moved!

  2. angech says:

    Nearly 14 mill on JAXA so non new minimum this year. 24 days hopefully for more freezing.

  3. Macha says:

    Why the heck is zero to ten green on the y axis….surely en to twenty. Oh…its so the bad, hot red, is more widespread. Gotcha.

    • st says:

      There are only so many colors in the spectrum. The scales change with the seasons. Green means different things at different points in the year.

  4. Steven Fraser says:

    Yeah! 630 cu km higher than last year at this time.

  5. Steven Fraser says:

    The rest of the details:

    DMI Sea Ice Volume report for Feb 15: Volume rose 98 cu km since yesterday, to 21,716 cu km, which is 98.92% of the day’s average value in the 17-year series, and 98.64% in the DMI-charted 10-year reference period 2004-2013.

    The day’s average growth in the 17-year series was 71 cu km, and for the reference period 74 cu km. Comparatively, the day’s growth this year was 137.56% and 132.77% of those values, respectively. 2019 is now 237 cu km below the 17-year average.

    The latent heat released in the formation of the new ice is 2.98772E+19 Joules, or 2.9877E+07 TeraJoules.

  6. Eric Fleck says:

    Having trouble finding an appropriate place to post this question…
    From what I’ve watched/read there appears to be an acceptance that some amount of global warming is occurring but that it has been going on for longer than can be explained by human produced CO2 emissions alone.
    my question is: has there been any investigation into the possibility of [terrestrial] internal variance of heat generation. i.e. could variations in the concentration of fissile materials in the outer explain the long term variation of heating and cooling events?
    Conceptually, to me, it seems logical that fissile material should be the primary contributor to the continued existence of a molten outer core… and perhaps the flow of material in the outer core could result in cyclical concentration and diffusion of fissile material resulting in cycles of heating and cooling over the long term. As fissile material degrades over time this would be consistent with an early hot earth eventually cycling through warm and cold periods … progressing through longer cold periods with brief inter-glacial warmings.
    I’m not a geologist but it seems to me that an analysis of deep earth temperatures and deep sea temperatures could provide insight into this possibility.
    Is there any research in this direction?

  7. LOL@Klimate Katastrophe Kooks says:

    Remember last year, when the NOAA told the US Navy that there was only 16″ of solid ice in the region where the US Navy was conducting Arctic operations, so the US Navy tried to surface two 688-class fast-attack submarines… and damaged them because the ice was thicker than the 72″ the submarines are designed to surface through?

    {Actually, I served aboard a 688-class submarine, and I’ve seen them punch through 8 feet of ice… so the ice had to be even thicker than that.}

    So the lies of the climate alarmists were brought to light by the NOAA being responsible for damaging two very expensive submarines, impeding US Navy operational readiness, and putting the lives of the men on those submarines at risk.

    That story was hushed up pretty quickly, eh?

    Why was no one at NOAA held responsible for the lies they promulgate, even when it impedes US Navy operational readiness, damages expensive submarines and puts hundreds of lives at risk?

  8. John F. Hultquist says:

    “The units participating in the exercise are supported by a temporary ice camp on a moving ice floe approximately 150 miles off the coast of the northern slope of Alaska in international waters. The ice camp, administered by the Arctic Submarine Laboratory (ASL), is a remote Arctic drifting ice station, built on multi-year sea-ice especially for ICEX that is logistically supported with contract aircraft from Deadhorse, Alaska. The ice camp will be de-established once the exercise is over.”
    https://www.dvidshub.net/news/269100/submarines-uss-hartford-uss-connecticut-surface-together-arctic-circle

  9. Psalmon says:

    Colorado River Snowpack closing in on April target…about 2.5 inches of SWE to go mid February. Continued cold and train of storms in the forecast. 123% of normal because, Climate Change.

  10. Steven Fraser says:

    DMI Sea Ice Volume report for Feb 16: Volume rose 99 cu km since yesterday, to 21,815 cu km, which is 99.04% of the day’s average value in the 17-year series, and 98.77% in the DMI-charted 10-year reference period 2004-2013.

    The day’s average growth in the 17-year series was 73 cu km, and for the reference period 69 cu km. Comparatively, the day’s growth this year was 134.91% and 142.19% of those values, respectively. 2019 is now 211 cu km below the 17-year average.

    The latent heat released in the formation of the new ice is 3.01984E+19 Joules, or 3.0198E+07 TeraJoules.

    Correction of a typo from my post yesterday 12:36 am: I reported the gap between 2018 and 2019 for the day as 630 cu km. This was 100 too low. It was 730. It has grown in this current report to 776.

  11. Gamecock says:

    ‘Most of the Arctic is covered with ice more than two meters thick.’

    That’s not good. LESS ice is better. Wanting the Arctic to be covered with ice is strange.

  12. Henk van der Wilt says:

    Didn’t know climate scientists worked for ROLLINGSTONE……if their opinion on music is already so poor, why say something about our weather patterns.

  13. JJ Reuter says:

    https://youtu.be/Vj1G9gqhkYA Latest NASA propaganda release for your viewing pleasure.

    • Disillusioned says:

      The latest? The date is October 28, 2016.

    • spike55 says:

      NSIDC Arctic sea ice extent is HIGHER now for the same day than in 2015, 2016, 2017 and 2018 and 2006

      DMI volume is HIGHER now for the same day than in 2008, 2009, 2001, 2012, 2012, 2016, 2017, and 2018.

  14. Windsong says:

    It has been cold, snowy and wet in the Puget Sound area this month. Last month, not so much. My brother had his carport collapse on his truck from rain saturated snow five days ago. A brother-in-law had an ice coated tree fall on his boat and trailer in his side yard. My local school district took an unprecedented (and unnecessary) five(!) snow days last week, and two the prior week. And the Washington Army National Guard was called out last week to assist lowland eastern King County towns buried under snow. Time to check out David DuByne’s latest video over at Adapt 2030.

  15. Steven Fraser says:

    DMI Sea Ice Volume report for Feb 17: Volume rose 85 cu km since yesterday, to 21,899 cu km, which is 99.07% of the day’s average value in the 17-year series, and 98.78% in the DMI-charted 10-year reference period 2004-2013.

    The day’s average growth in the 17-year series was 78 cu km, and for the reference period 84 cu km. Comparatively, the day’s growth this year was 108.17% and 101.21% of those values, respectively. 2019 is now 205 cu km below the 17-year average, and 806 cu km above last year on this date.

    The latent heat released in the formation of the new ice is 3.01984E+19 Joules, or 3.0198E+07 TeraJoules.

    It has been interesting to watch the progression this year, as the graph provided by Tony shows this year advancing through a pronounced gap in the previously graphed values. This relationship appeared in December last year, and the gap seems to narrow and close at the end of March.

  16. Steven Fraser says:

    DMI Sea Ice Volume report for Feb 18: Volume rose 76 cu km since yesterday, to 21,875 cu km, which is 99.11% of the day’s average value in the 17-year series, and 98.77% in the DMI-charted 10-year reference period 2004-2013.

    The day’s average growth in the 17-year series was 69 cu km, and for the reference period 80 cu km. Comparatively, the day’s growth this year was 110.50% and 95.20% of those values, respectively. 2019 is now 198 cu km below the 17-year average, and 834 cu km above last year on this date.

    The latent heat released in the formation of the new ice is 2.31673E+19 Joules, or 2.3167E+07 TeraJoules.

  17. Steven Fraser says:

    DMI Sea Ice Volume report for Feb 19: Volume rose 64 cu km since yesterday, to 22,039 cu km, which is 99.14% of the day’s average value in the 17-year series, and 98.79% in the DMI-charted 10-year reference period 2004-2013.

    The day’s average growth in the 17-year series was 58 cu km, and for the reference period 59 cu km. Comparatively, the day’s growth this year was 111.16% and 108.05% of those values, respectively. 2019 is now 191 cu km below the 17-year average, and 857 cu km above last year on this date.

    The latent heat released in the formation of the new ice is 1.96443E+19 Joules, or 1.9644E+07 TeraJoules.

    The 2018-2019 Sea Ice Volume growth just passed the 22,000 cu km threshold in this report, achieving this level 1 calendar day before the average milestone day in the DMI series, and ranking #8 of the 16 growth years. These rankings are unchanged since the 21,000 and 20,000 threshold dates.

  18. Steven Fraser says:

    DMI Sea Ice Volume report for Feb 20: Volume rose 42 cu km since yesterday, to 22,081 cu km, which is 99.09% of the day’s average value in the 17-year series, and 98.69% in the DMI-charted 10-year reference period 2004-2013.

    The day’s average growth in the 17-year series was 58 cu km, and for the reference period 54 cu km. Comparatively, the day’s growth this year was 72.78% and 70.51% of those values, respectively. 2019 is now 203 cu km below the 17-year average, and 834 cu km above last year on this date.

    The latent heat released in the formation of the new ice is 1.28707E+19 Joules, or 1.2871E+07 TeraJoules.

  19. Steven Fraser says:

    DMI Sea Ice Volume report for Feb 21: Volume rose 66 cu km since yesterday, to 22,147 cu km, which is 99.15% of the day’s average value in the 17-year series, and 98.69% in the DMI-charted 10-year reference period 2004-2013.

    The day’s average growth in the 17-year series was 53 cu km, and for the reference period 56 cu km. Comparatively, the day’s growth this year was 122.98% and 117.71% of those values, respectively. 2019 is now 191 cu km below the 17-year average, and 872 cu km above last year on this date.

    The latent heat released in the formation of the new ice is 2.00848E+19 Joules, or 2.0085E+07 TeraJoules.

  20. I like the way you make it simple. How helpful!

Leave a Reply to spike55 Cancel reply

Your email address will not be published. Required fields are marked *