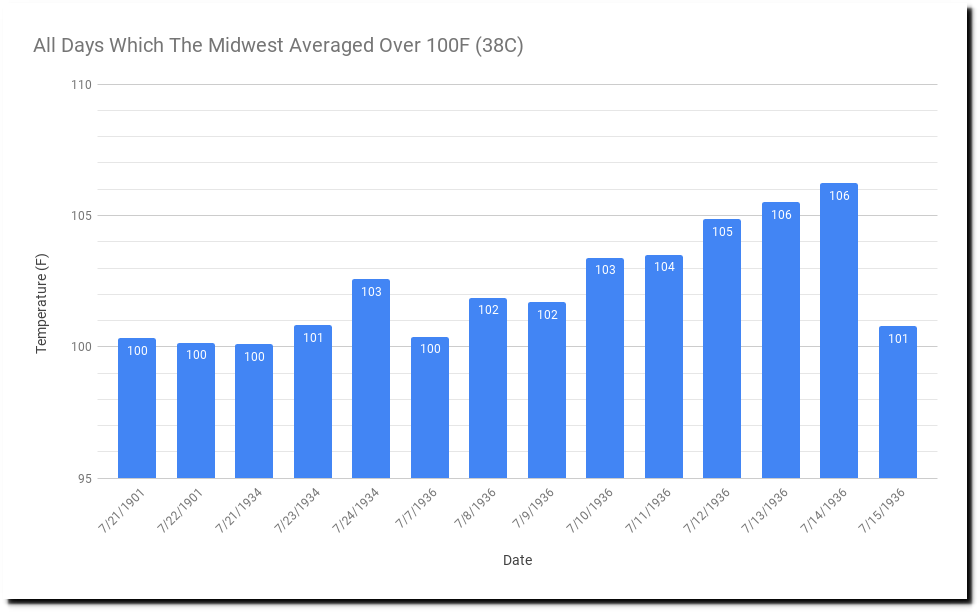
The Midwest has had only fourteen days since 1895 which averaged over 100 degrees (38C.) All occurred before 1937. The days were July 21-22 1901, July 21 1934, July 23-24 1934 and the incredible heatwave of July 7-15 1936 – nine consecutive days averaging over 100 degrees during that stretch. The hottest day was July 14, 1936 which averaged 106 degrees across the Midwest.
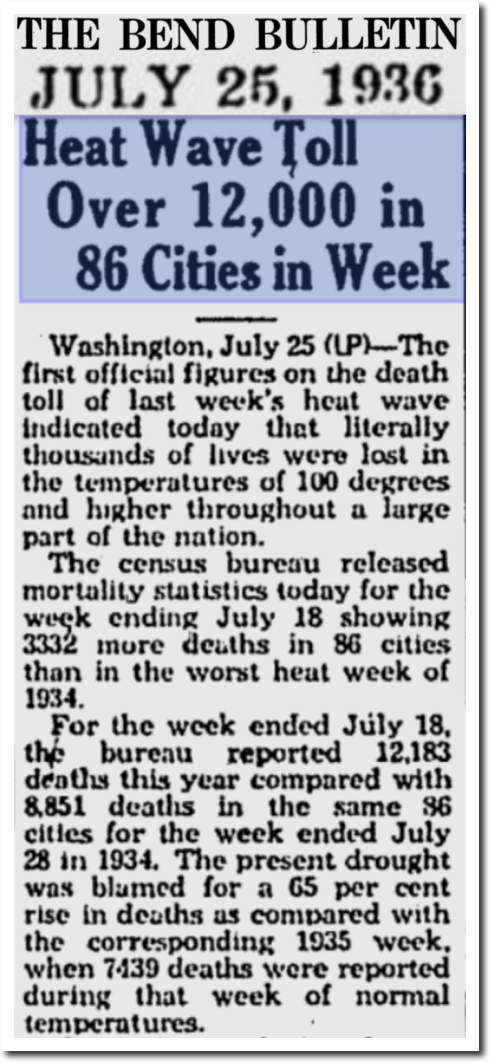
The Bulletin – Google News Archive Search
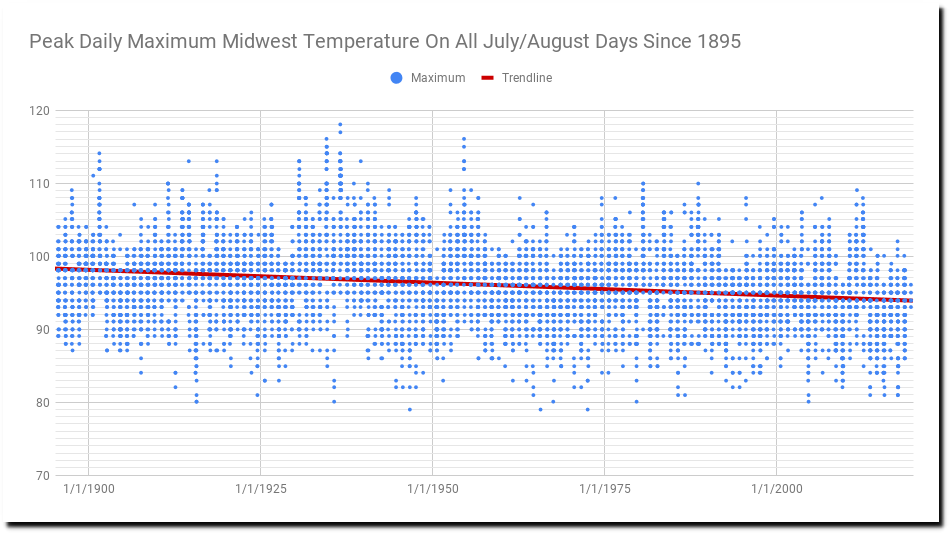
It is now very rare for Midwest temperatures to average over 90 degrees, and the average Midwest July/August temperature has dropped three degrees since the 19th century.
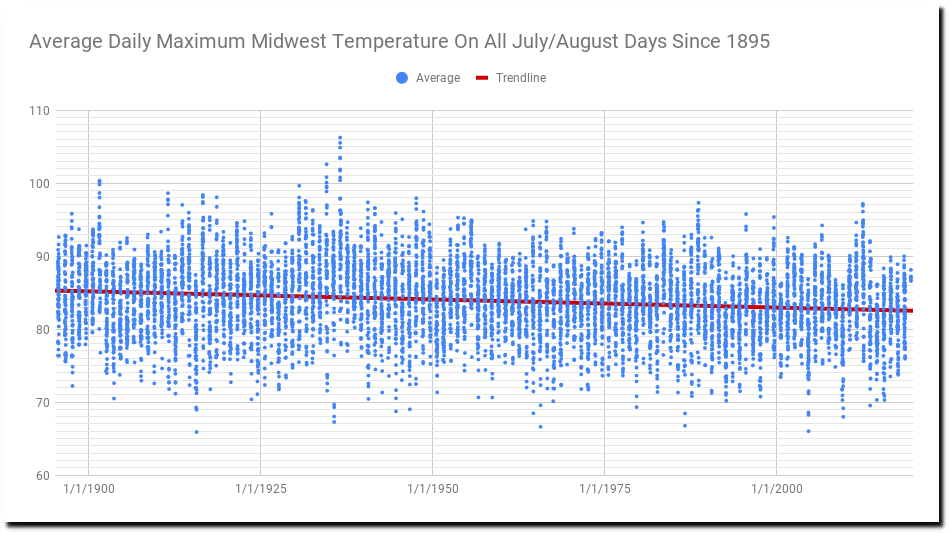
The hottest days have dropped about four degrees since the 19th century.
Meanwhile the criminals at the Union of Concerned Scientists claim the exact opposite, and want you to sign a petition that you “stand with science.”
Heat in the Heartland: 60 Years of Warming in the Midwest (2012) | Union of Concerned Scientists
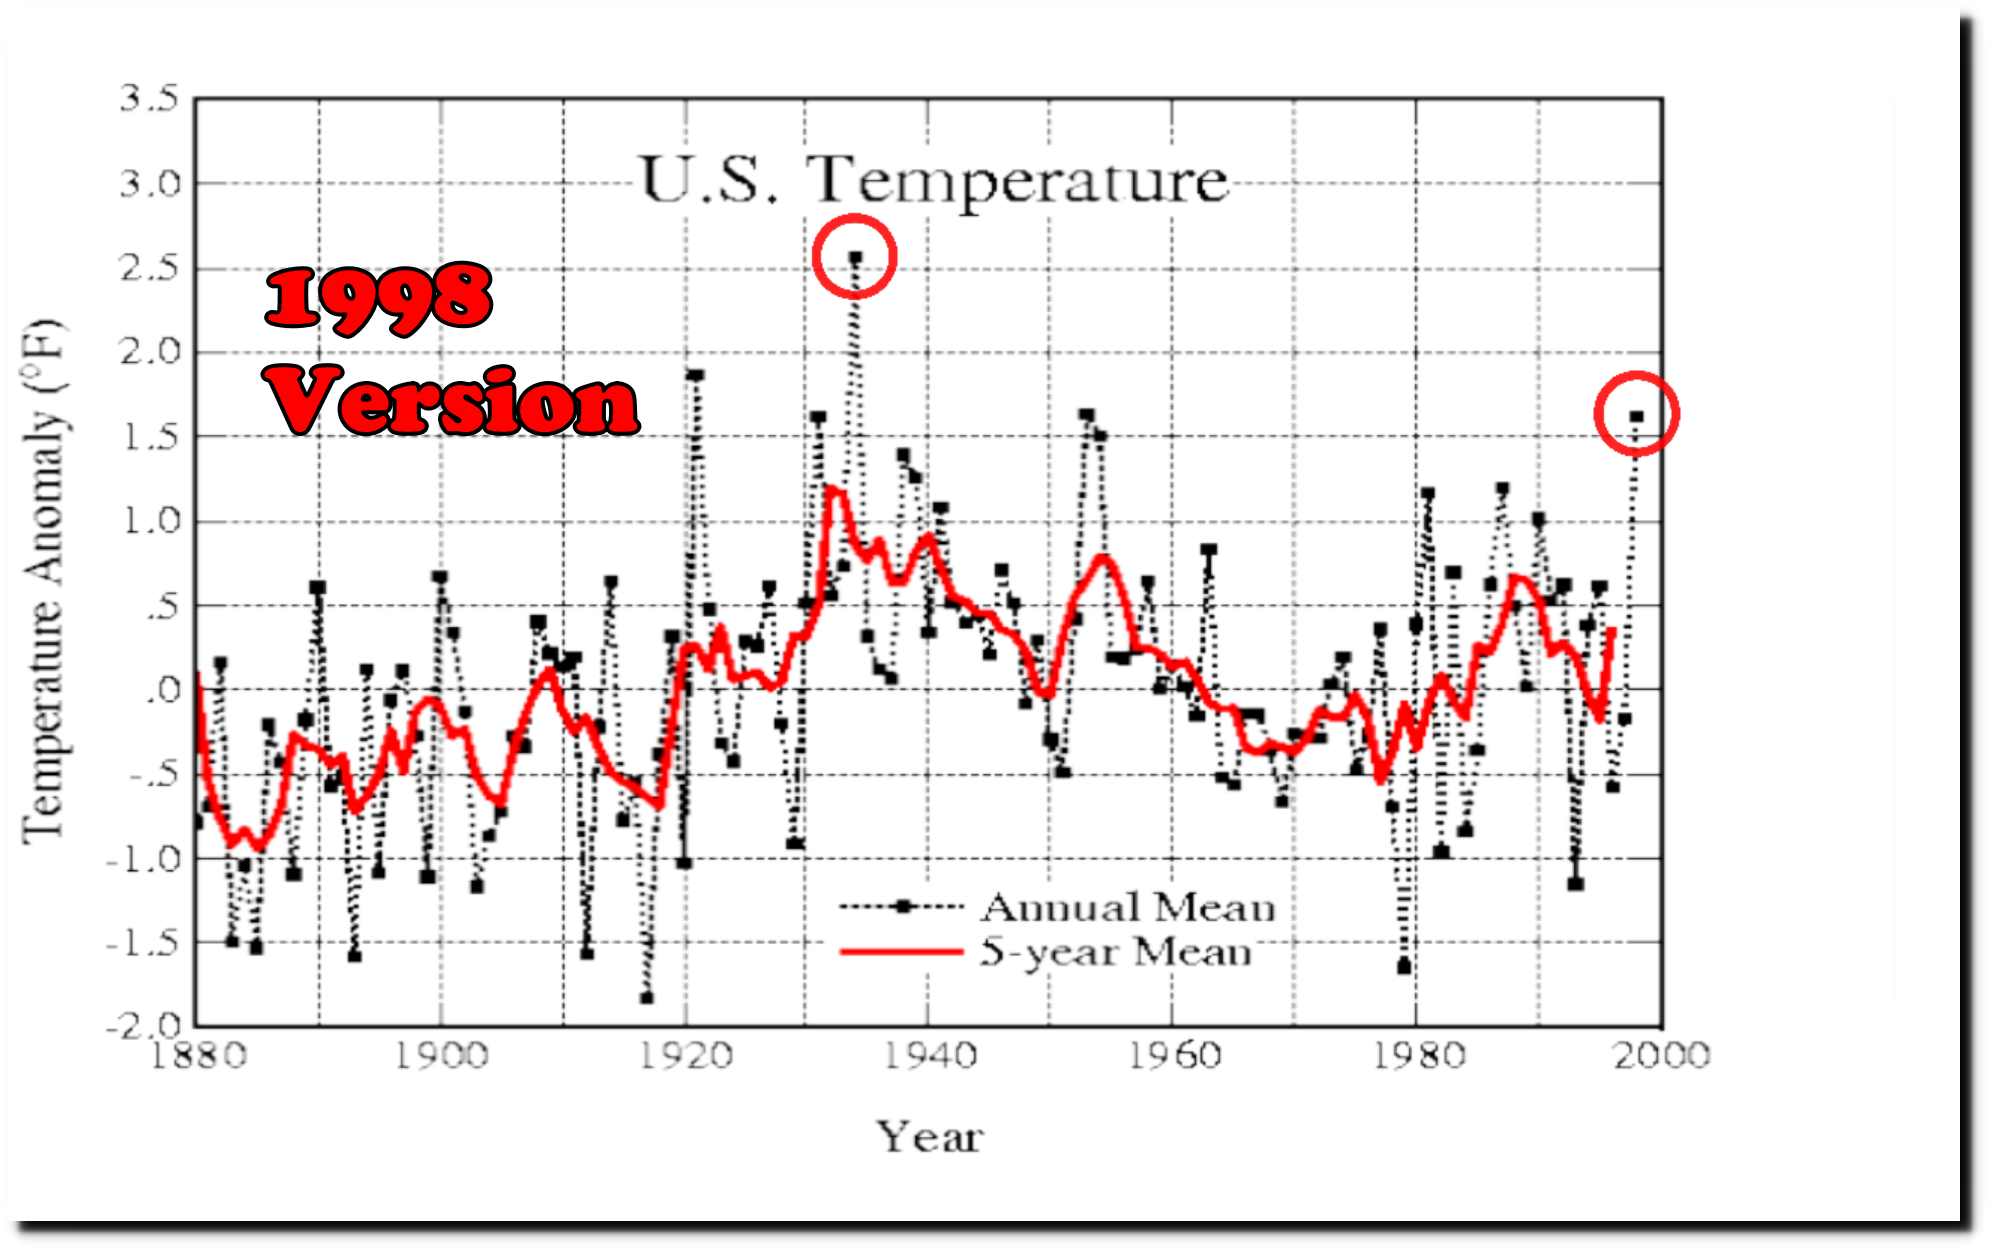
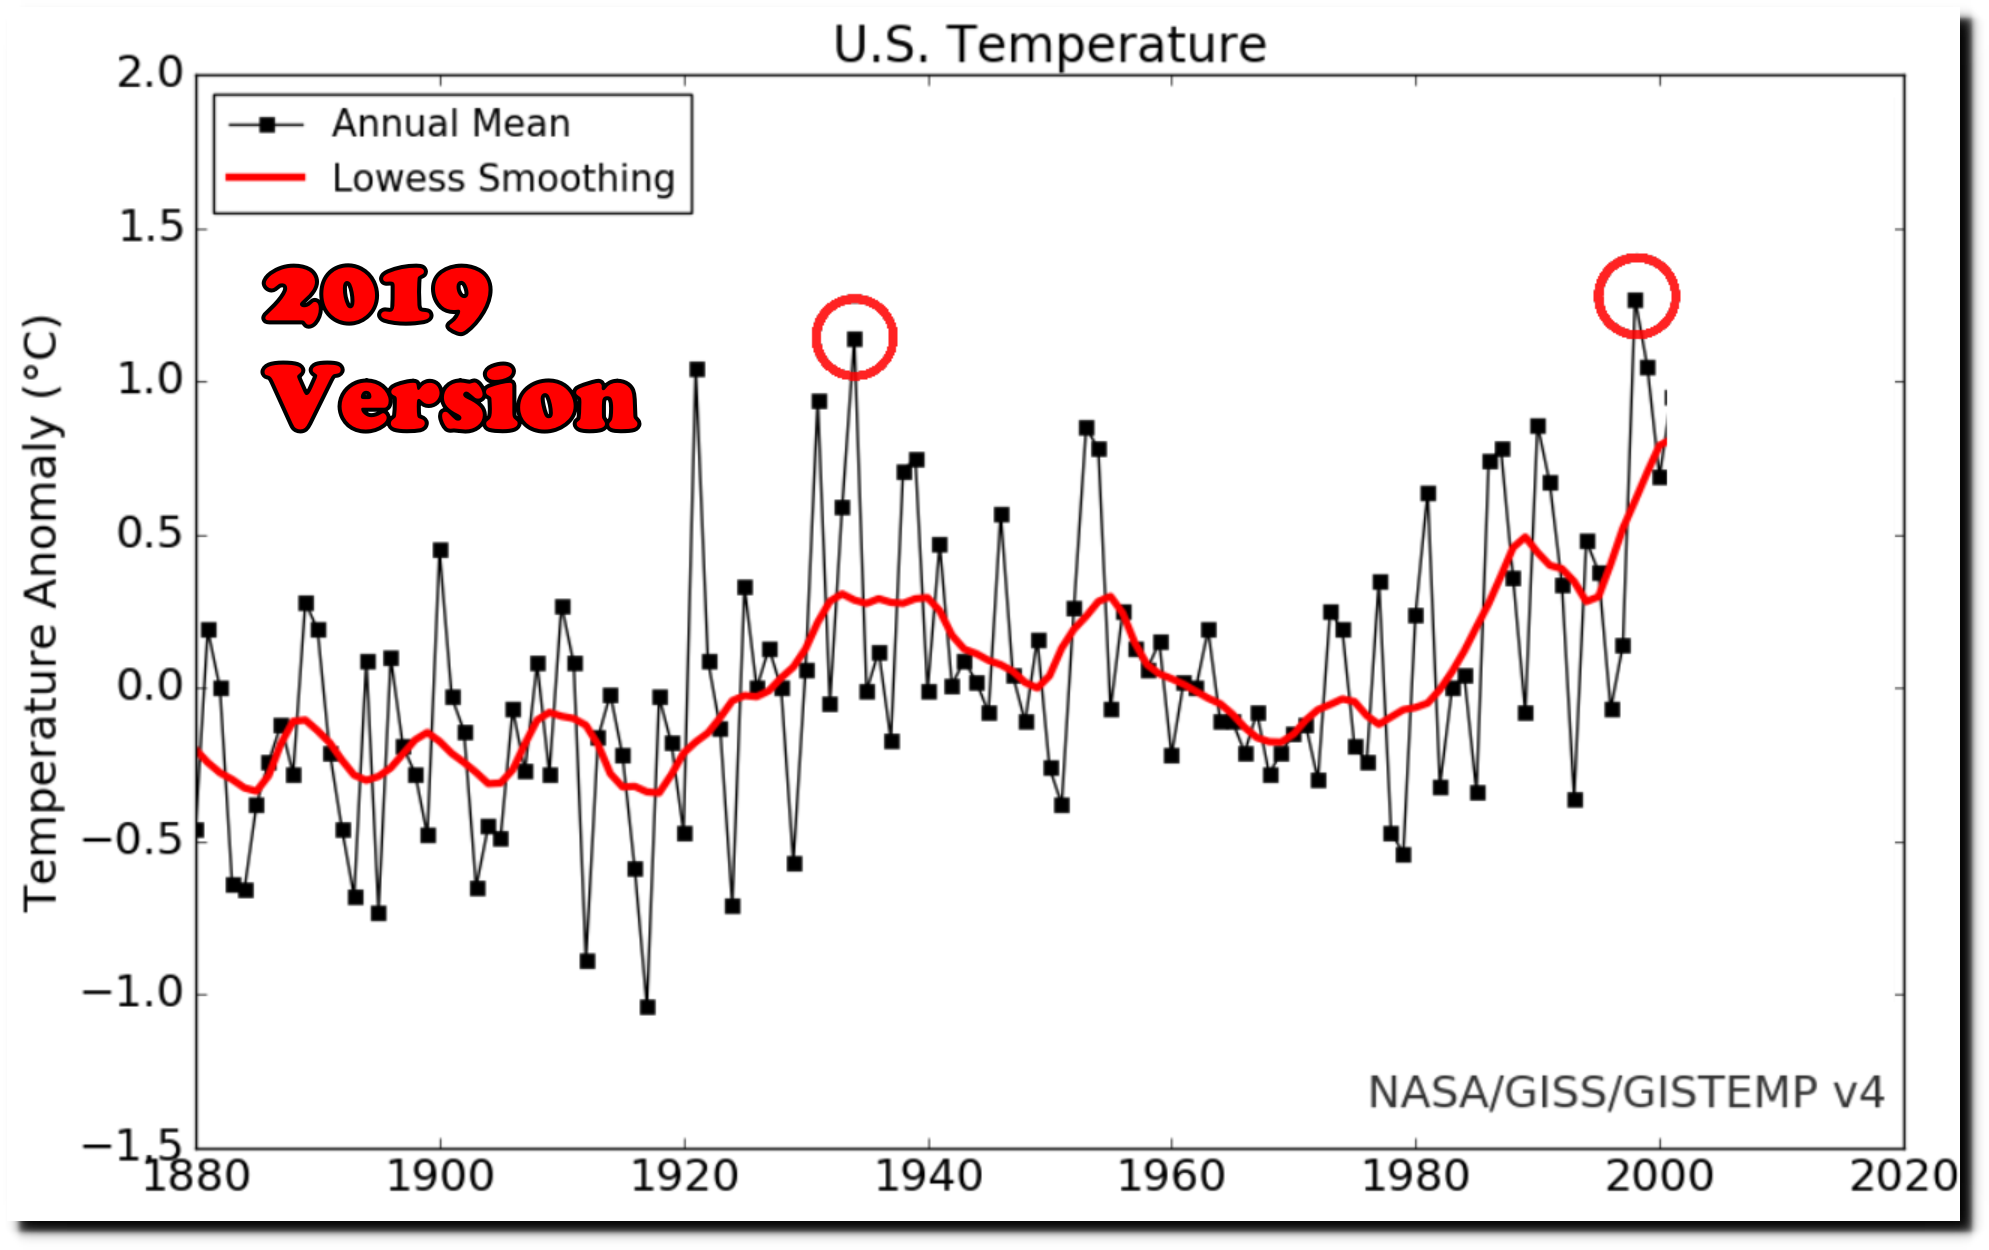
They hid all the pre-1955 temperatures in their report, but even for the time period they covered they still are lying. NASA and NOAA are doing exactly the same thing – hiding the heat of the 1930s. Huge amounts of money are dependent on keeping the climate scam alive.
Tony if your graphs above are falling temps and the sum of the parts should equal the average US temps then what areas and times are rising to make the total rise??
Any reported rise is a result of the fraudulent ‘adjustments’ that have been maliciously applied. When the foxes are in charge of the hen-house, you should not be surprised when things happen.
Why do you believe temperatures are rising in the US?
In Australia they call it ‘homogenizing’, yes my word choice might have made my question/thoughts unclear.
If you do as you have above for each separate area of the US the sum of the areas should equal the average US Temp, as the Midwest has a negative trend then there must be other areas that have been ‘homogenized’ with positive trends to give the NASA 2019 version above?
Infilling (using climate models), and fabrication of missing data (using biased AGW methodologies), and just plain “changing the data” !!
Don’t you know according to Joe Neguse that Colorado already has more extreme weather due to the climate crisis? https://neguse.house.gov/media/press-releases/congressman-neguse-secures-colorado-location-climate-committee-s-first
I think this is a source: https://www.sciencedirect.com/science/article/pii/S2212094716300470
The ‘ anthropogenic contributions” are living in stream beds, building at the base of a valley, parking lots, etc.
Don’t build a house in a stream bed and you won’t drown…common sense.
The native Americans understood that but yet the City of Boulder placed its Police Department, Emergency Command Center, Justice Center and main library right in the middle of the Boulder Creek floodplain and pretty much right at the mouth of Boulder Canyon.
Further downstream is Boulder’s largest medical center and CU wants to build in the South Boulder Creek floodplain as Tony has pointed out. In the late 1800’s there were devastating floods in Boulder. There have been more floods and major ones as recent as the late 1960’s. The idiots in charge here don’t learn but rest assured they blame climate change.
Two thoughts:
1. The papers indicate deaths in cities. 86 of them.
Considering the poor quality of knowledge and reporting for the entire country,
the numbers are likely low.
2.Washington State, especially in the central part, has been cool in much of June and so far in July. This coming Sunday the forecast is for near 90 degrees. Seems still a bit low, but does seem like summer is going to arrive.
How can I send you clippings that I think you’ll enjoy.