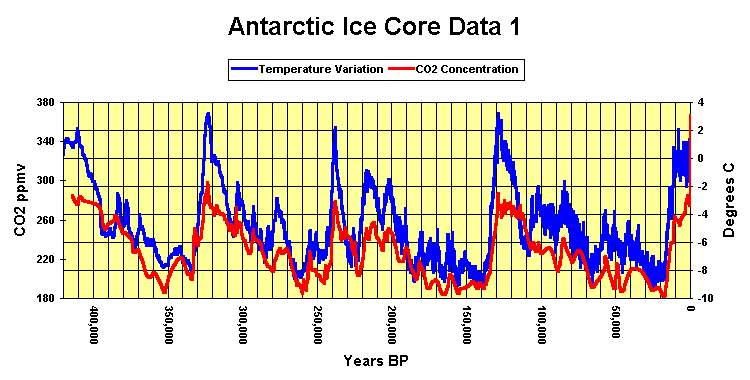
Most people are intelligent enough to understand that the horse pulls the cart, but not climate scientists.
As ocean temperature rises, CO2 solubility decreases – pushing more CO2 into the atmosphere. Thus we see CO2 trailing temperature in ice cores.
An entire religion has developed around a backwards view of this relationship. Al Gore’s buddy Laurie David went so far as to reverse the relationship, in her book intended to pollute children’s minds with cult religious BS.


Take 3 and half minutes to get a excellent graphic representation of CO2 in a video. This was the short excerpt from the Great Global Warming Swindle that turned me from a warmist to a skeptic. Note that the ipcc had claimed a causal correlation between CO2 and temperatures, but after a fight the ipcc, in 2003, finally had to concede that there was no evidence of any causal correlation. But Al Gore in his 2005 movie willfully deceived the public, knowingly continuing to maintain that there was a causal correlation, this pivotal video exposes Al Gore’s deceptions on CO2:
http://www.youtube.com/watch?v=WK_WyvfcJyg&info=GGWarmingSwindle_CO2Lag
For basically pointing this out, and showing that natural releases of CO2 swamped human emissions, Murray Salby was demonized by the climate alarmists and fired from his job.
If the oceans cool and CO2 concentrations in the atmosphere level or decline there will be some explaining to do. I think most warmists do not understand this physical property of water.
If it takes 800 yrs to happen, I don’t expect to witness it.
The global warming Nazis will argue that “it’s different this time.” And obviously they are correct to point out that mankind’s combustion of fossil fuels is recent. Study should be about how much warming will result from this. However, we would not be here today if there was a tipping point where CO2 causes out of control feedback and dangerously higher temperatures. We know that in the past CO2 levels in the atmosphere were much higher.
I cannot understand how anyone remotely conversant with physical science does not understand that gas solubility in a liquid decreases as the temperature increases. Set a glass of cold water out on a counter on a hot day, and as the water temp increases, bubbles of dissolved air appear on the inside surface of the glass. Weird they don’t get it!
As to the CO2 itself, my understanding is that roughly 96 to 97% of all CO2 emitted into the atmosphere is from natural sources, primarily the degassing of the oceans, decaying biomass, and volcanos. Does anyone have the estimated relative amounts of CO2 from each of these (or other) sources?
One last point: The chart could also be used to predict something that is truly not good…it looks as though temps might have peaked and a cooling trend is developing that would closely match those from earlier eras. I hope not!
Imagine if our current interglacial temp trend matched the one from 420k to 410k…they would have loved that spike at 410k!
Personally all I need is aplot of co2 and temp with a matched scale so they sit on top of eeach other. Then add that 400ppm data point to the co2 series and try to find a discernible temp response.
Effect cannot precede cause — something the alarmist crowd doesn’t understand.
This chart shows conclusively that ?temperature is the cause of ?CO2.
But there are no charts showing that CO2 is the cause of changing T.
“As ocean temperature rises, CO2 solubility decreases”
Try telling that to an ocean acidification fanatic.
Actually a perfect example of negative feedback; it’s almost impossible for the oceans to acidify (from CO2 warming).