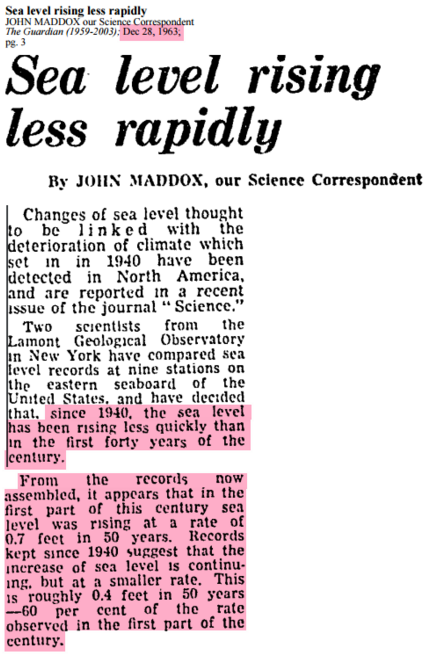
In 1963, the Guardian reported a sharp drop in sea level rise rates since 1940.
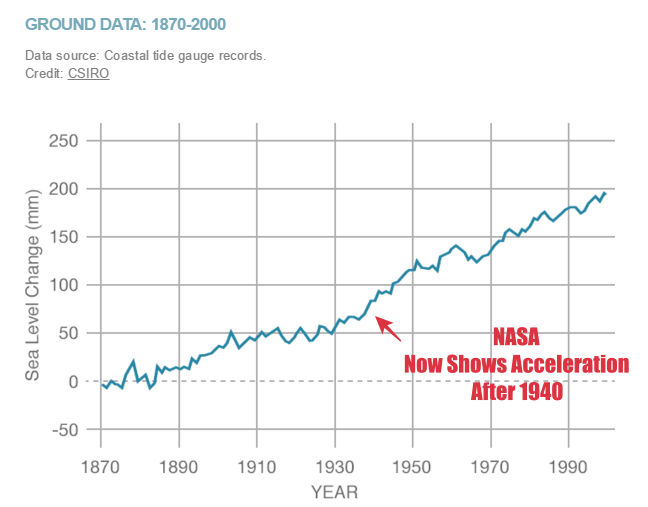
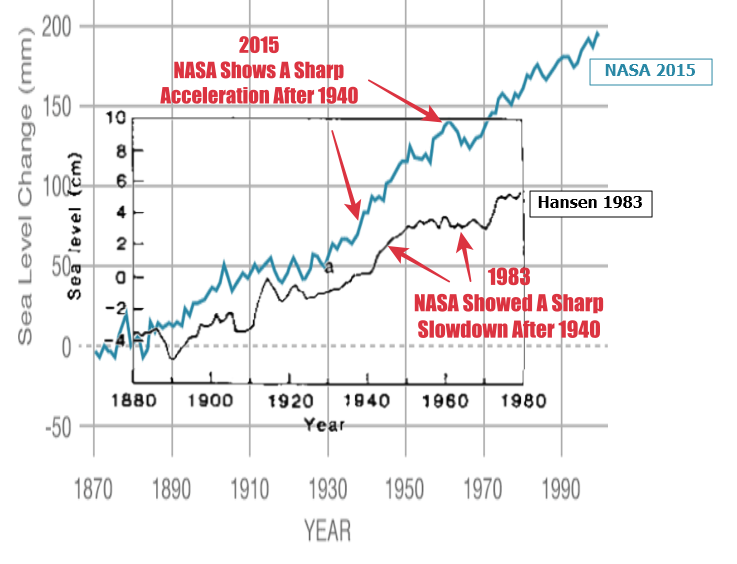
NASA data now shows a sharp rise after 1940. The exact opposite of what actually happened.
As late as 1983, NASA still showed a sharp drop in rise rates after 1940, in a study done by the modern father of global warming
As with essentially all NASA climate graphs, their sea level graph has been massively tampered with and is propaganda, not science.


Reblogged this on WeatherAction News.
Hey but these graphs were all pal reviewed opps I mean peer reviewed and so they are gospel … right Moron Smith?
Stewart
”
Q. What do you call a gullible fool with a calculator?
A. A climate scientist
Q. What do you call a gullible fool with a calculator, who knows how to turn it on?
A. A a BBC/Guardian climate science expert.
Q. What do you say to a BBC climate science expert in a few years time?
A. Big Mac, large fries, please.
Q. What do you say to a former MP caught up in climate science scams?
A. Has Open Prison changed you?
Dec 19, 2015 at 3:20 PM | Unregistered Commenter golf charlie”
More of these at
http://bishophill.squarespace.com/discussion/post/2563294
We each live inside in a worldwide matrix of deceit.
For sixty-five years I could not figure out why scientists in my field of study (geo-, cosmo-, nuclear, solar and space physics) deceived the public until I discovered evidence of unreported events at Konan, Korea in AUG-SEPT 1945 that changed the course of world history and led world leaders to unite nations on 24 OCT 1945.
https://lnkd.in/bEgrBTB
Today world leaders are desperately trying to complete the unification of nations under a one-world government (UN) before the public learns of the unreported events on AUG-SEPT 1945 that triggered this decision to enslave the public.
Colorado University’s Sea Level Research Group, keepers of the satellite data, also re-writes the historical record:
http://oi67.tinypic.com/ojdn6h.jpg
CU’s 2004 Release 1.2 yields a rate of 2.6 mm/yr and today’s 2015 release 4 for the same time series yields a rate of 3.5 mm/yr.
I love that graph. Thanks Steve.
A word of caution that does not change the conclusion. 2004 does not include the GIA adjustment of ~0.3mm/yr. 2015 does. BUT, essay Pseudoprecision archived and published their estimate as of ye 2013. It was 3.1mm/yr with GIA, and 2.8 without. NOT 3.5 with, and 3.2 without. So your point remains valid.
GIA adjustments for sea level are like me adding planetary motion to my truck’s speedometer.
First chuckle of the day – well belly laugh actually (-:
🙂 +1
http://www.webweaver.nu/clipart/img/people/men/rotlmao.gif
Heads up…..
I thought you would be interested in this story I found on MSN: The storm that will unfreeze the North Pole http://a.msn.com/04/en-us/BBo2Bxy?ocid=se
That article is classic, At least in this prediction will be shown wrong by Monday. But alas, in the short term twitterverse, that is too long to remember for the masses.
This has to top all. Time Magazine article on the warm weather at the North Pole.
Stormy weather in the North Atlantic has brought balmy weather to the world’s northernmost point.
http://time.com/4164104/north-pole-temperature-heat/
Now click on the “hit 42 degrees Fahrenheit” link.
It goes to the town of North Pole Alaska.
Where of course Santa’s House is.
http://i249.photobucket.com/albums/gg216/kensaroo/northpolesanta.jpg
The article mentions the “Arctic region.” Maybe by now the folks at Time.com have discovered that North Pole, AK, is a suburb of Fairbanks and sits below the Arctic Circle.
I don’t think they have any idea where or what the North Pole is.
http://i249.photobucket.com/albums/gg216/kensaroo/Northpole.jpg
Reblogged this on Climate Collections.