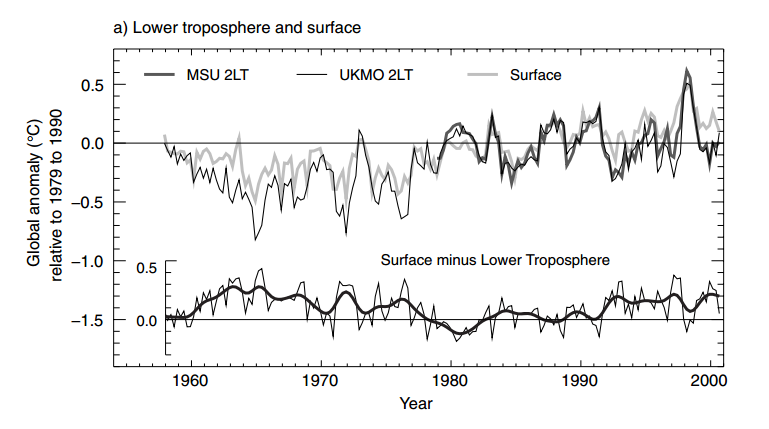
In the 2001 IPCC report, both satellites and balloons showed no warming from 1980 to 2000.

www.ipcc.ch/ipccreports/tar/wg1/pdf/TAR-02.PDF
As with the MWP, 1940’s blip, 1970’s global cooling and current hiatus – the 1980-2000 hiatus has simply disappeared.


Facts have an annoying habit of getting in the way of a good narrative.
No doubt someone will be along soon saying it’s the wrong graph or has been hand-drawn.
https://coloradowellington.files.wordpress.com/2015/11/troll-shifty-and-speedy.jpg
https://coloradowellington.files.wordpress.com/2015/11/troll-wrong-graph.jpg
Save Martin the trouble of posting.
“There never was no warming between 1980 and 2000. Why do you have to lie, even if the charts say you are telling the truth?”
Yes…no, there never was no warming.
There HAS SO been warming over the last 18 years!
.
.
.
.
.
.
Its just that its been cancelled by cooling. 😉
So the IPCC agree the hiatus is really from 1980 to 2016 ?
PRECISELY (as I just mentioned on JoNova) 🙂
36 years of NO WARMING !
Actually, there was a step change around the 1998 El Nino, of about 0.26ºC
In RSS the trend in that 1979-1998 period is very small, just like the downward trend after the El Nino is small.
But they essentially cancel themselves, leaving the El Nino as the ONLY warming in the last 36 or so years.
http://s19.postimg.org/ojf5tbz1v/RSS_cancel.jpg
I do not think the step change will happen with the 2015-16 El Nino.
1. The AMO is turning down.
2. The RRR appears to be gone, and therefore the “blob” will likely cool; and so global SST will, I think, not respond up, and with a strong La Nina we may see a step down.
Solar cycle 24 starting in 2009 certainly has been anemic. Another factor is Albedo/Clouds.
Total amount of precipitable water (ascending) in the atmosphere above the oceans
9 December 2015
http://www.climate4you.com/images/RecentTotalPreciptableWater.gif
4 January 2016
http://www.ospo.noaa.gov/data/mspps/nn_images/amsua_tpw_asc.gif
Cloud Liquid Water (Ascending) 4 January 2016
http://www.ospo.noaa.gov/data/mspps/nn_images/amsua_clw_asc.gif
MORE HERE: http://www.ospo.noaa.gov/Products/atmosphere/mspps/noaa18prd.html
Cloud cover correlates with global temperature (R^2 = 0. 28)
http://www.climate4you.com/images/TotalCloudCoverVersusGlobalSurfaceAirTemperature.gif
Total monthly cloud cover 1983 to the end of 2009. (NASA has not updated info.) Note low cloud cover 1997 to 2000.
http://www.climate4you.com/images/CloudCoverTotalObservationsSince1983.gif
High clouds
http://www.climate4you.com/images/CloudCoverHighLevelObservationsSince1983.gif
Low clouds
http://www.climate4you.com/images/CloudCoverLowLevelObservationsSince1983.gif
And Tropical (15oN-15oS) high (red) and low (purple) cloud cover
http://www.climate4you.com/images/HadCRUT3%20and%20TropicalCloudCoverHIGH-MEDIUM-LOW%20ISCCP.gif
I sure would like to see those graphs up to date!
Thing is, UAH shows basically the same as the top graph.
http://s19.postimg.org/kwu22mwc3/UAH1980_2000.jpg
Verification that UAH is CORRECT..
MannPro – “Like it never even happened”