In 1999, James Hansen published this map – showing that most of the US had cooled between 1950 and 1998.
Fig. 2: Change of surface temperature during 1950-98 based on local linear trends.
in the U.S. there has been little temperature change in the past 50 years, the time of rapidly increasing greenhouse gases — in fact, there was a slight cooling throughout much of the country
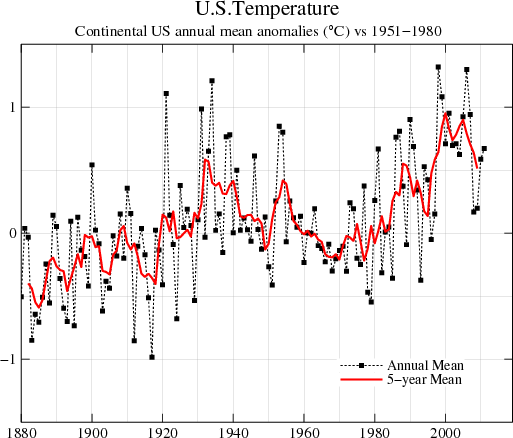
I can’t generate the equivalent current map, because the GISS web site has been broken for two weeks – but Hansen’s current US temperature graph shows a strong warming trend from 1950-1998.
Our trusted government scientists have taken it upon themselves to rewrite the nation’s history.


Reblogged this on Climate Ponderings.