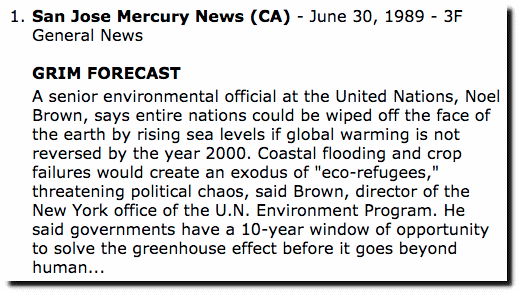
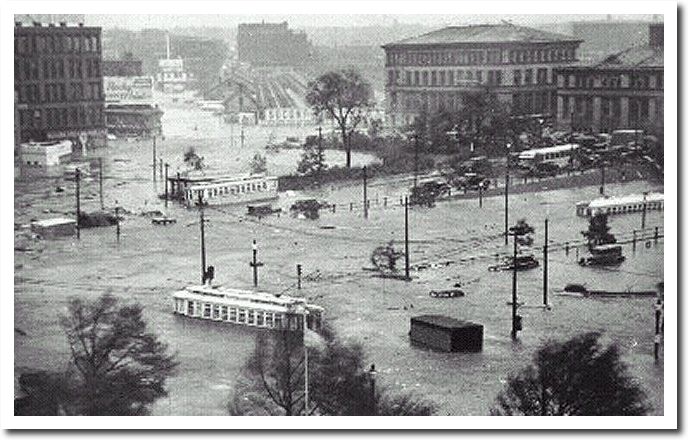
Thirty years ago, the UN said we only had until the year 2000 to save ourselves from global warming.
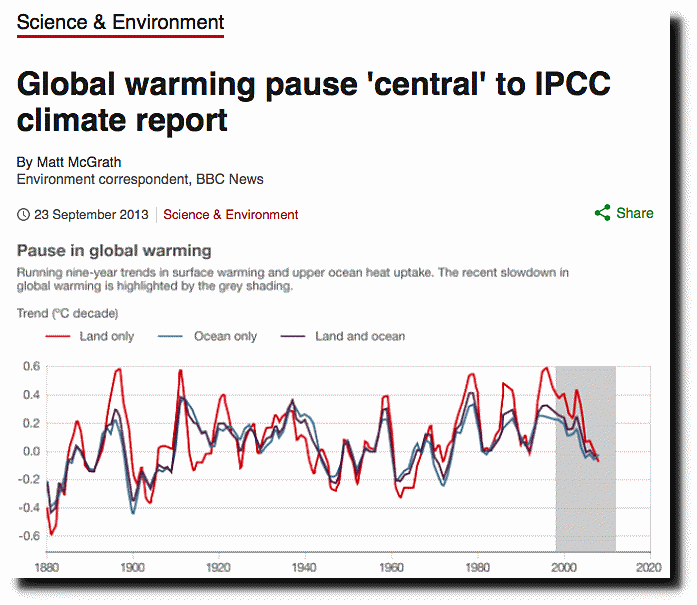
But after decades of fear mongering about global warming, five years ago the global warming pause forced climate alarmists in a new direction.
Global warming pause ‘central’ to IPCC climate report – BBC News
Alarmists quit talking about warming, and started talking about “climate change” “climate disruption” and “extreme weather.” Now every weather disaster is shown over and over again on television, and emotionally linked to rising greenhouse gas concentrations – just as Pavlov conditioned dogs to drool when they heard a bell ring.
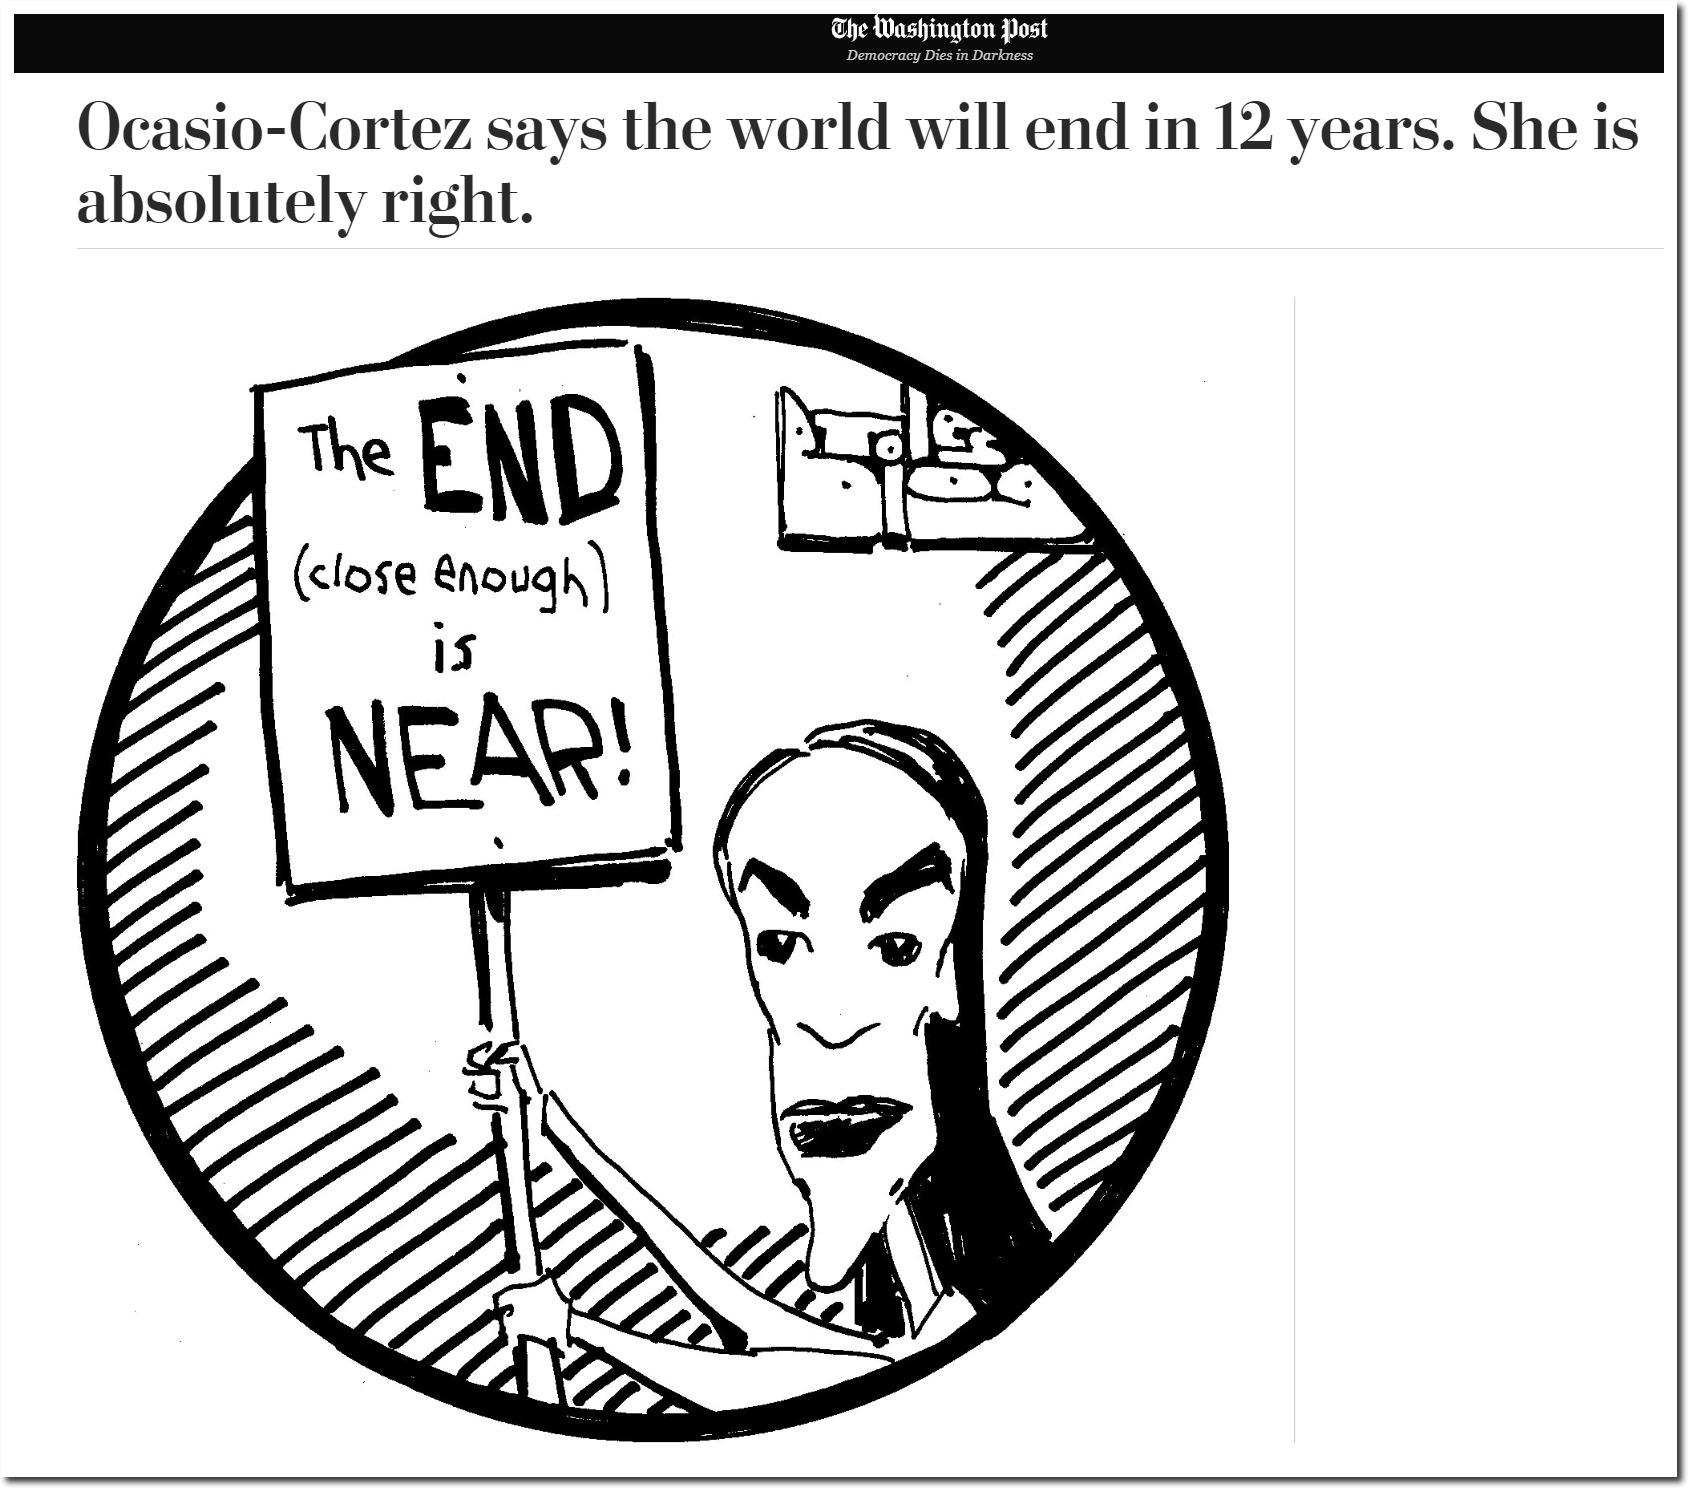
The brainwashing has been very successful. The Washington Post says the world will end in the year 2o31, unless we give up our cars, fuel supply, freedom, money, democracy and meat. Note that this is a 31 year reprieve from the UN’s 1989 forecast.
Ocasio-Cortez says the world will end in 12 years. She is absolutely right. – The Washington Post
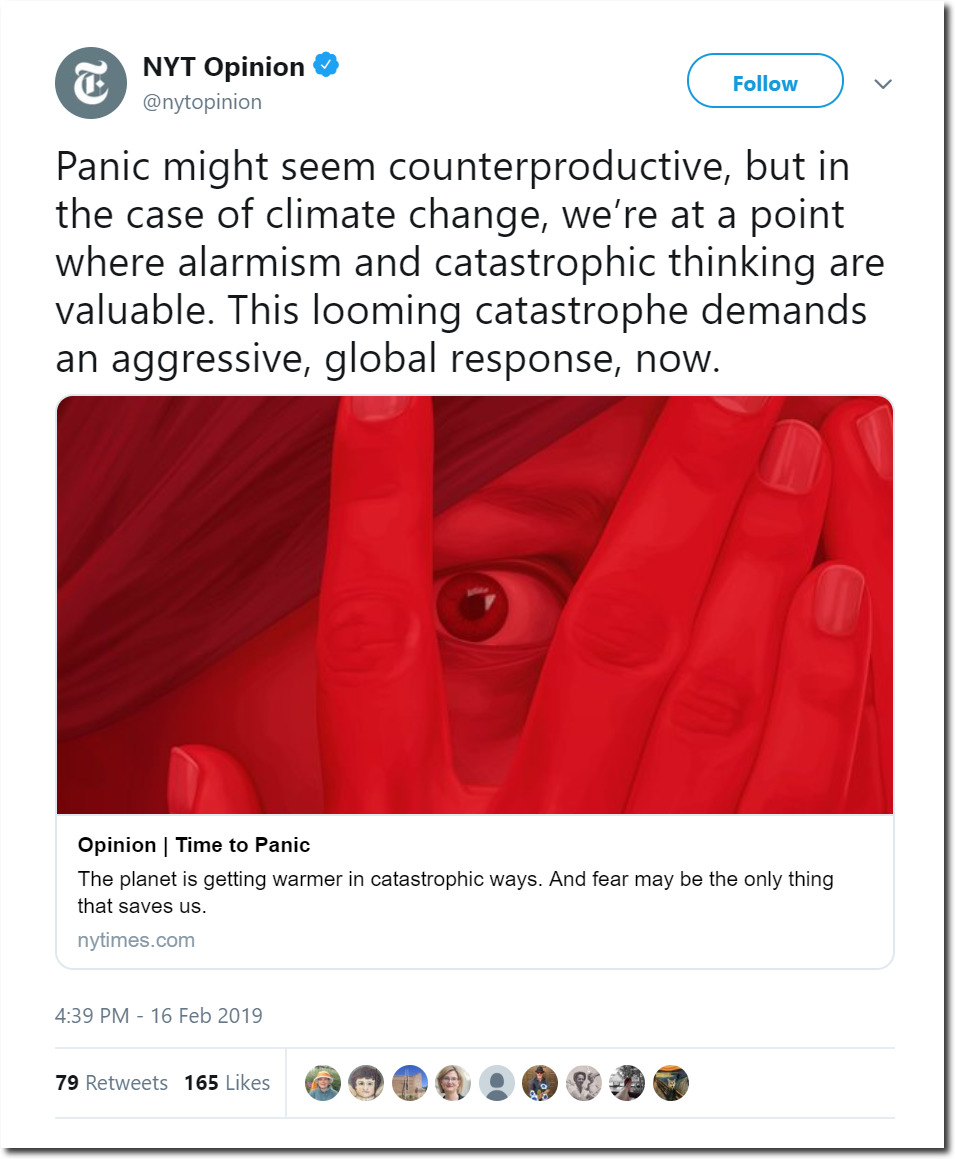
And the New York Times says it is time to panic.
NYT Opinion on Twitter: “Panic might seem counterproductive,
This sort of insanity used to be the banter of isolated cults, but has gone fully mainstream among progressive circles.
Without any perspective of history, many young people have no way to filter climate propaganda. How would Alexandria Ocasio-Cortez know any better? She is a child who has heard nothing but propaganda for her entire short life.
The only way to know if climate is getting more extreme is to compare current weather with past weather. Claims are being made that heatwaves are increasing, along with fires, floods, hurricanes, tornadoes, droughts, sea level rise, earthquakes and just about every other imaginable complaint of the human condition.
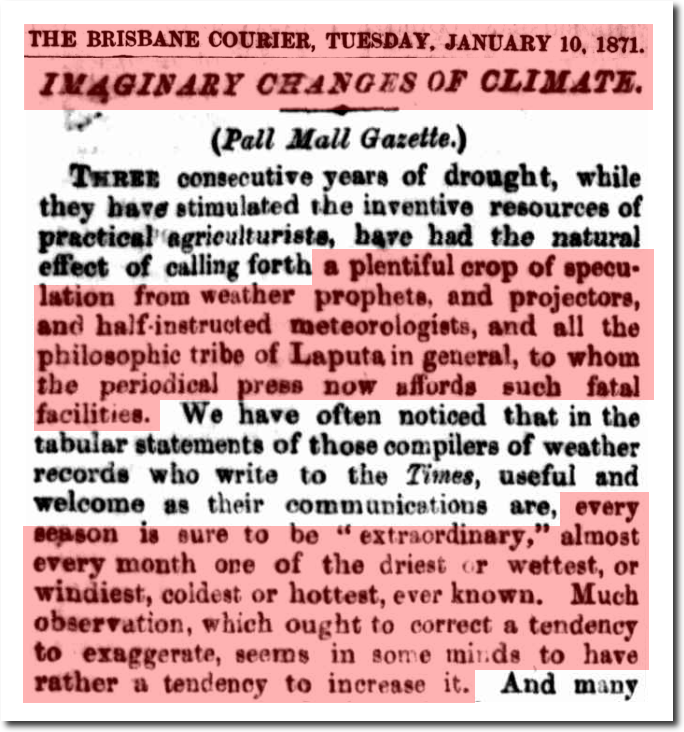
This is nothing new – every generation imagines they live in the most extreme climate ever, and have experts and statistics to prove it.
IMAGINARY CHANGES OF CLIMATE.
(Pall Mall Gazette.)
a plentiful crop of speculation from weather prophets and projectors, and half-instructed meteorologists, and all the philosophic tribe of Laputa in general, to whom the periodical press now affords such fatal facilities.
every season is sure to be “extraordinary,” almost every month one of the driest or wettest, or windiest, coldest or hottest, ever known. Much observation, which ought to correct a tendency to exaggerate, seems in some minds to have rather a tendency to increase it.
– Brisbane Courier, January 10 1871
10 Jan 1871 – IMAGINARY CHANGES OF CLIMATE
06 Oct 1939, Page 6 – The Des Moines Register at Newspapers.com
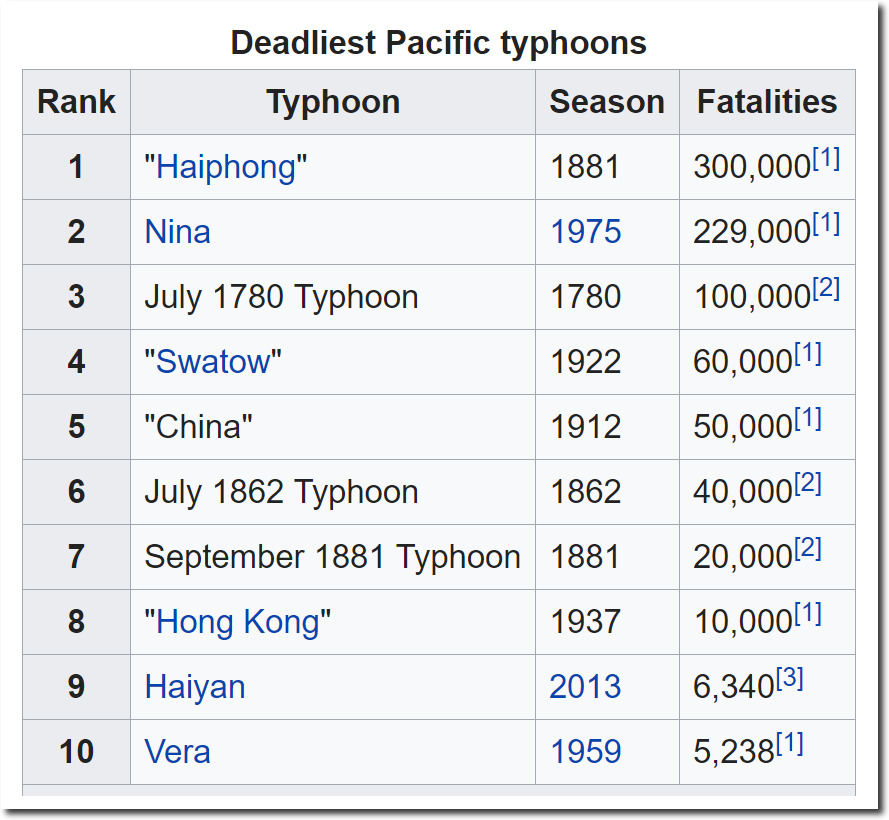
So are hurricanes actually becoming worse? Of the ten deadliest Pacific cyclones, nine occurred with CO2 below 350 PPM. Two of the ten deadliest occurred in 1881. The third deadliest occurred in 1780, and killed 100,000 people.
Template:Deadliest typhoons – Wikipedia
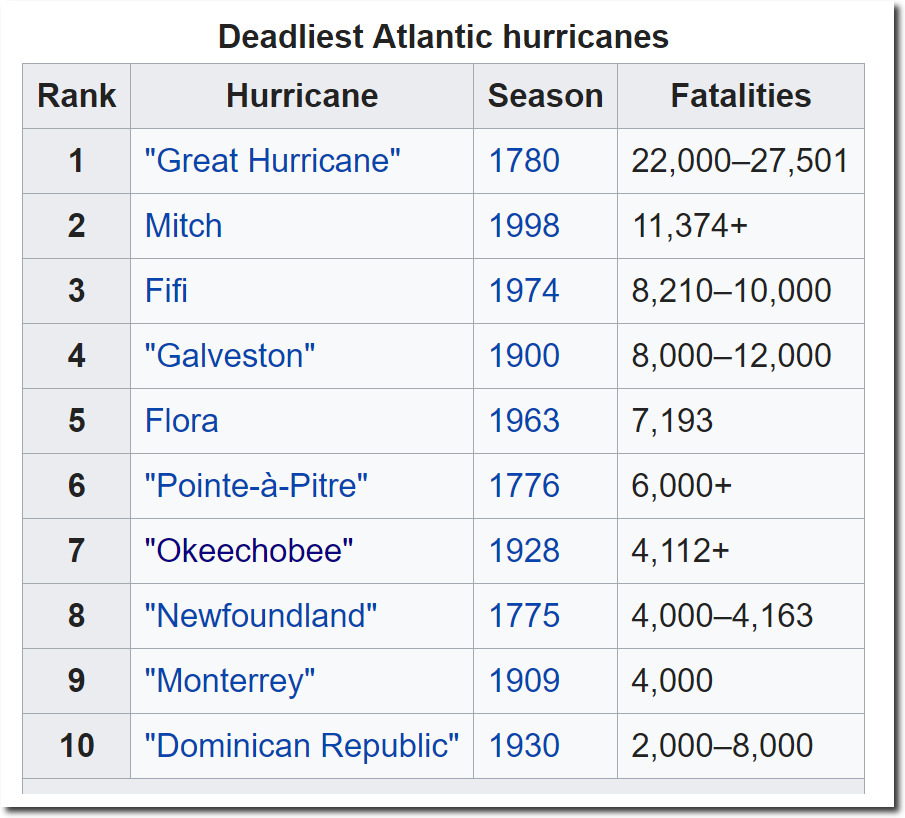
The deadliest Atlantic hurricane also occurred in 1780. Of the ten deadliest Atlantic hurricanes, nine occurred with CO2 below 350 PPM, and three occurred during the Revolutionary War.
List of Atlantic hurricane records – Wikipedia
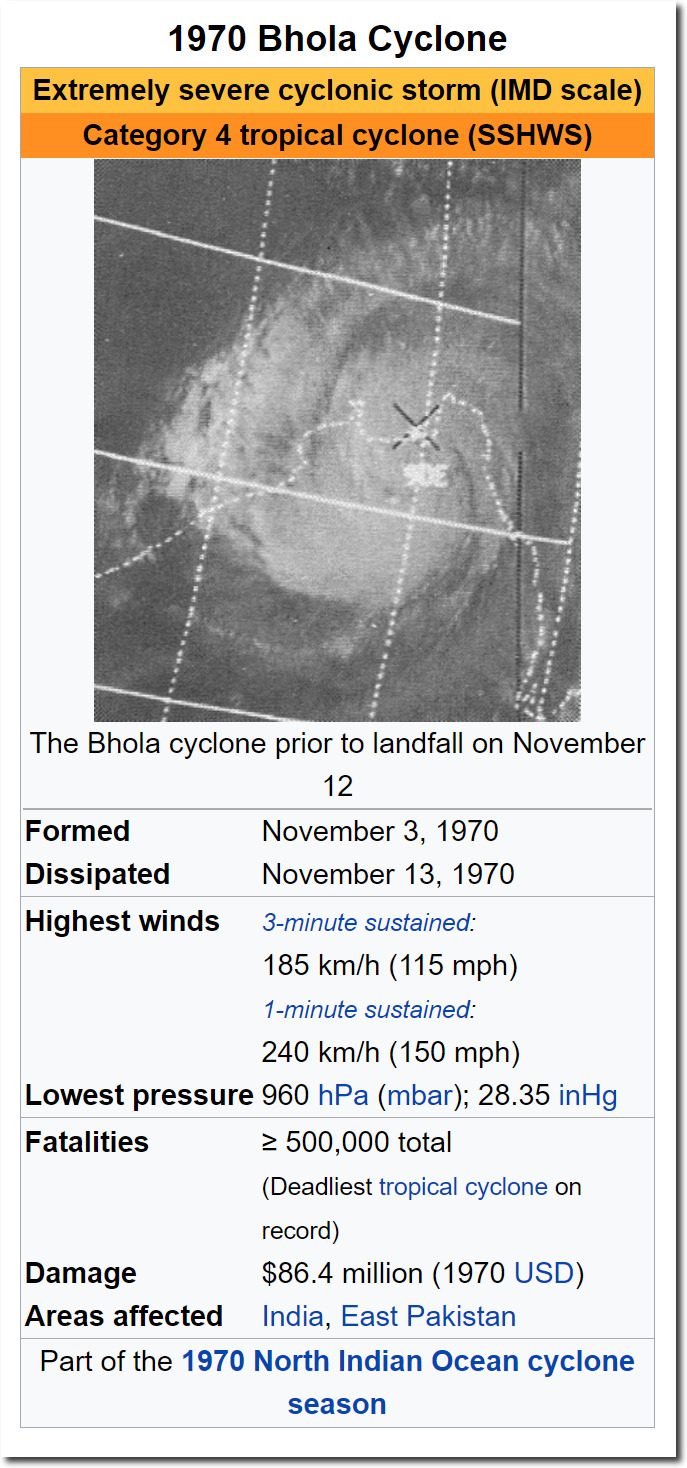
The deadliest cyclone of all occurred in 1970, and killed half a million people.
1970 Bhola cyclone – Wikipedia
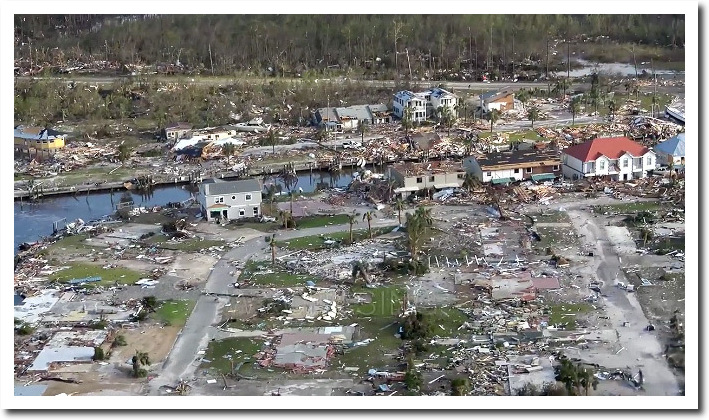
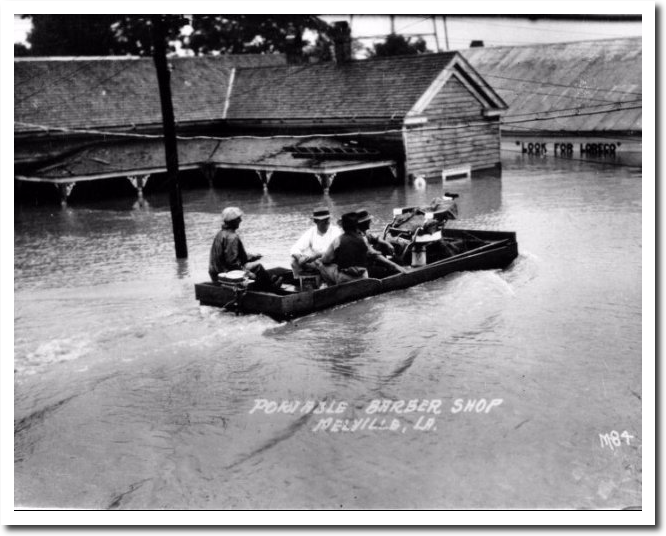
Imagery like this from Florida is shown over and over again on television, and linked to rising carbon dioxide concentrations.
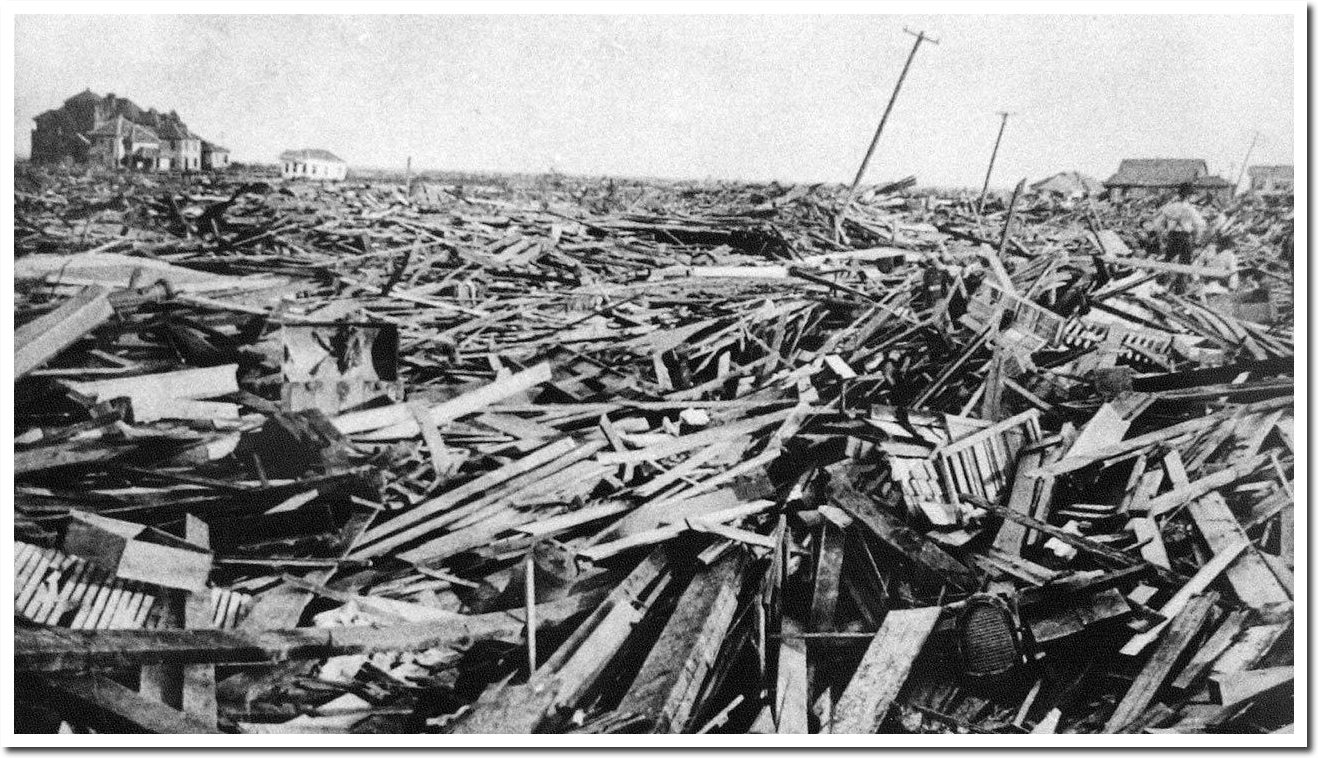
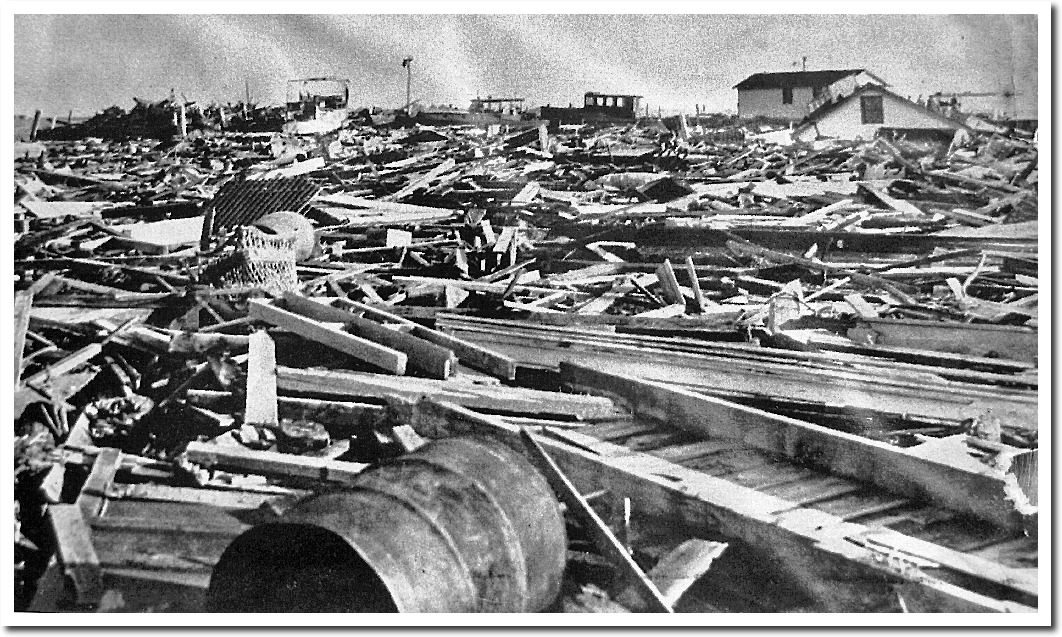
But how many young people know about the 1900 Galveston hurricane, which killed 10,000 people and destroyed the city?
Or the 1926 hurricane, which destroyed Miami?
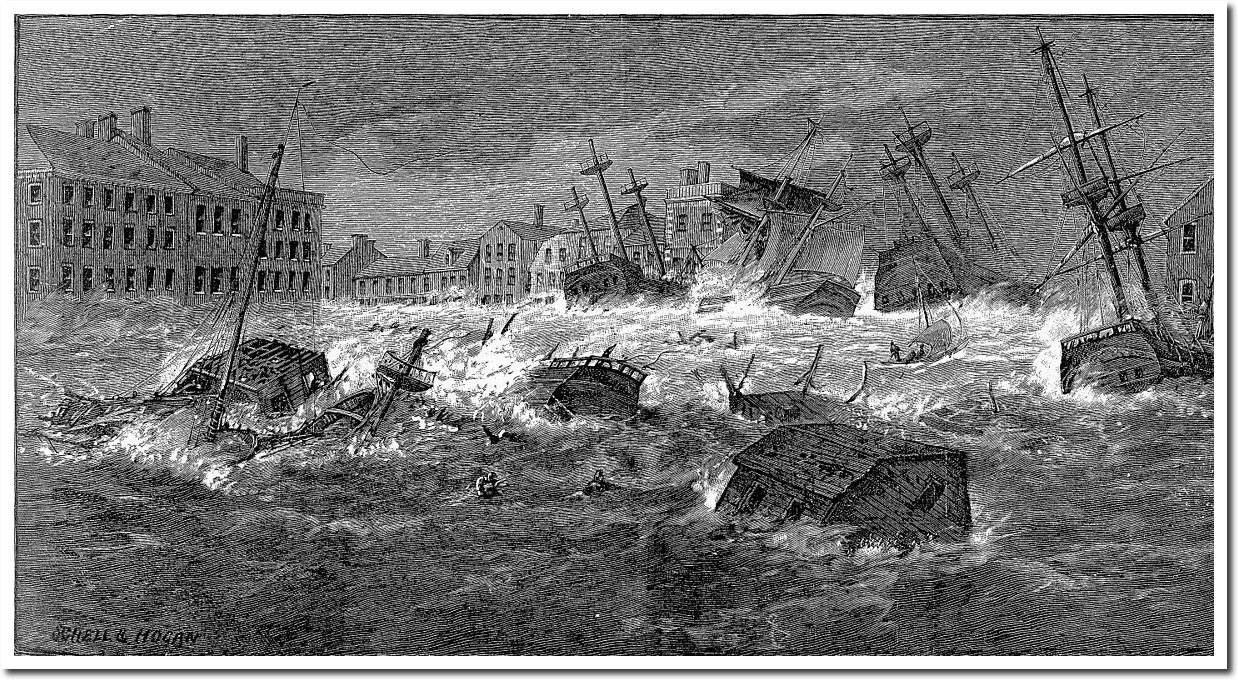
Or the 1815 New England Hurricane?
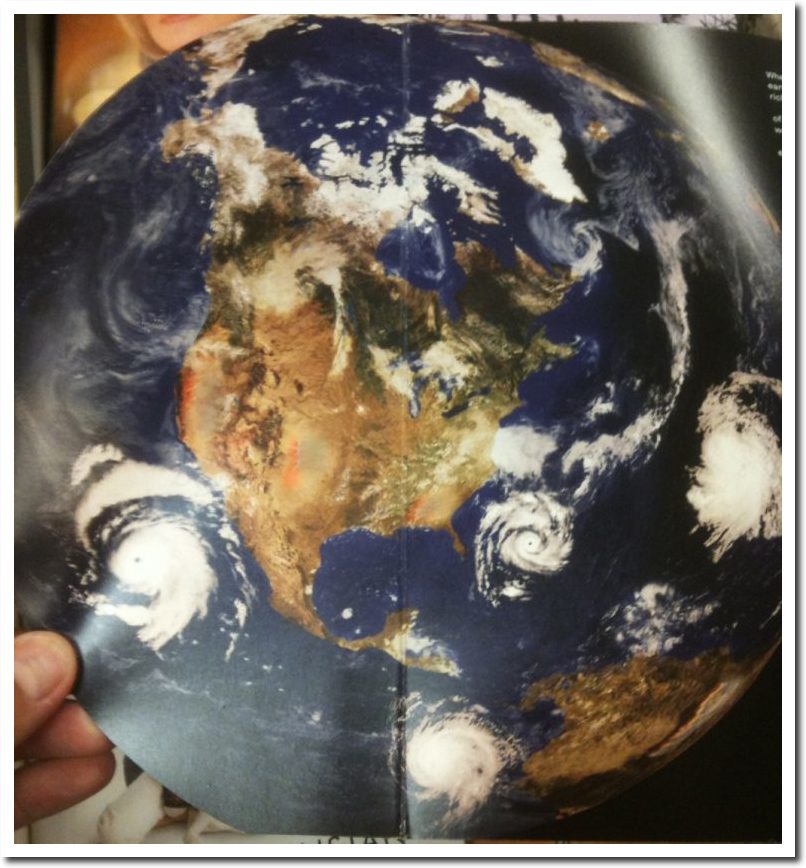
It is safe bet that school children aren’t being taught about this, but are instead being exposed to Nobel laureate Al Gore’s sci-fi flick. Ten years ago, Gore released a book with the satellite imagery below, showing lots of hurricanes including one off the east coast of the United States which was circulating the wrong direction (clockwise) for the Northern Hemisphere. This sort of junk science and fakery is what school children have been taught as science.
Not finding any, Gore airbrushes in hurricanes for his new book | Watts Up With That?
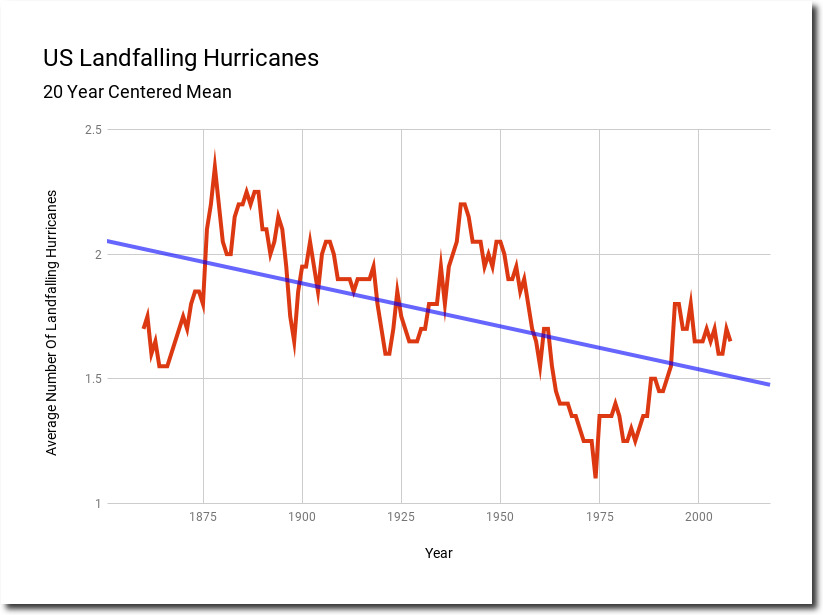
The United States has the best long term hurricane records of any place on Earth, and shows a long term decline in hurricane strikes – down 25% since the 19th century. The peak year was 1886, when the US was hit by seven hurricanes. Four of them hit Texas, and three hit Florida that year.
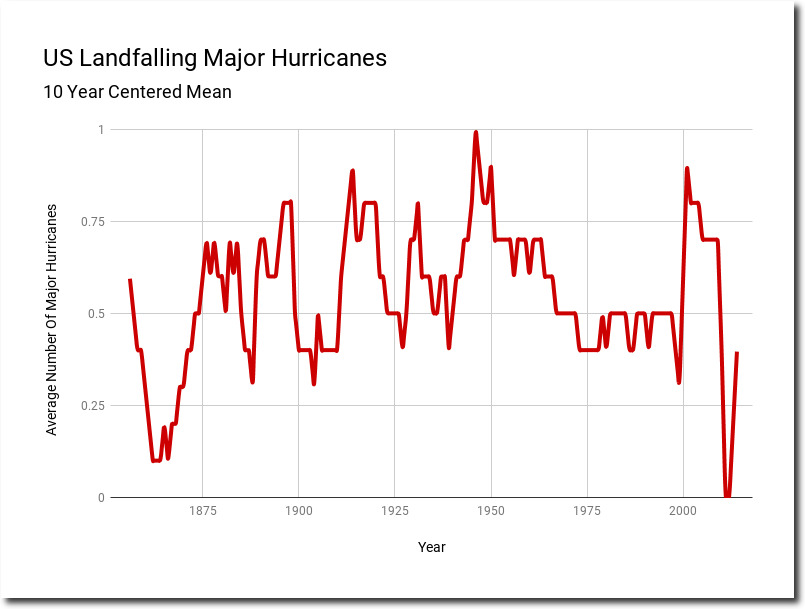
Major hurricanes peaked in the US during the 1940s, and recent years have been the quietest on record.
Spreadsheet Data
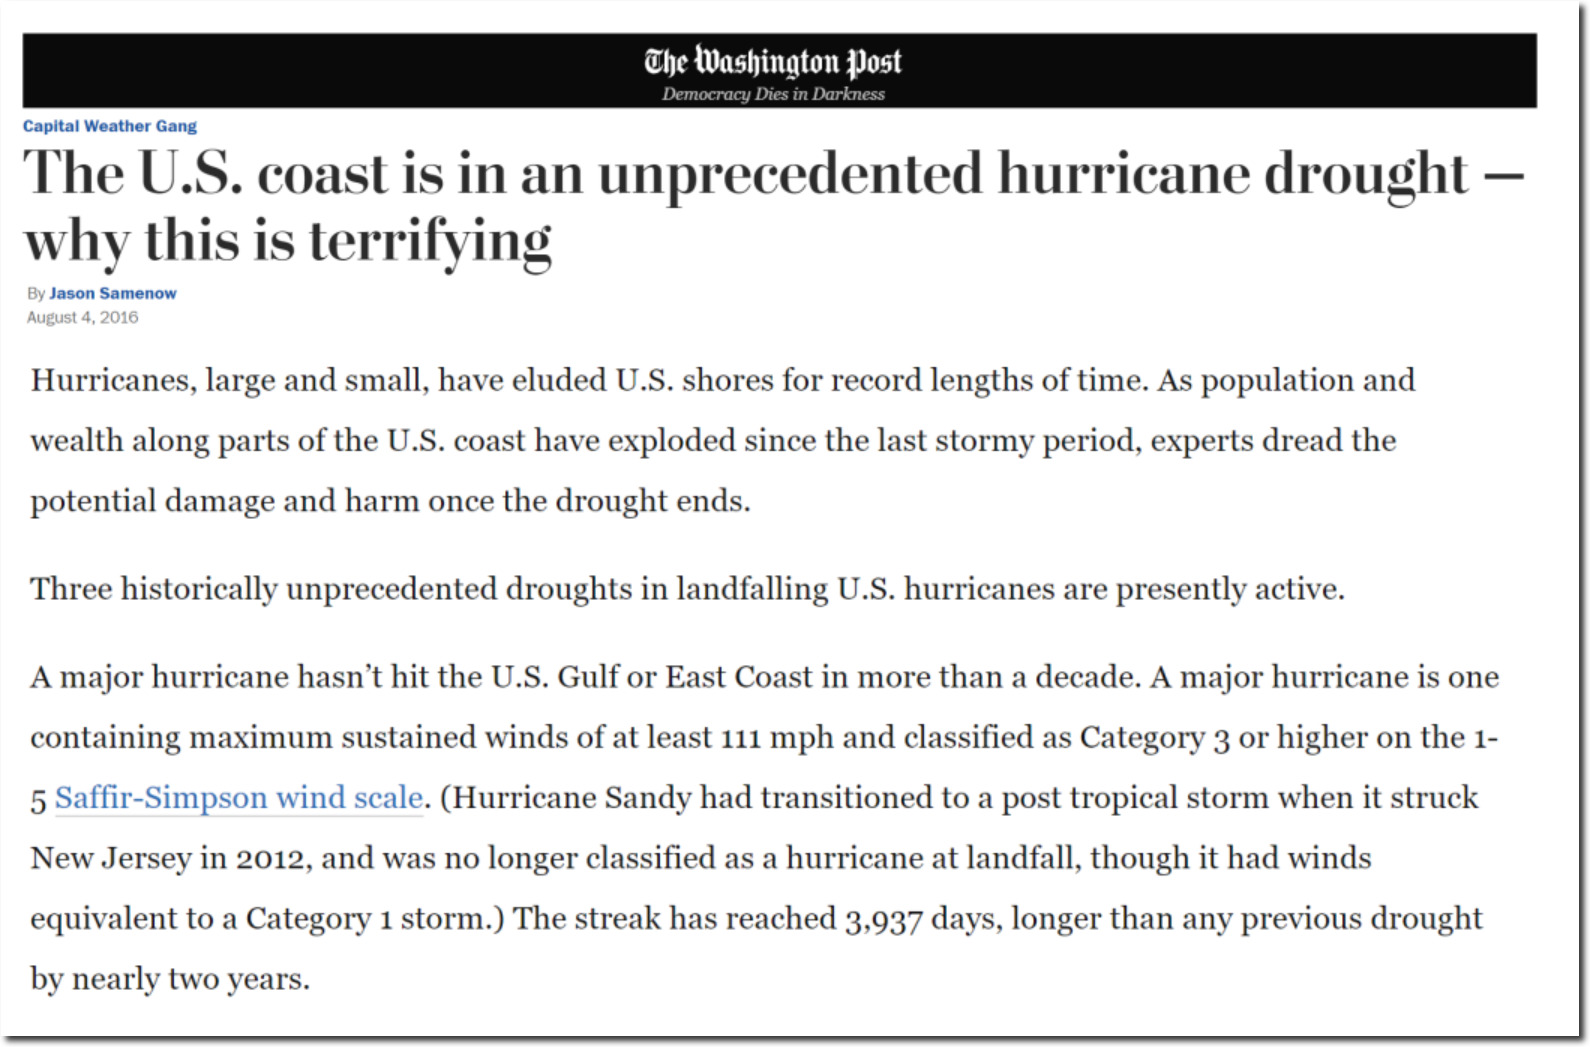
Three years ago, the Washington Post was terrified by the record lack of hurricanes.
There is no evidence hurricanes are getting worse, but what about tornadoes? Last year was the first year with no EF4 or EF5 hurricanes in the US.
Pittsburgh Post-Gazette on Twitter: 2018 will be the first year with no violent tornadoes
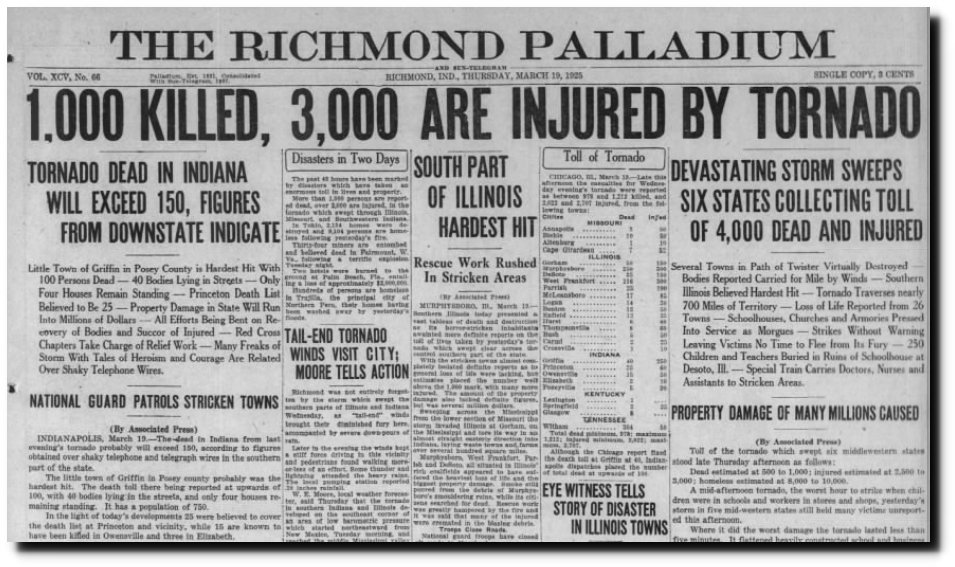
Compare this with 1925, when a single tornado leveled dozens of cities and killed a huge number of people in at least three states.
19 Mar 1925, Page 1 – Palladium-Item at Newspapers.com
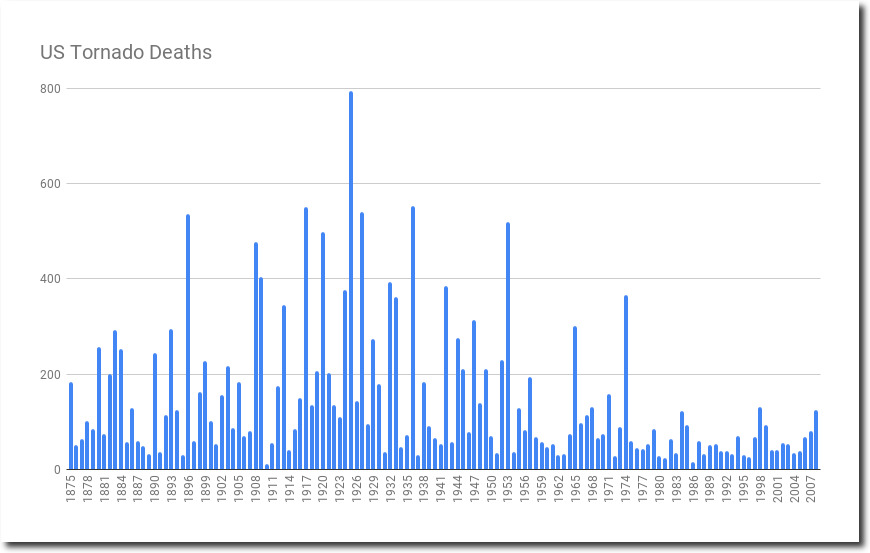
US tornado deaths peaked during the 1920s, and have been declining ever since.
Over the last 70 years, the number of F3-F5 tornadoes has declined.
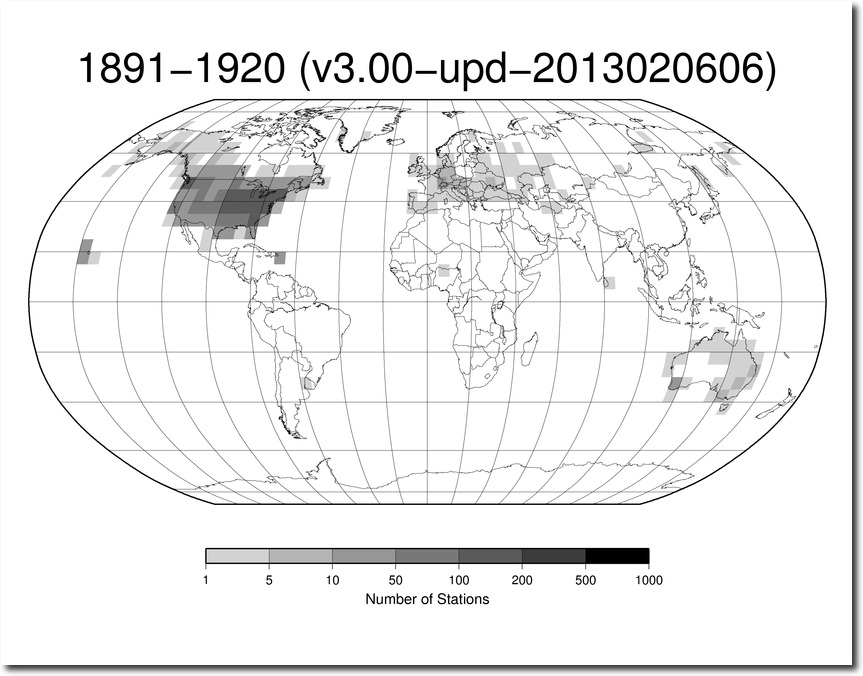
There is no indication tornadoes are getting worse, but what about heatwaves? The United States is the only large area in the world with enough long term daily data to determine heat wave trends. Most of the world has little or no data.
Index of /pub/data/ghcn/daily/figures/
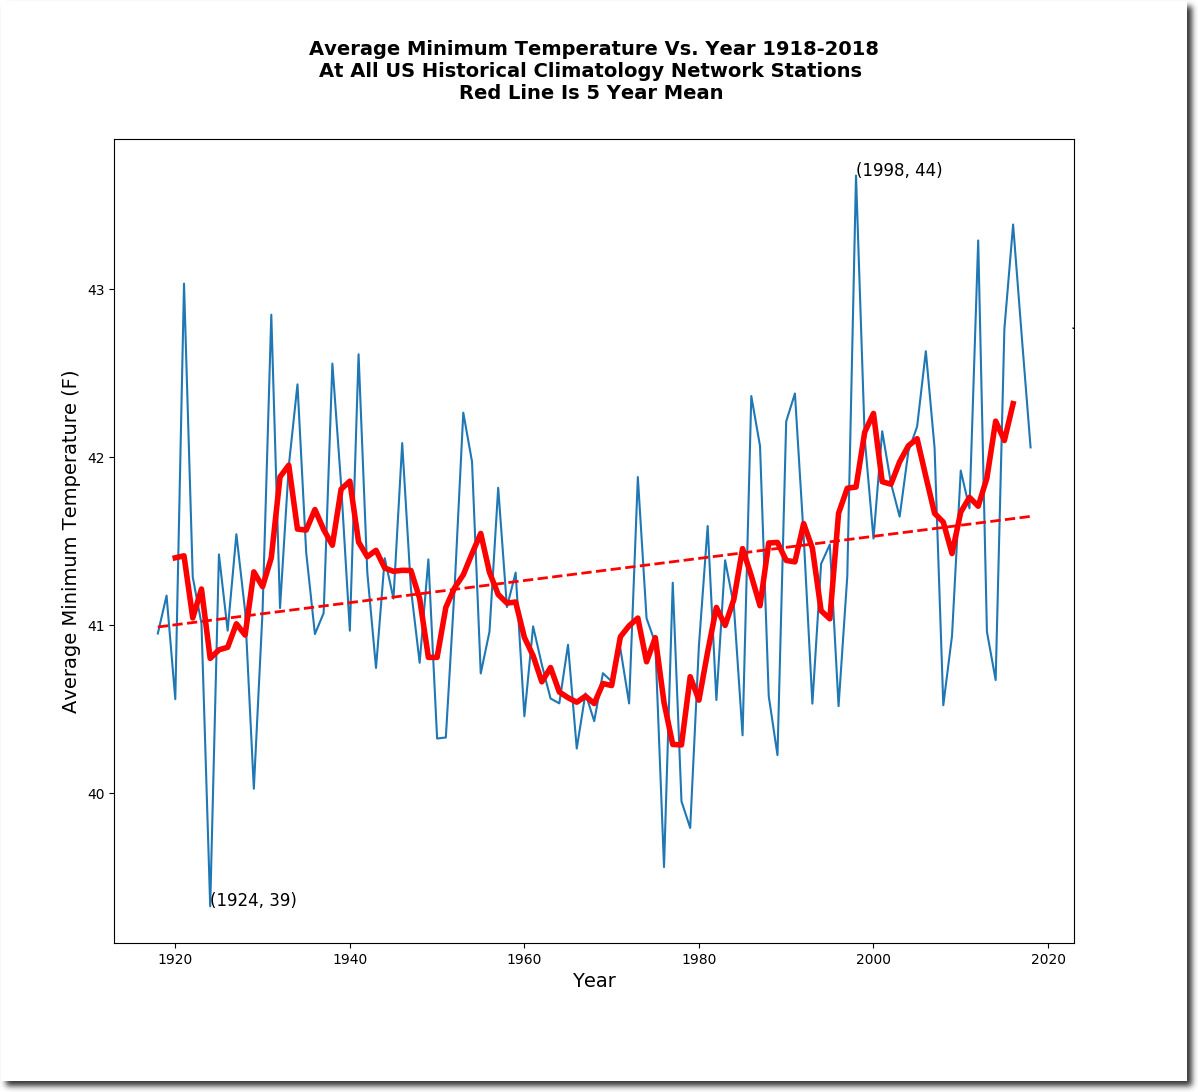
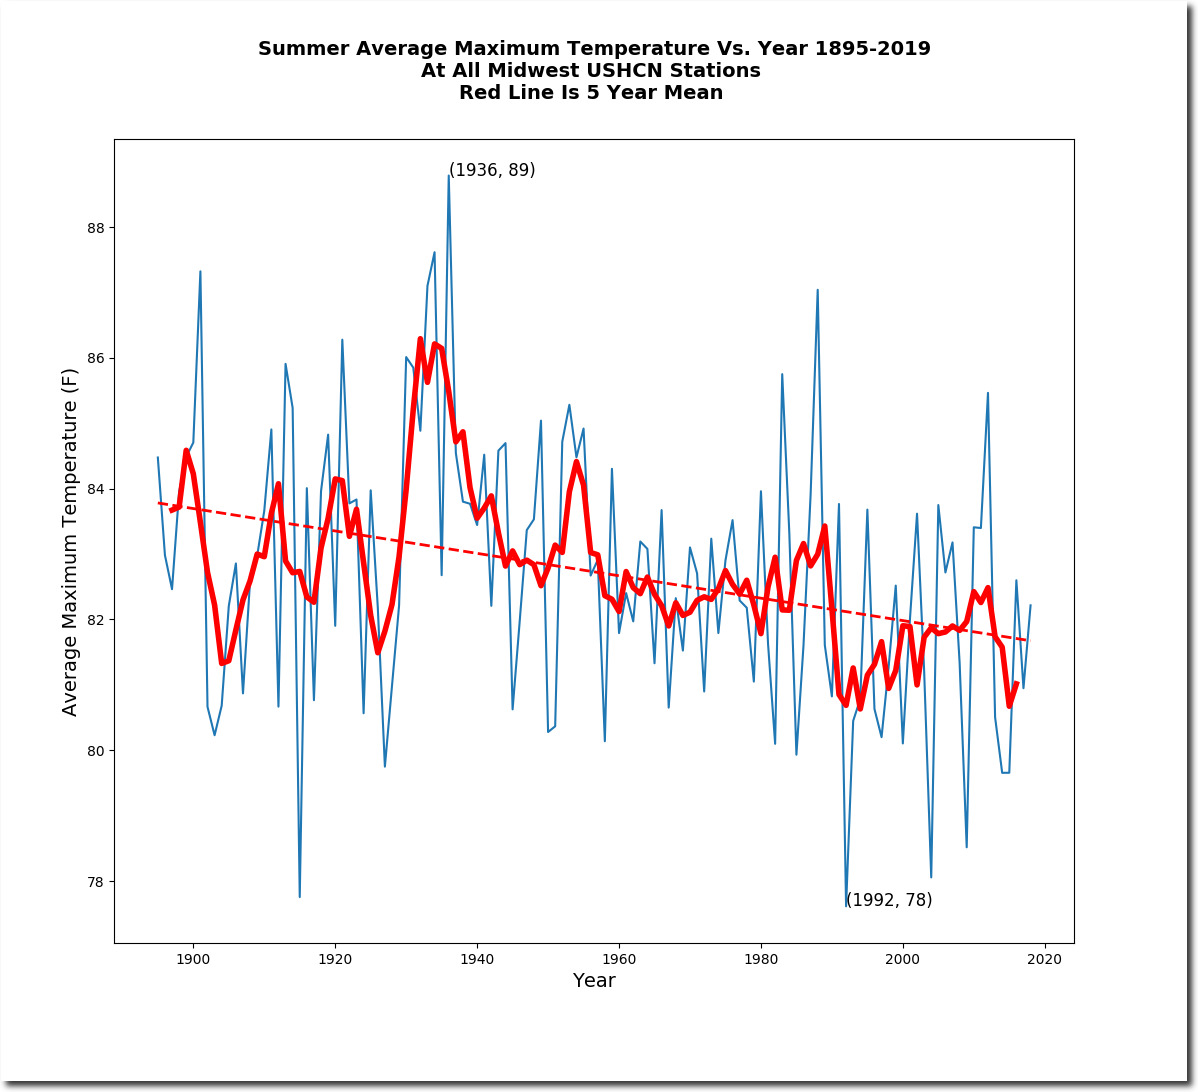
Every indication is that the US climate is becoming less extreme. Before data tampering by NOAA, maximum temperatures are becoming less extreme.
Minimum temperatures are also becoming less extreme.
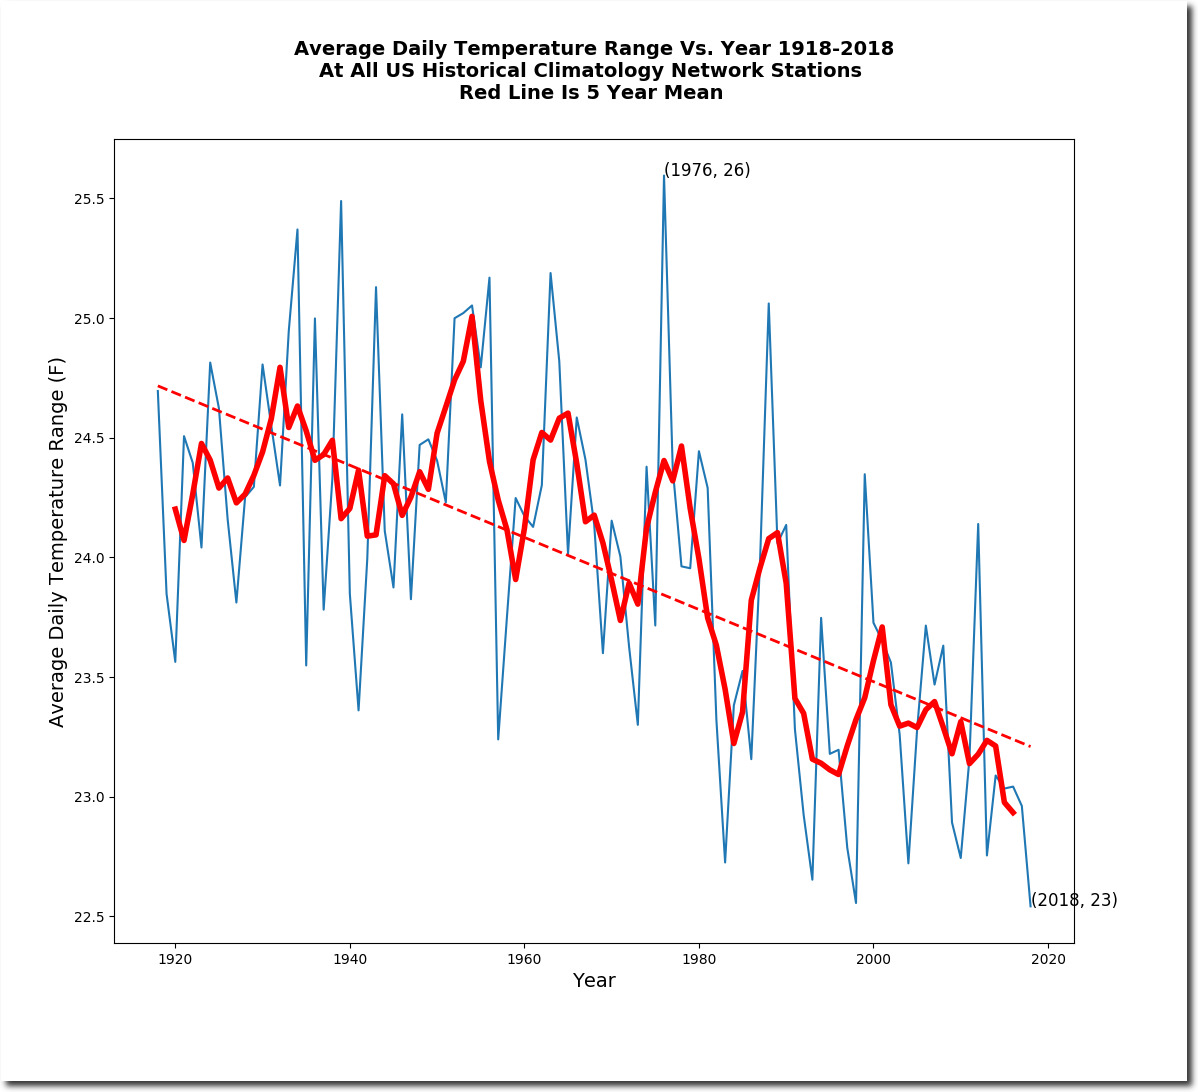
The average daily temperature range is becoming less extreme.
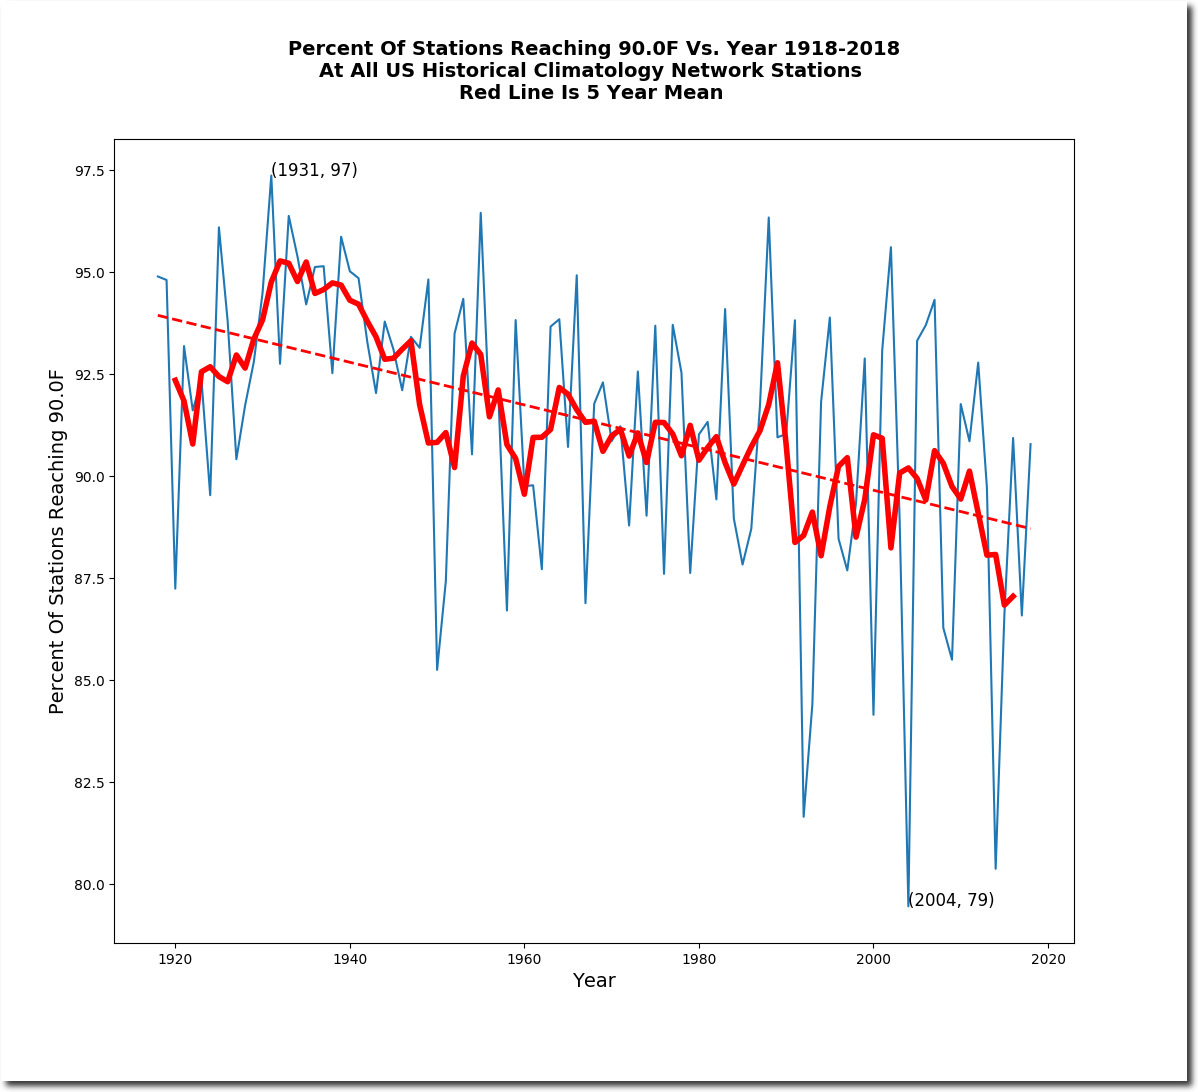
The percentage of stations reaching 90F (32C) sometime during the year is becoming smaller.
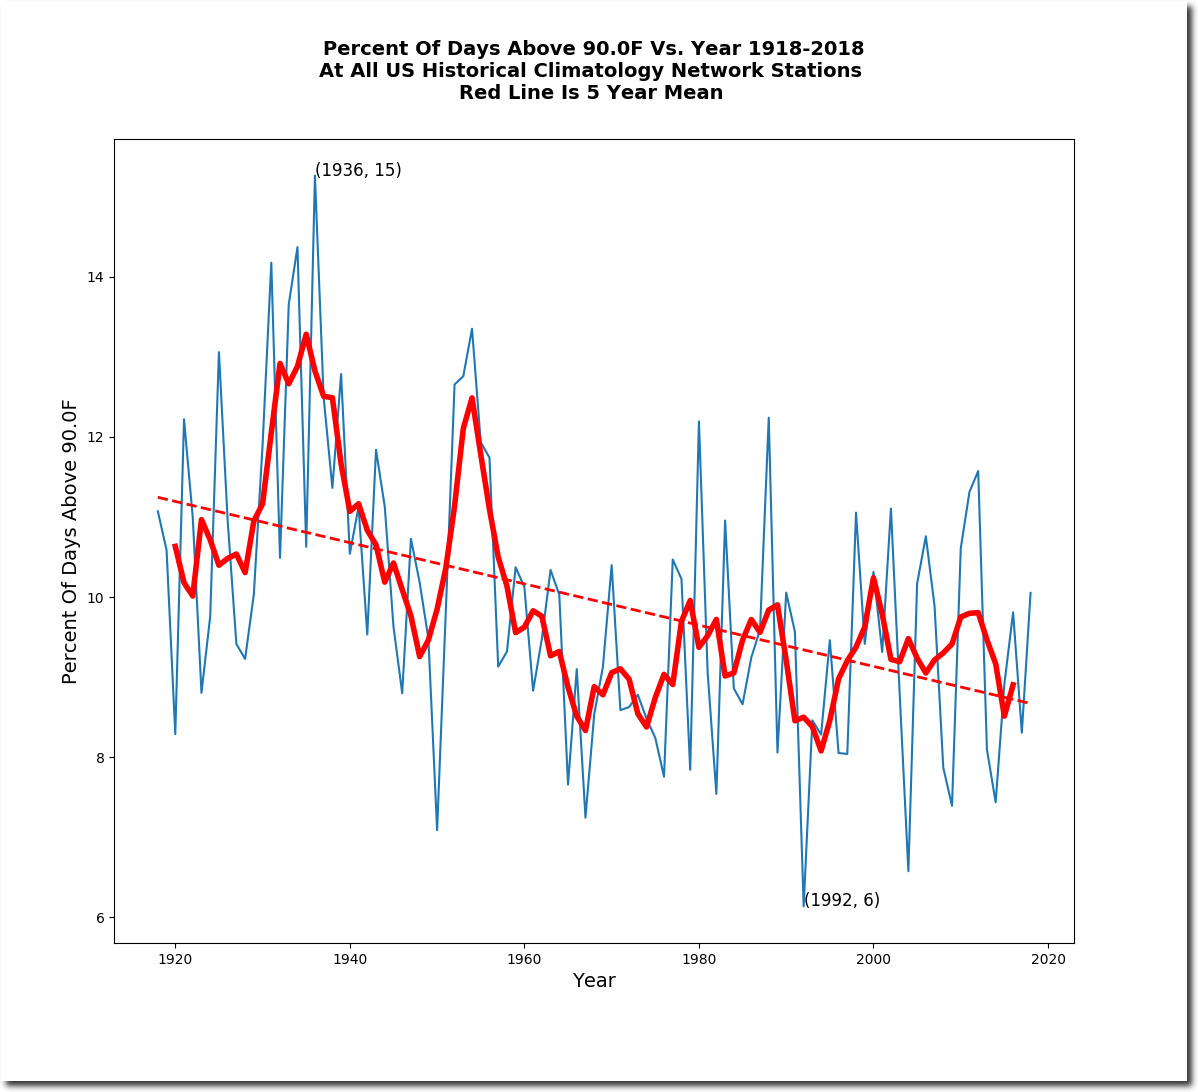
The percent of hot days is becoming smaller.
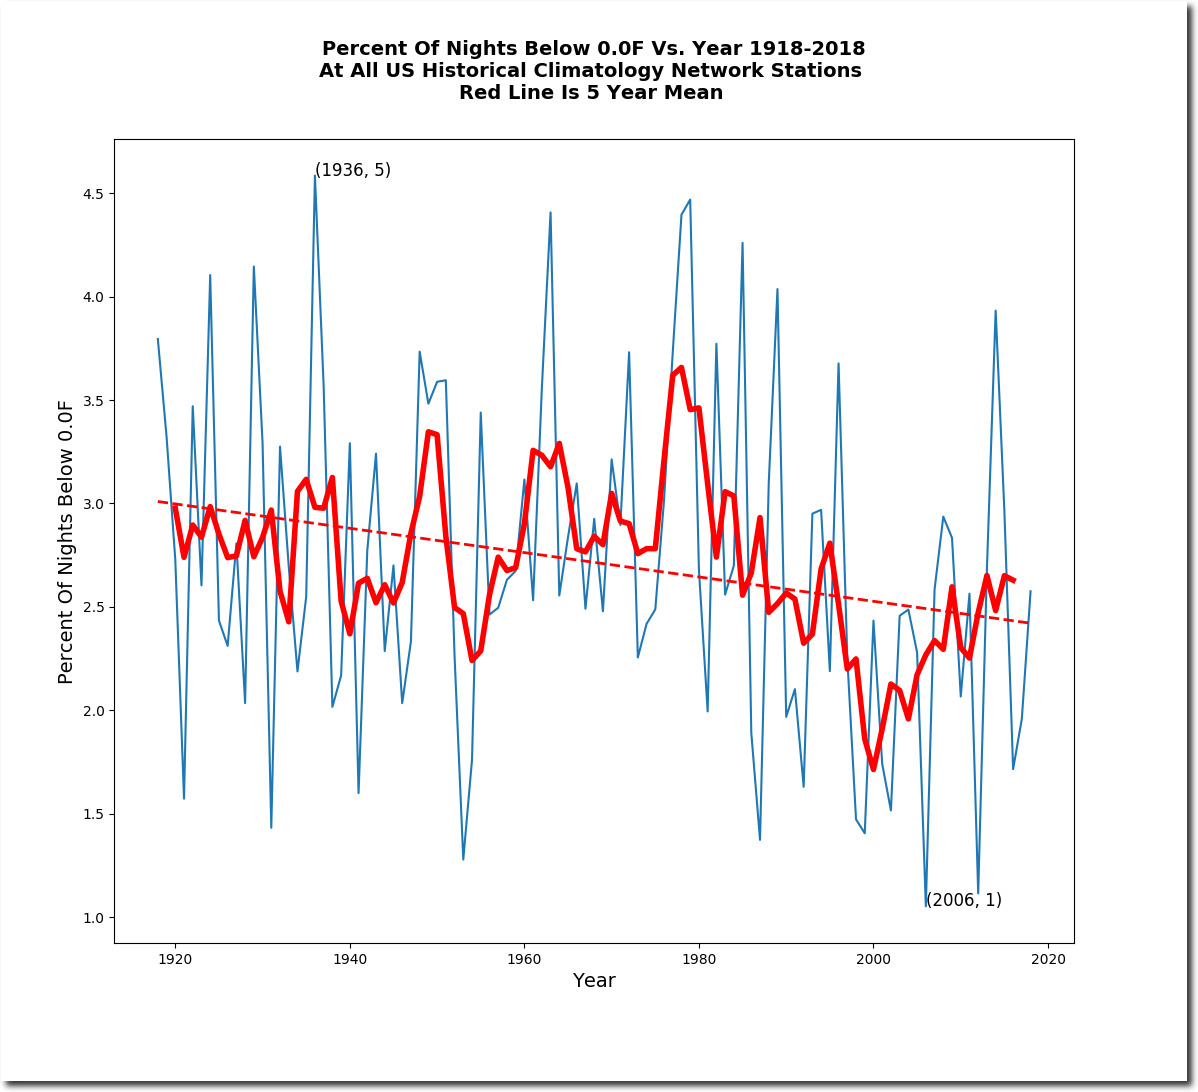
The percent of cold nights is becoming smaller.
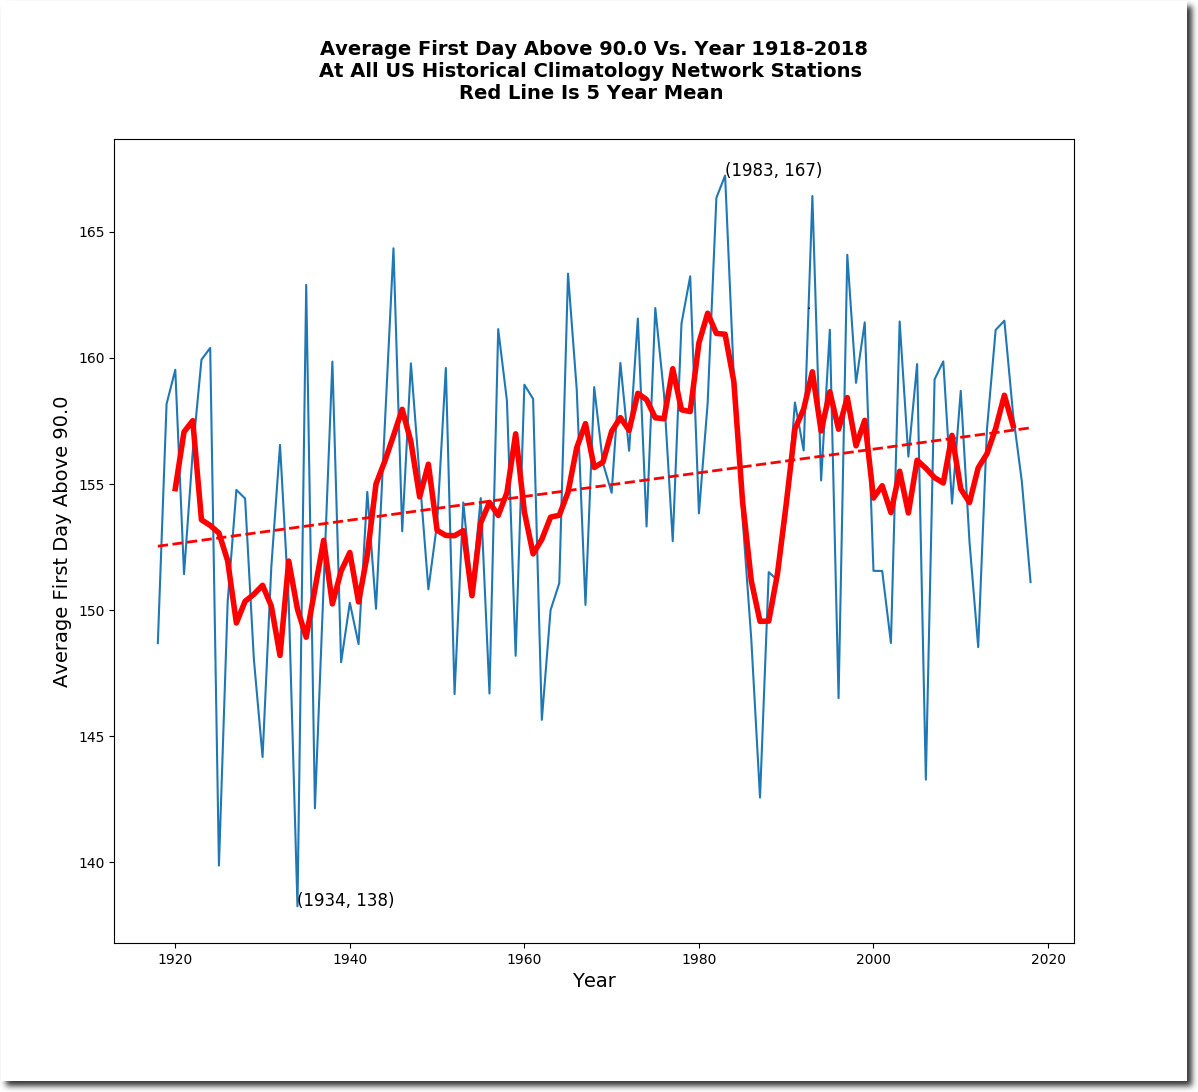
The first hot day is coming later.
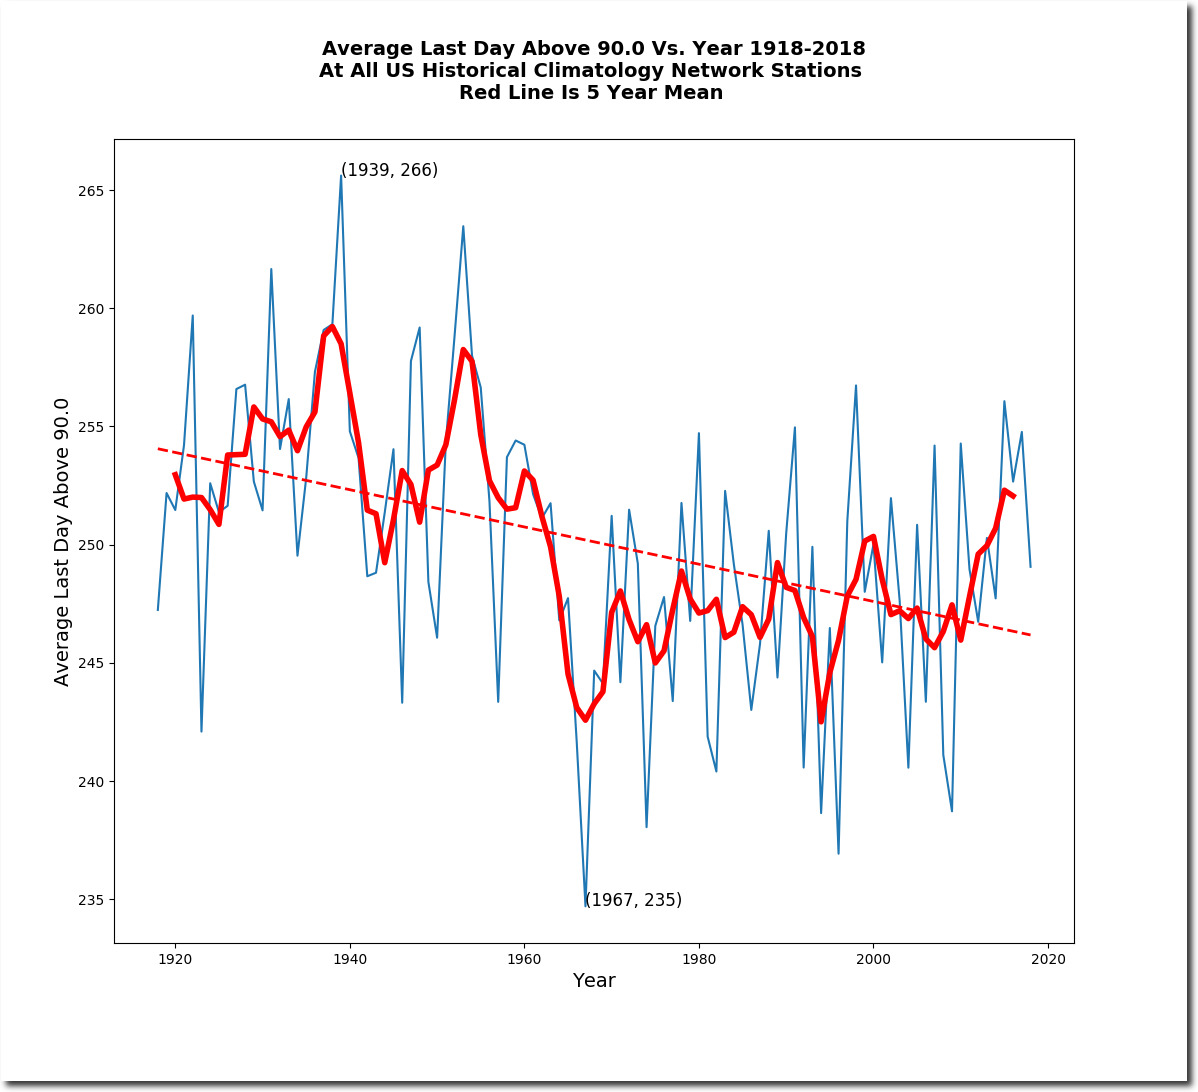
The last hot day is coming earlier.
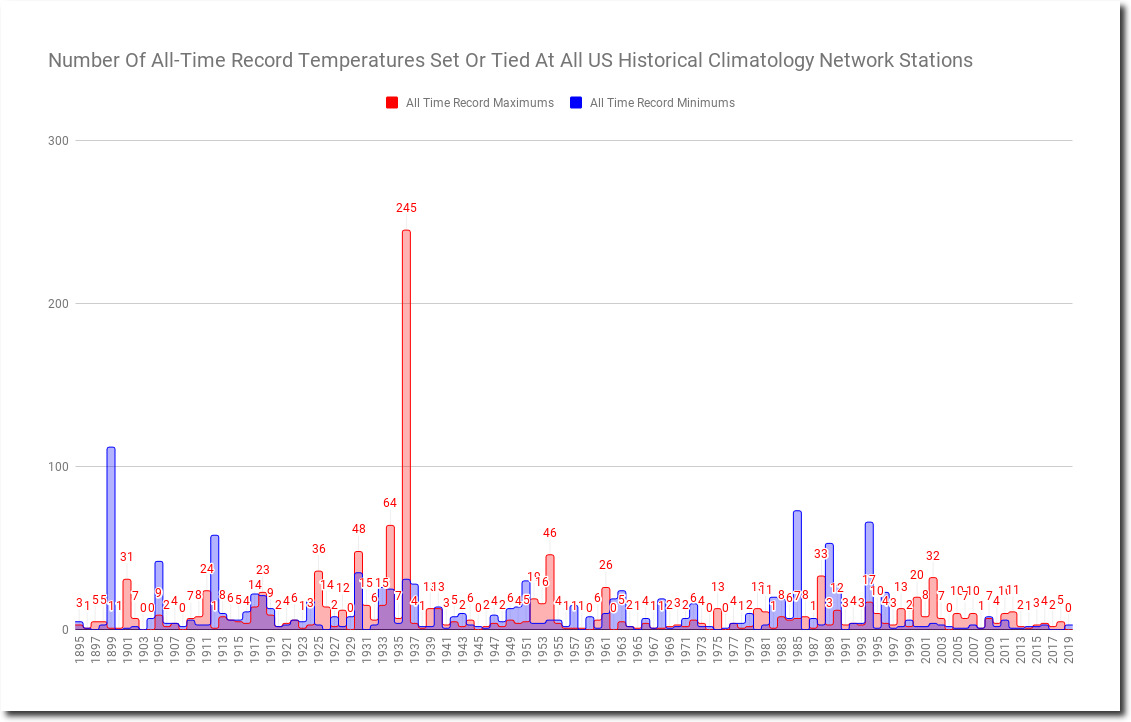
The number of all time record maximum and minimum temperatures being set in the US has been at a record low in recent years.
Every indicator shows that US temperatures are becoming less extreme, with less extreme heat and less extreme cold.
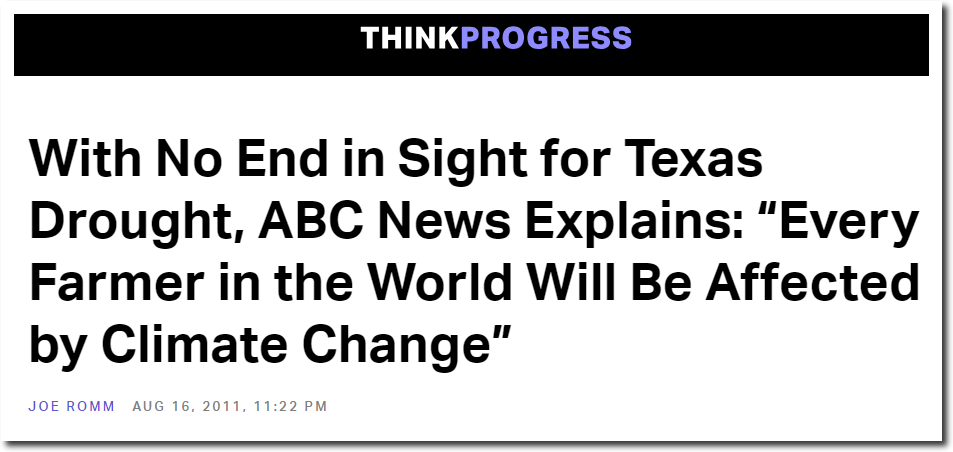
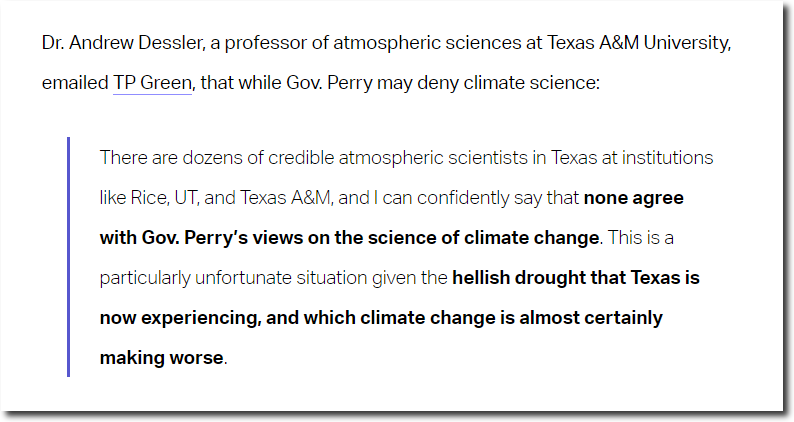
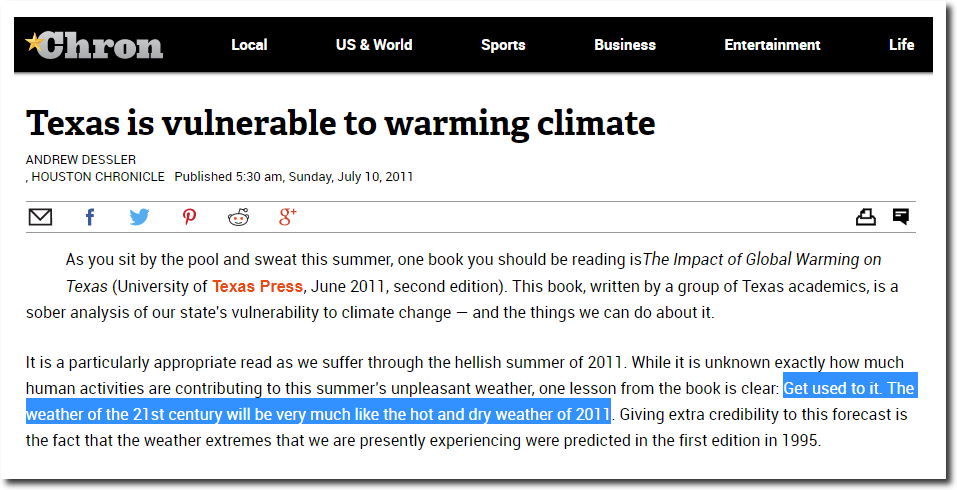
What about drought? Eight years ago during a severe Texas drought, the state’s leading climate experts announced that Texas would be hot and dry for the rest of the century, and they ridiculed Governor Rick Perry for pointing out the obvious – the rains would return.
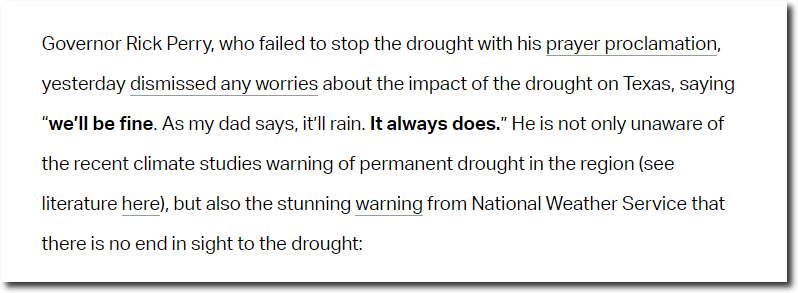
“we’ll be fine. As my dad says, it’ll rain. It always does.”
– Texas Governor Rick Perry Summer, 2011
This is how climate alarmists predictably reacted to Governor Perry’s statement.
“The weather of the 21st century will be very much like the hot and dry weather of 2011. Giving extra credibility to this forecast is the fact that the weather extremes that we are presently experiencing were predicted in the first edition in 1995.”
– Texas leading climate experts 2011
Texas is vulnerable to warming climate – Houston Chronicle
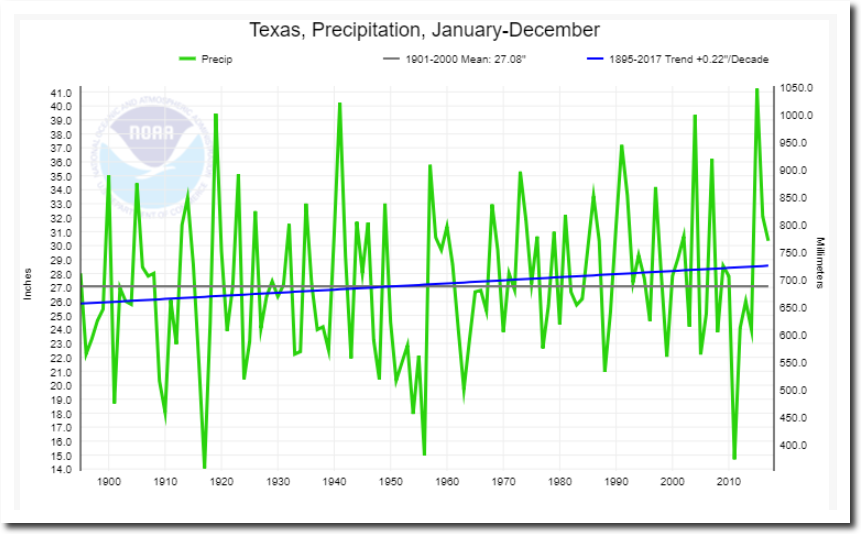
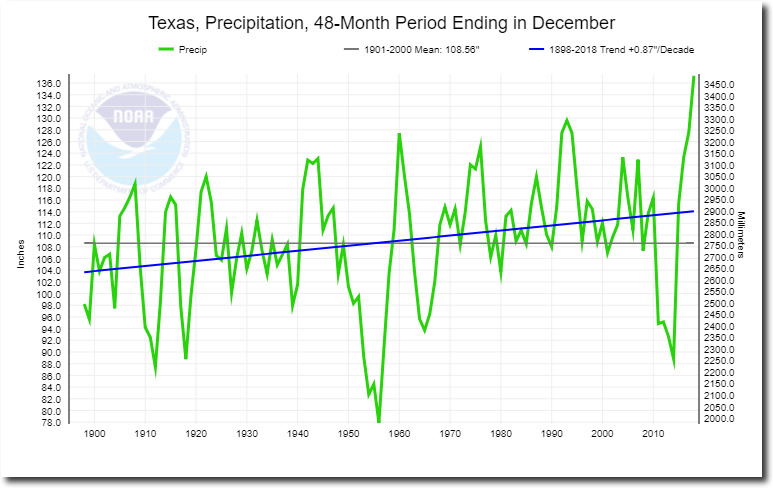
But Rick Perry was correct, and the academic experts were wrong. Since 2011, Texas has been having some of their wettest years on record. The rains did return, and the climate academics once again demonstrated that they are a combination of ambulance chasers and snake oil salesmen. Drought is always followed by wet periods.
Climate at a Glance | National Centers for Environmental Information (NCEI)
Climate at a Glance | National Centers for Environmental Information (NCEI)
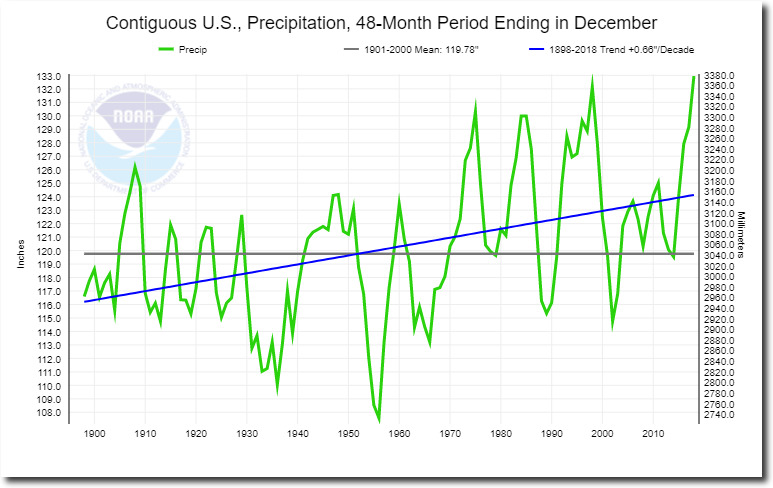
Same thing is true for the entire US, which has been getting wetter since the 19th century.
Climate at a Glance | National Centers for Environmental Information (NCEI)
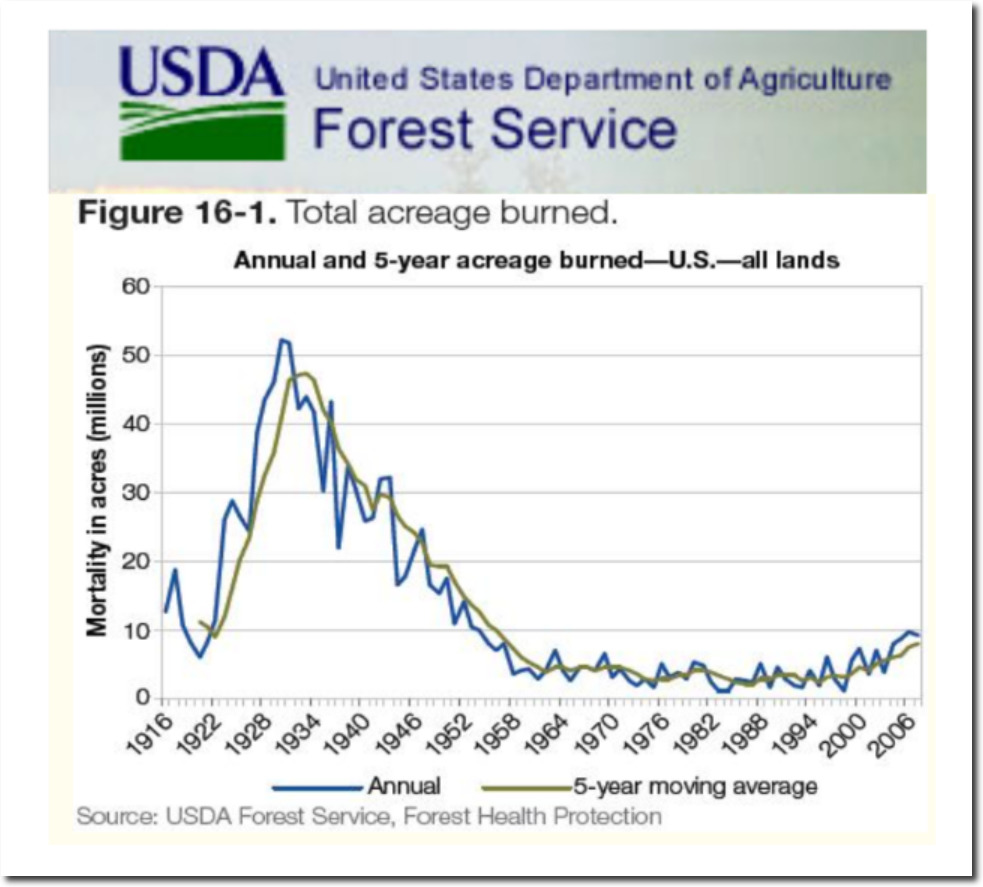
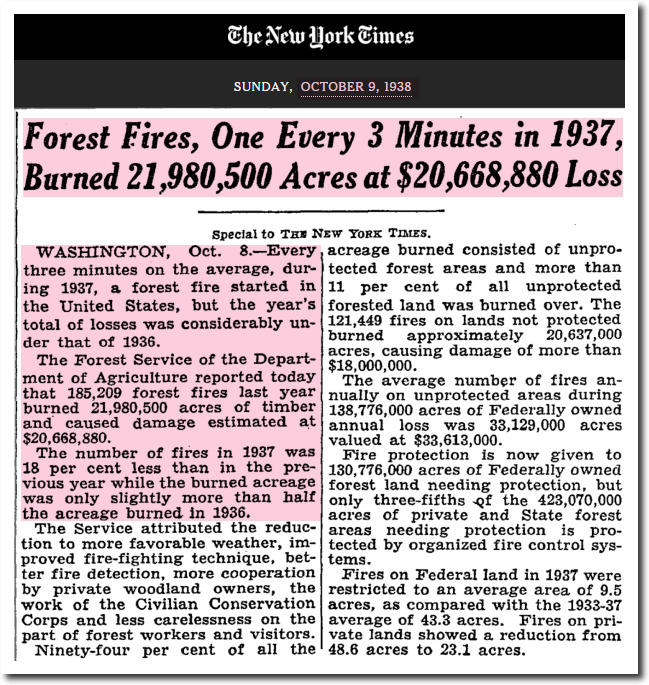
How about fires? Burn acreage in the US has plummeted over the past 90 years.
Indicator 3.16: Area and percent of forest affected by abiotic agents
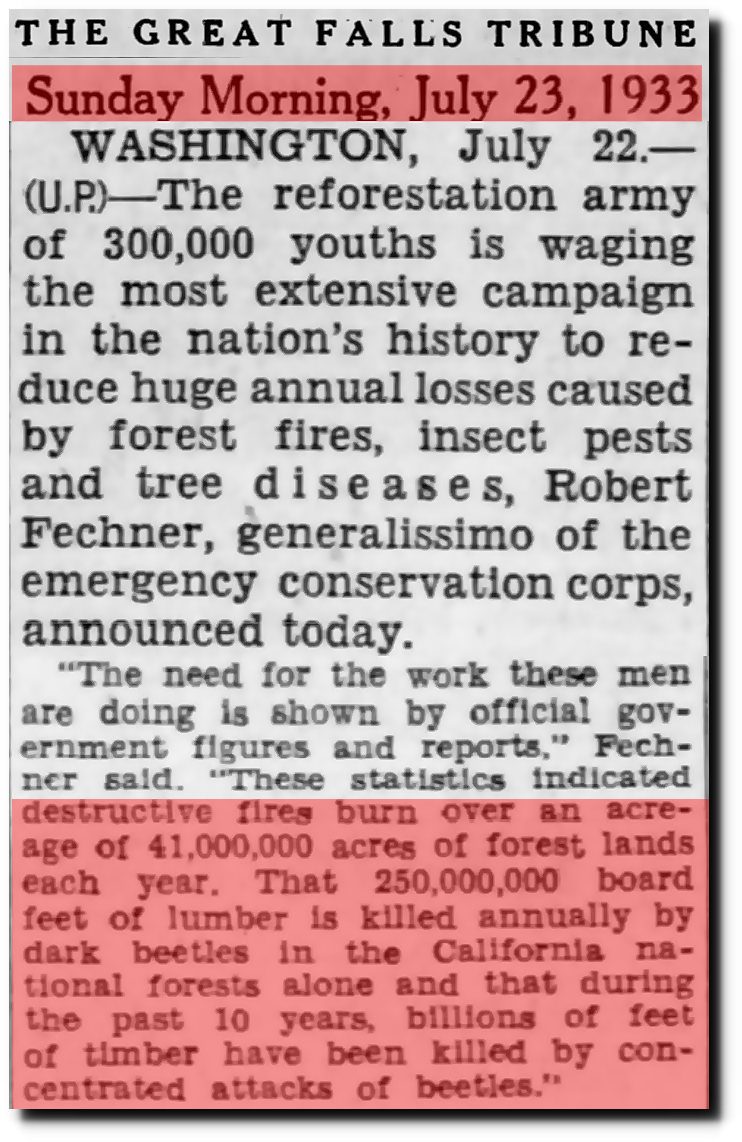
23 Jul 1933, Page 12 – Great Falls Tribune at Newspapers.com
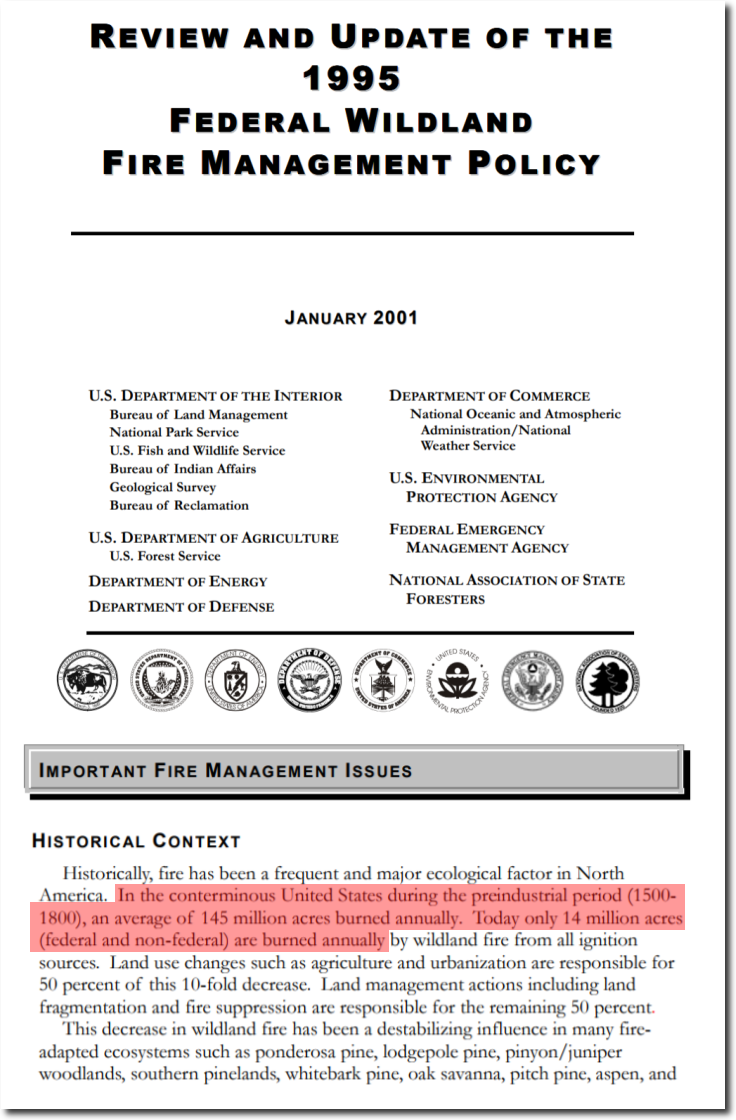
And forest fires are down 90% since CO2 was at pre-industrial levels – when an area larger than the state of California burned (on average) every year.
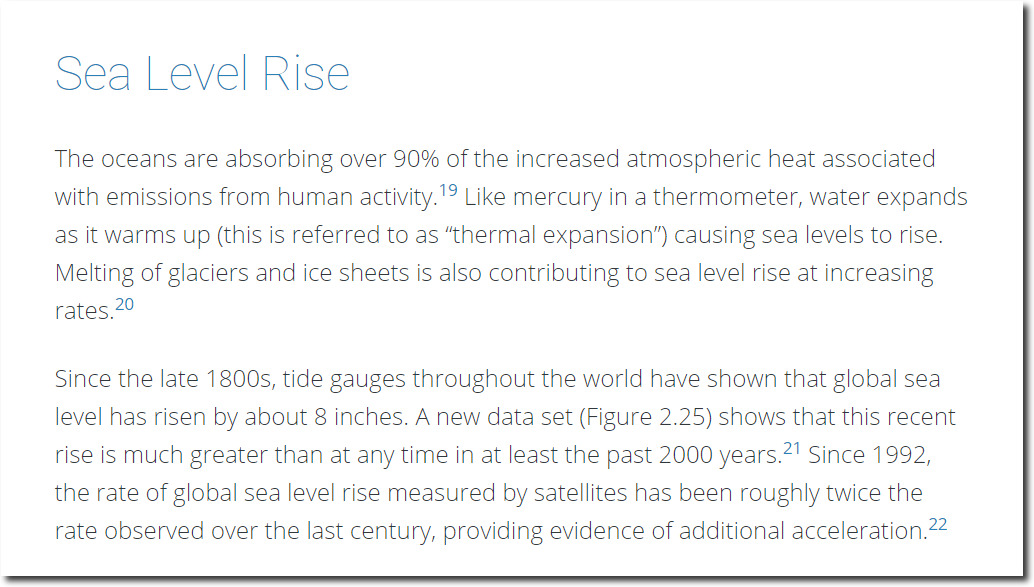
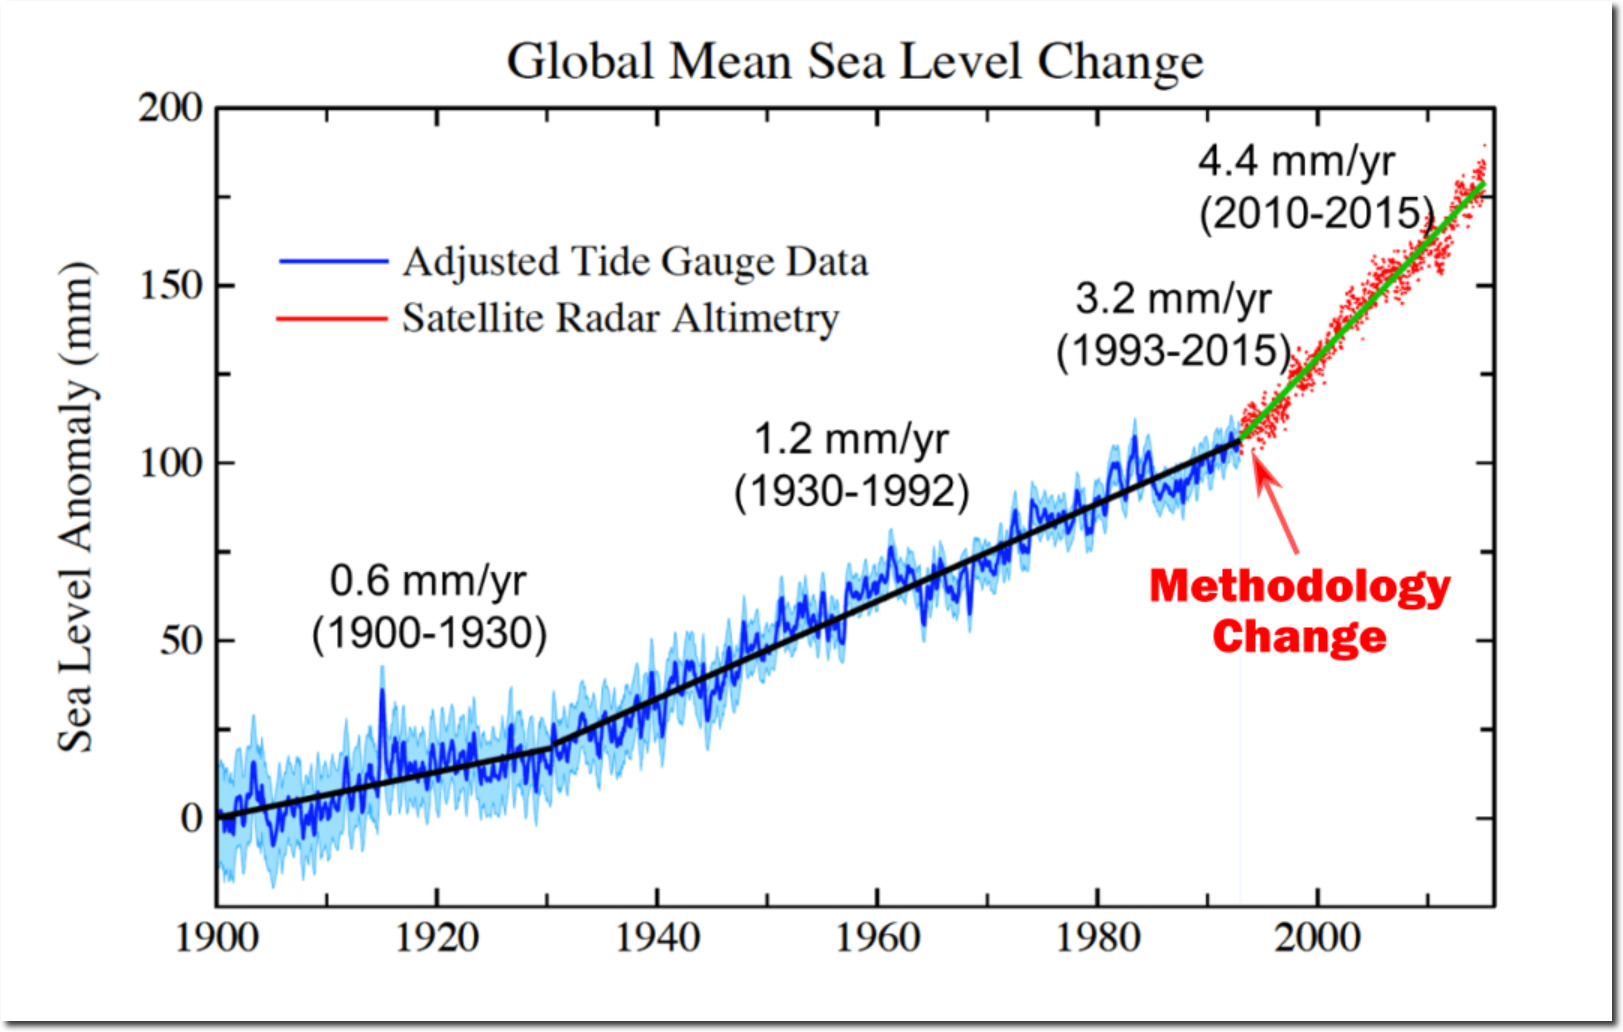
Forest fire burn acreage is down 90% since CO2 was below 280 PPM. What about sea level rise rates? The National Climate Assessment claims that sea level rise rates suddenly doubled, when they switched methodology from tide gauges to satellites in 1992.
Sea Level Rise | National Climate Assessment
No serious scientist would make an apples to oranges comparison like that, but these are climate scientists – not real scientists. I wrote up the incredible fraud behind this junk science here.
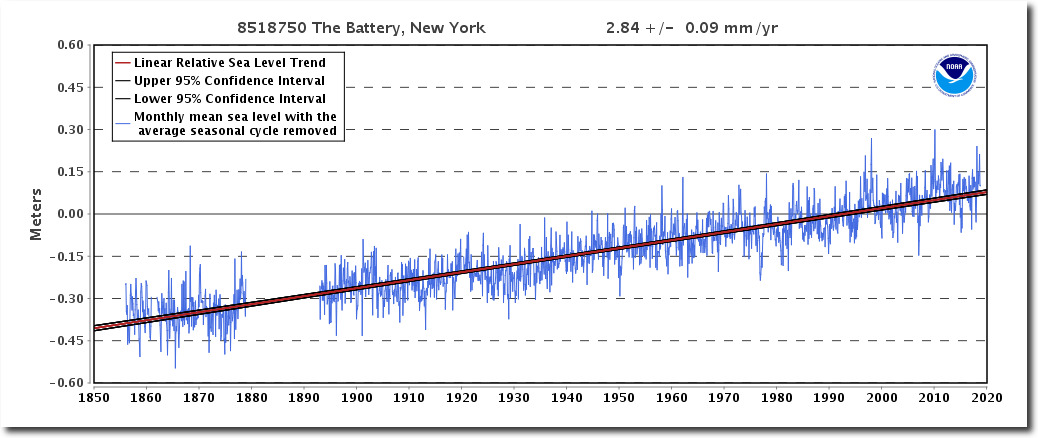
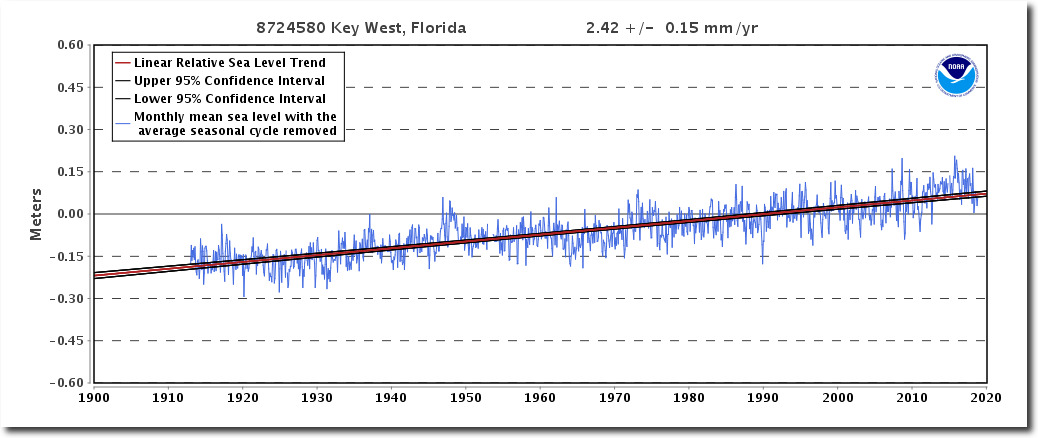
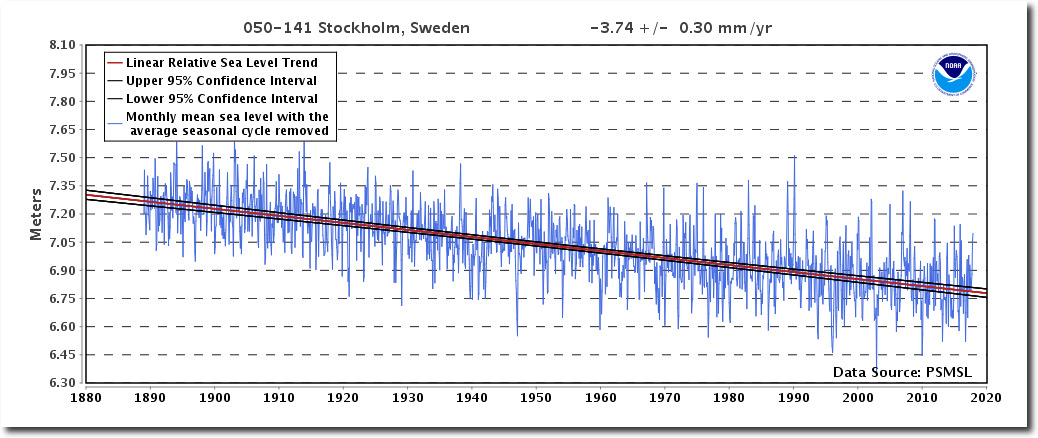
Tide gauges show no change in the rate of sea level rise over the past century. If there was an increase in the rate of sea level rise, it would be visible as an upwards curvature in the graphs below.
Sea Level Trends – NOAA Tides & Currents
Sea Level Trends – NOAA Tides & Currents
Sea Level Trends – NOAA Tides & Currents
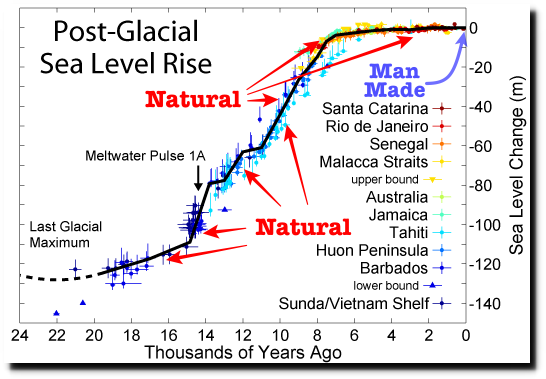
The reality is that sea level rise rates are much lower now than for most of the past 20,000 years.
File:Post-Glacial Sea Level.png – Wikimedia Commons
I could spend weeks writing up the historical evidence indicating a decline in extreme weather, but that would not be the most efficient use of time. Instead, let’s look at a a few of the worst disasters during a period of time when the weather was really extreme – 1925-1938.
As I mentioned earlier, the deadliest tornado in US history struck in 1925.
19 Mar 1925, Page 1 – Palladium-Item at Newspapers.com
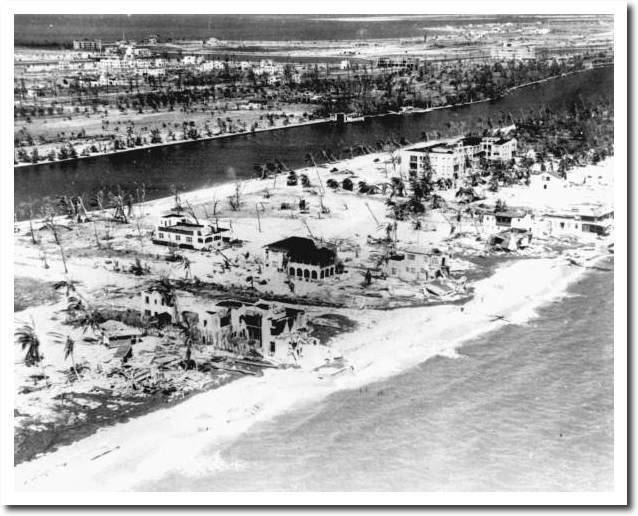
The following year, Miami was destroyed by a hurricane.
The next year, 1927, was described by the Red Cross as “the worst year in their history.”
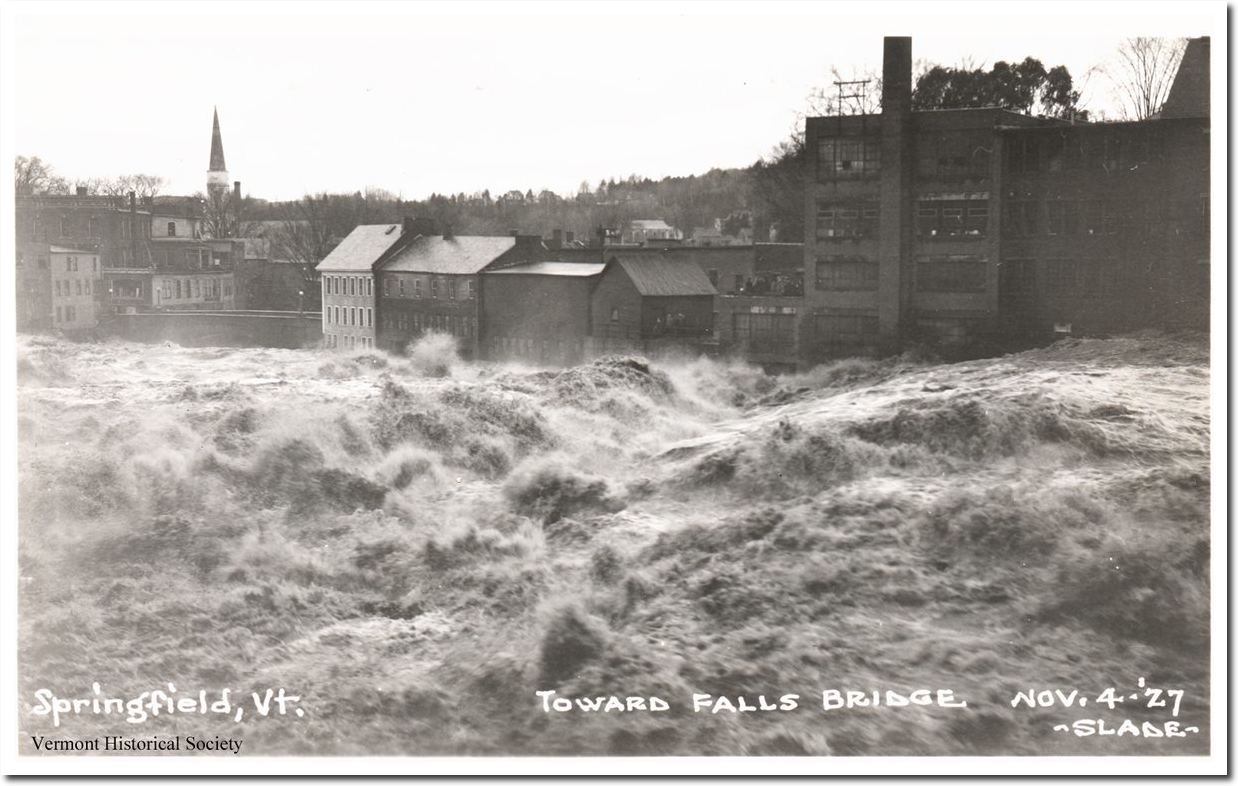
The worst floods in US history occurred in 1927. The Mississippi River was flooded for more than six months, forcing hundreds of thousands of people to abandon their homes permanently. Vermont’s worst flood on record occurred in November, 1927. The Red Cross listed 111 disasters – including 29 tornadoes, 24 floods, 9 hurricanes and 23 fires.
25 Nov 1927, Page 7 – The News-Review at Newspapers.com
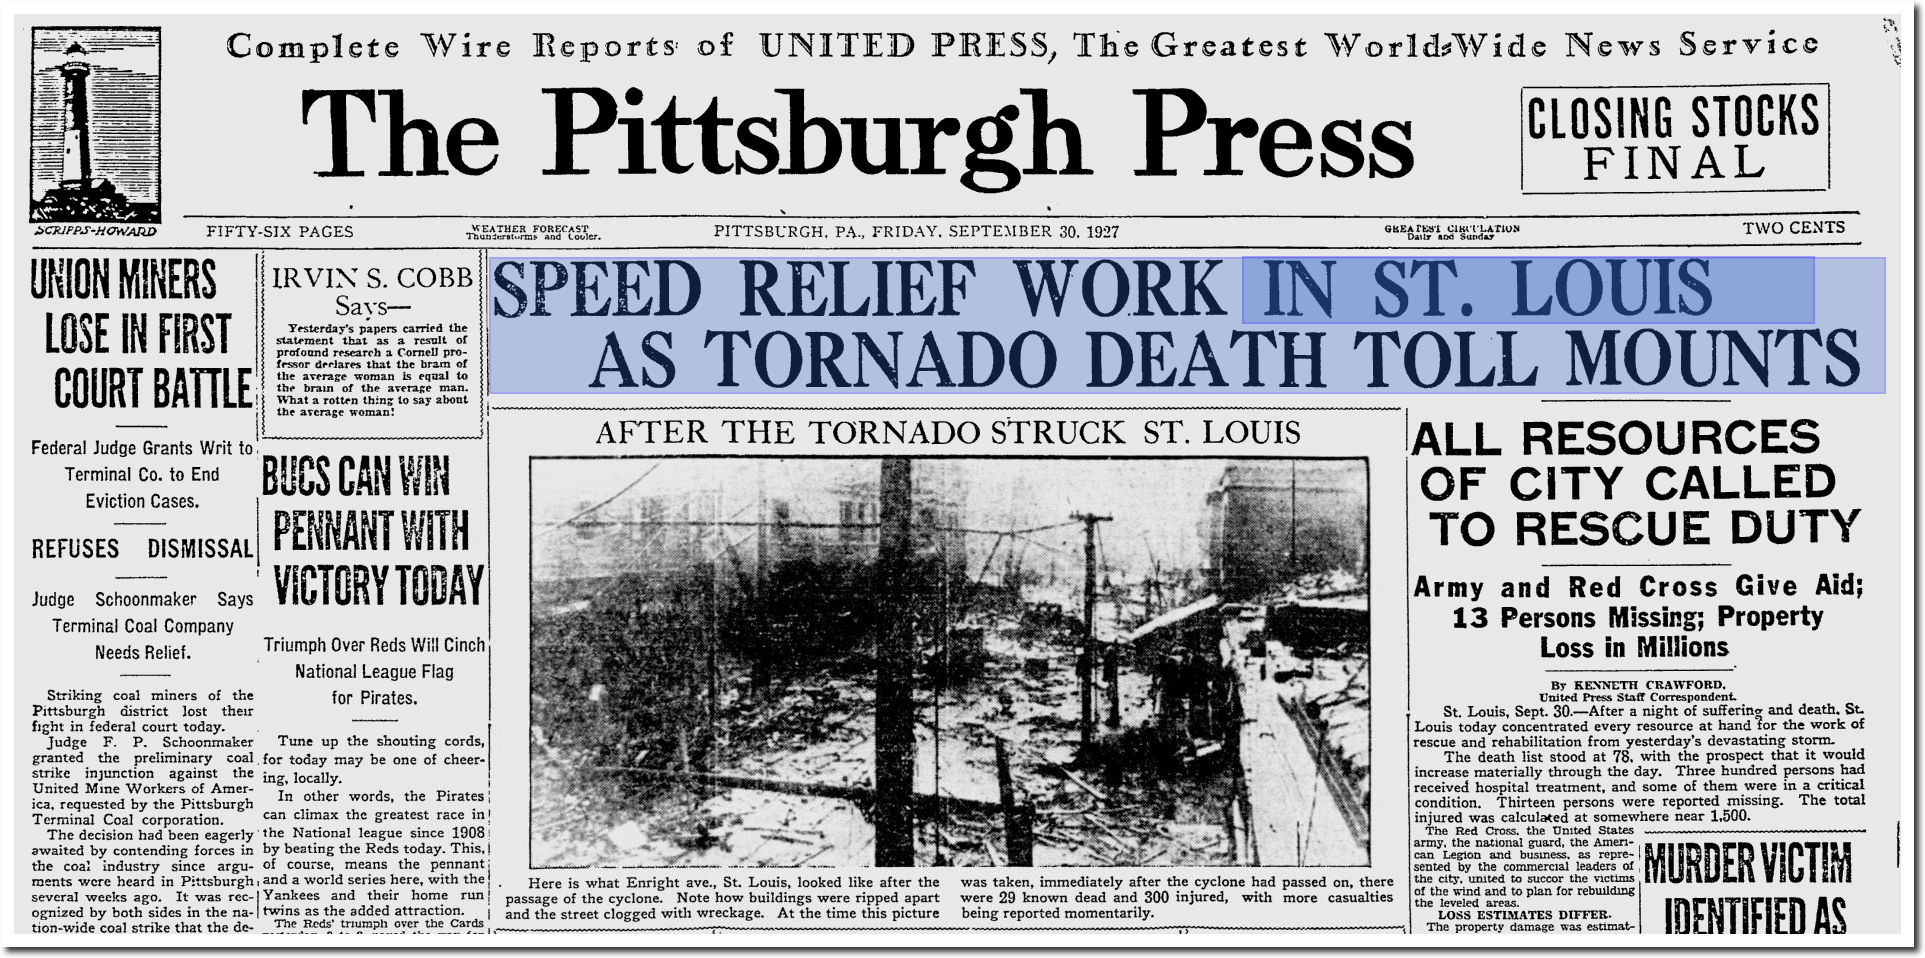
St. Louis was largely destroyed by a tornado.
The Pittsburgh Press – Google News Archive Search
November flooding wiped out more than 1,000 bridges in Vermont, and drowned the Lieutenant Governor.
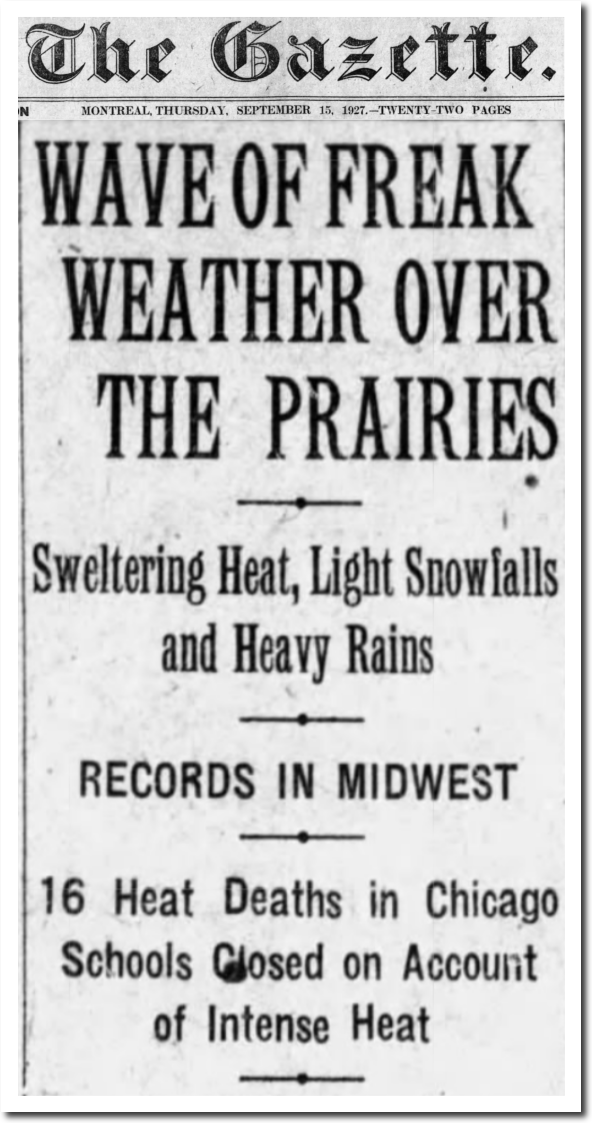
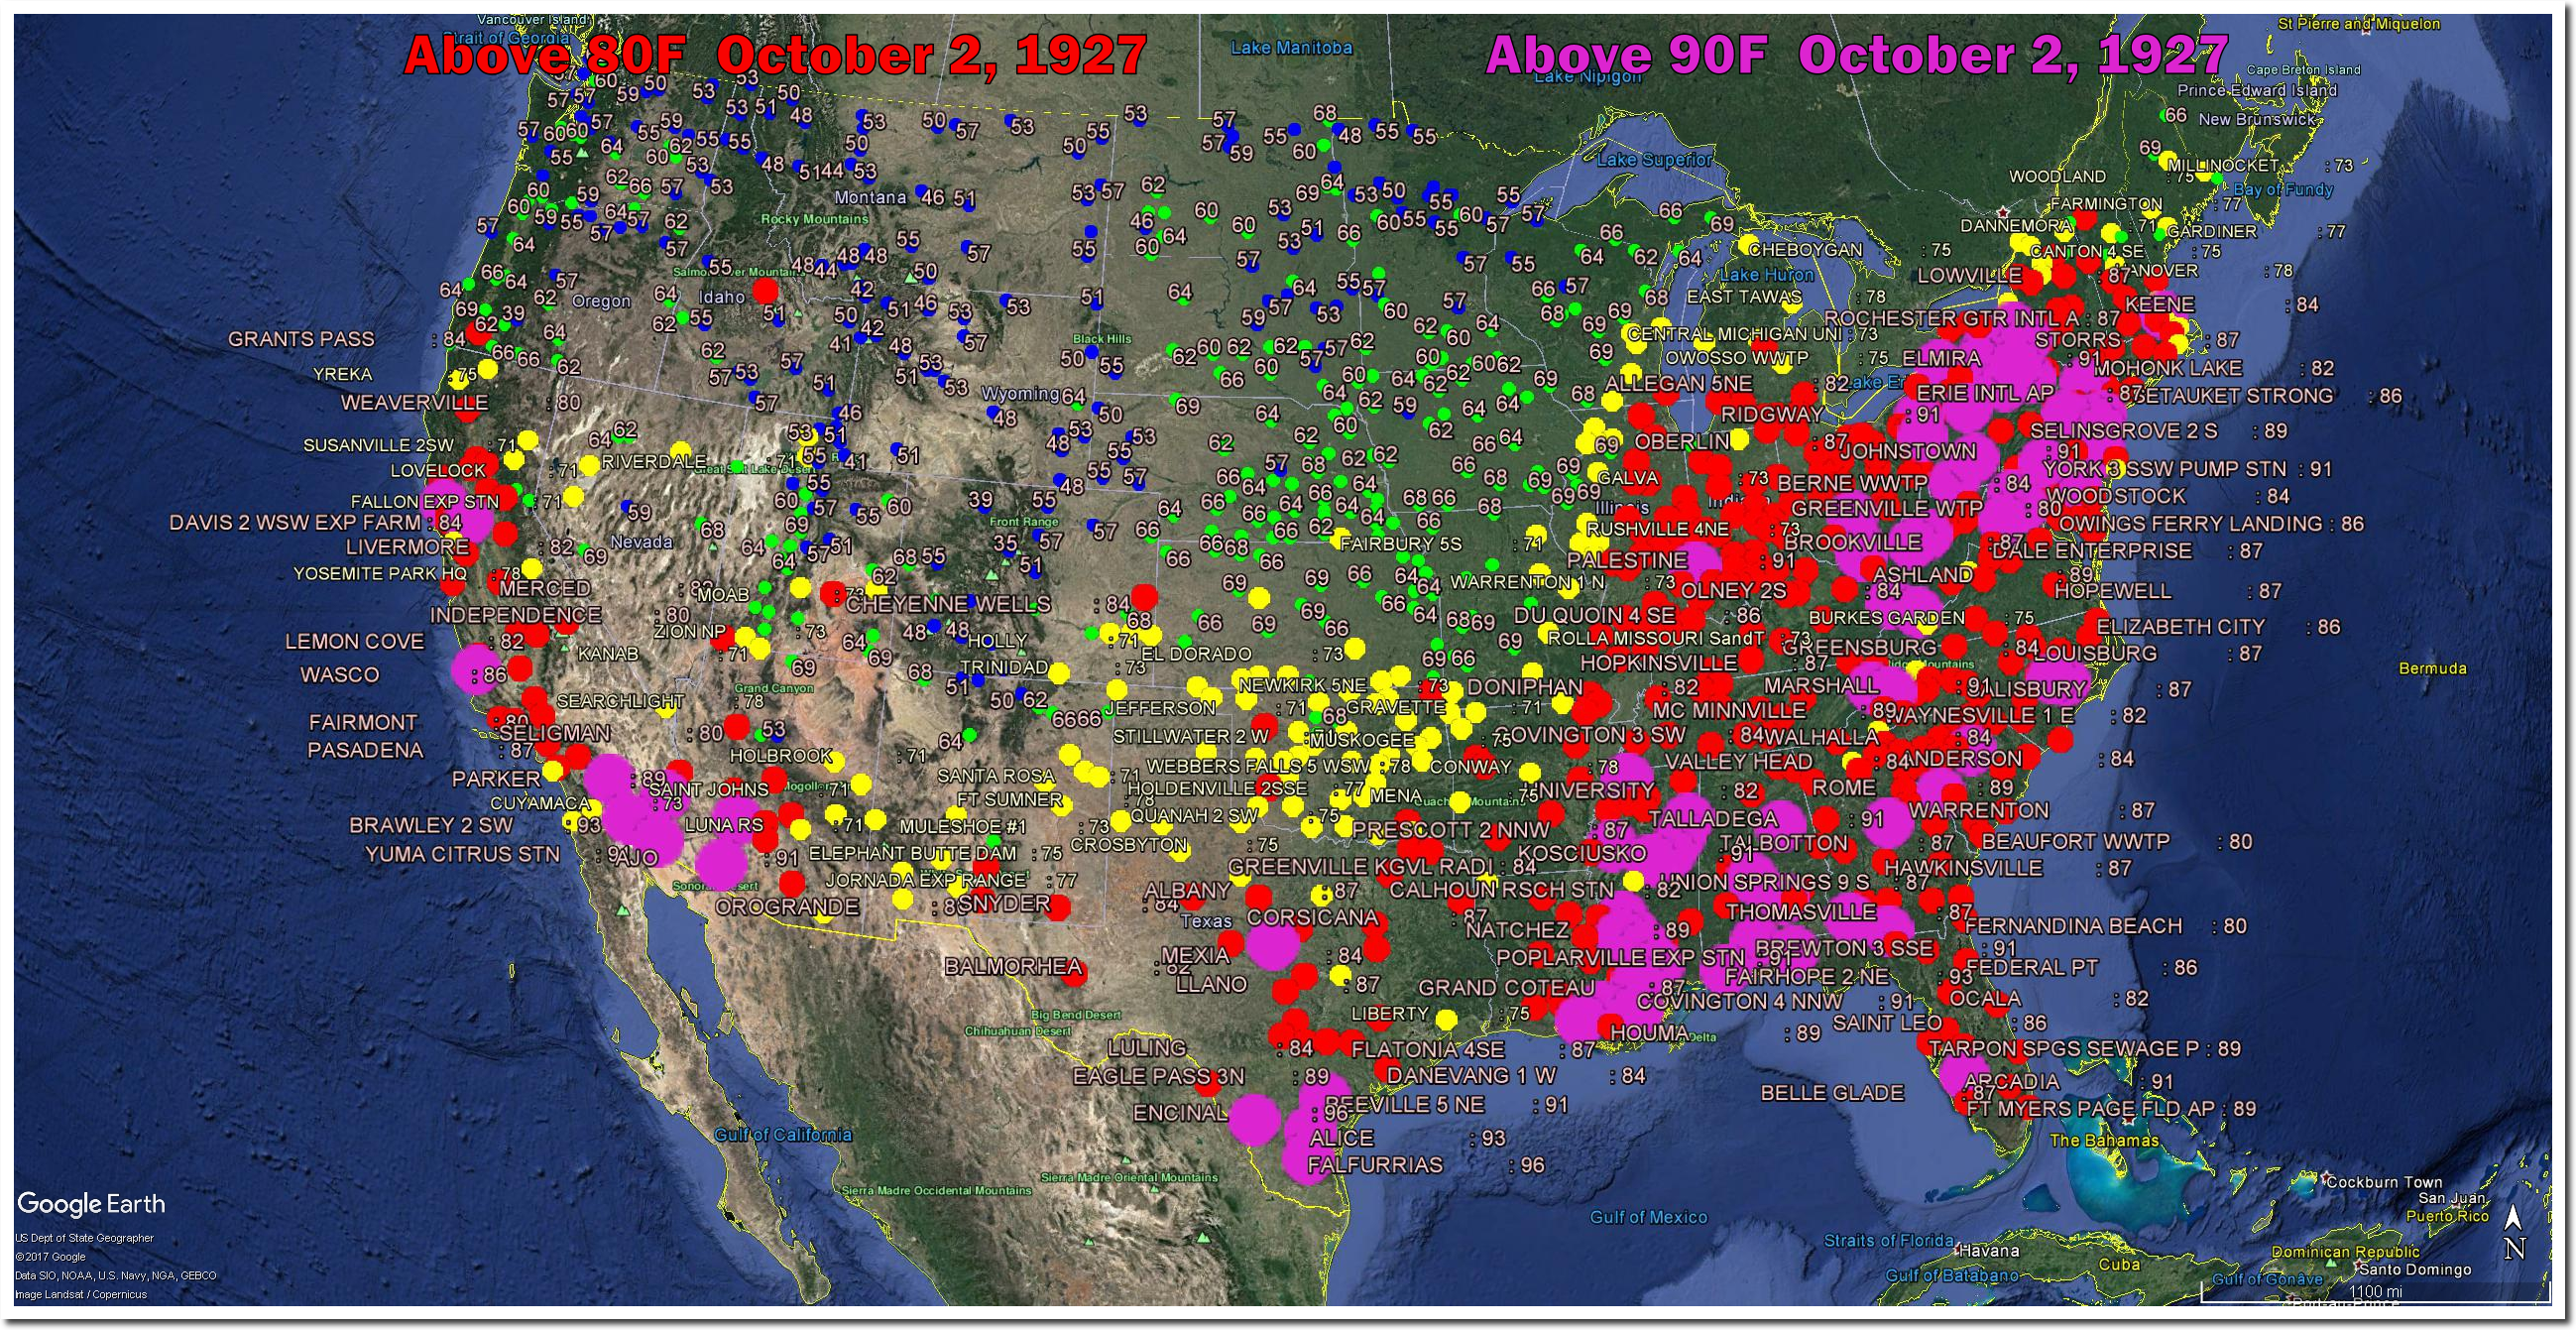
A number of record heatwaves occurred in 1927, including a protracted one in September and October, which killed scores of people.
15 Sep 1927, 1 – The Gazette at Newspapers.com
Warsaw Union – Google News Archive Search
On October 2, 1927, temperatures in upstate New York reached 99 degrees.
And if all that wasn’t bad enough, children were happily sunbathing near the North Pole.
02 Jan 1927 – SUNBATHING NEAR THE NORTH POLE – Trove
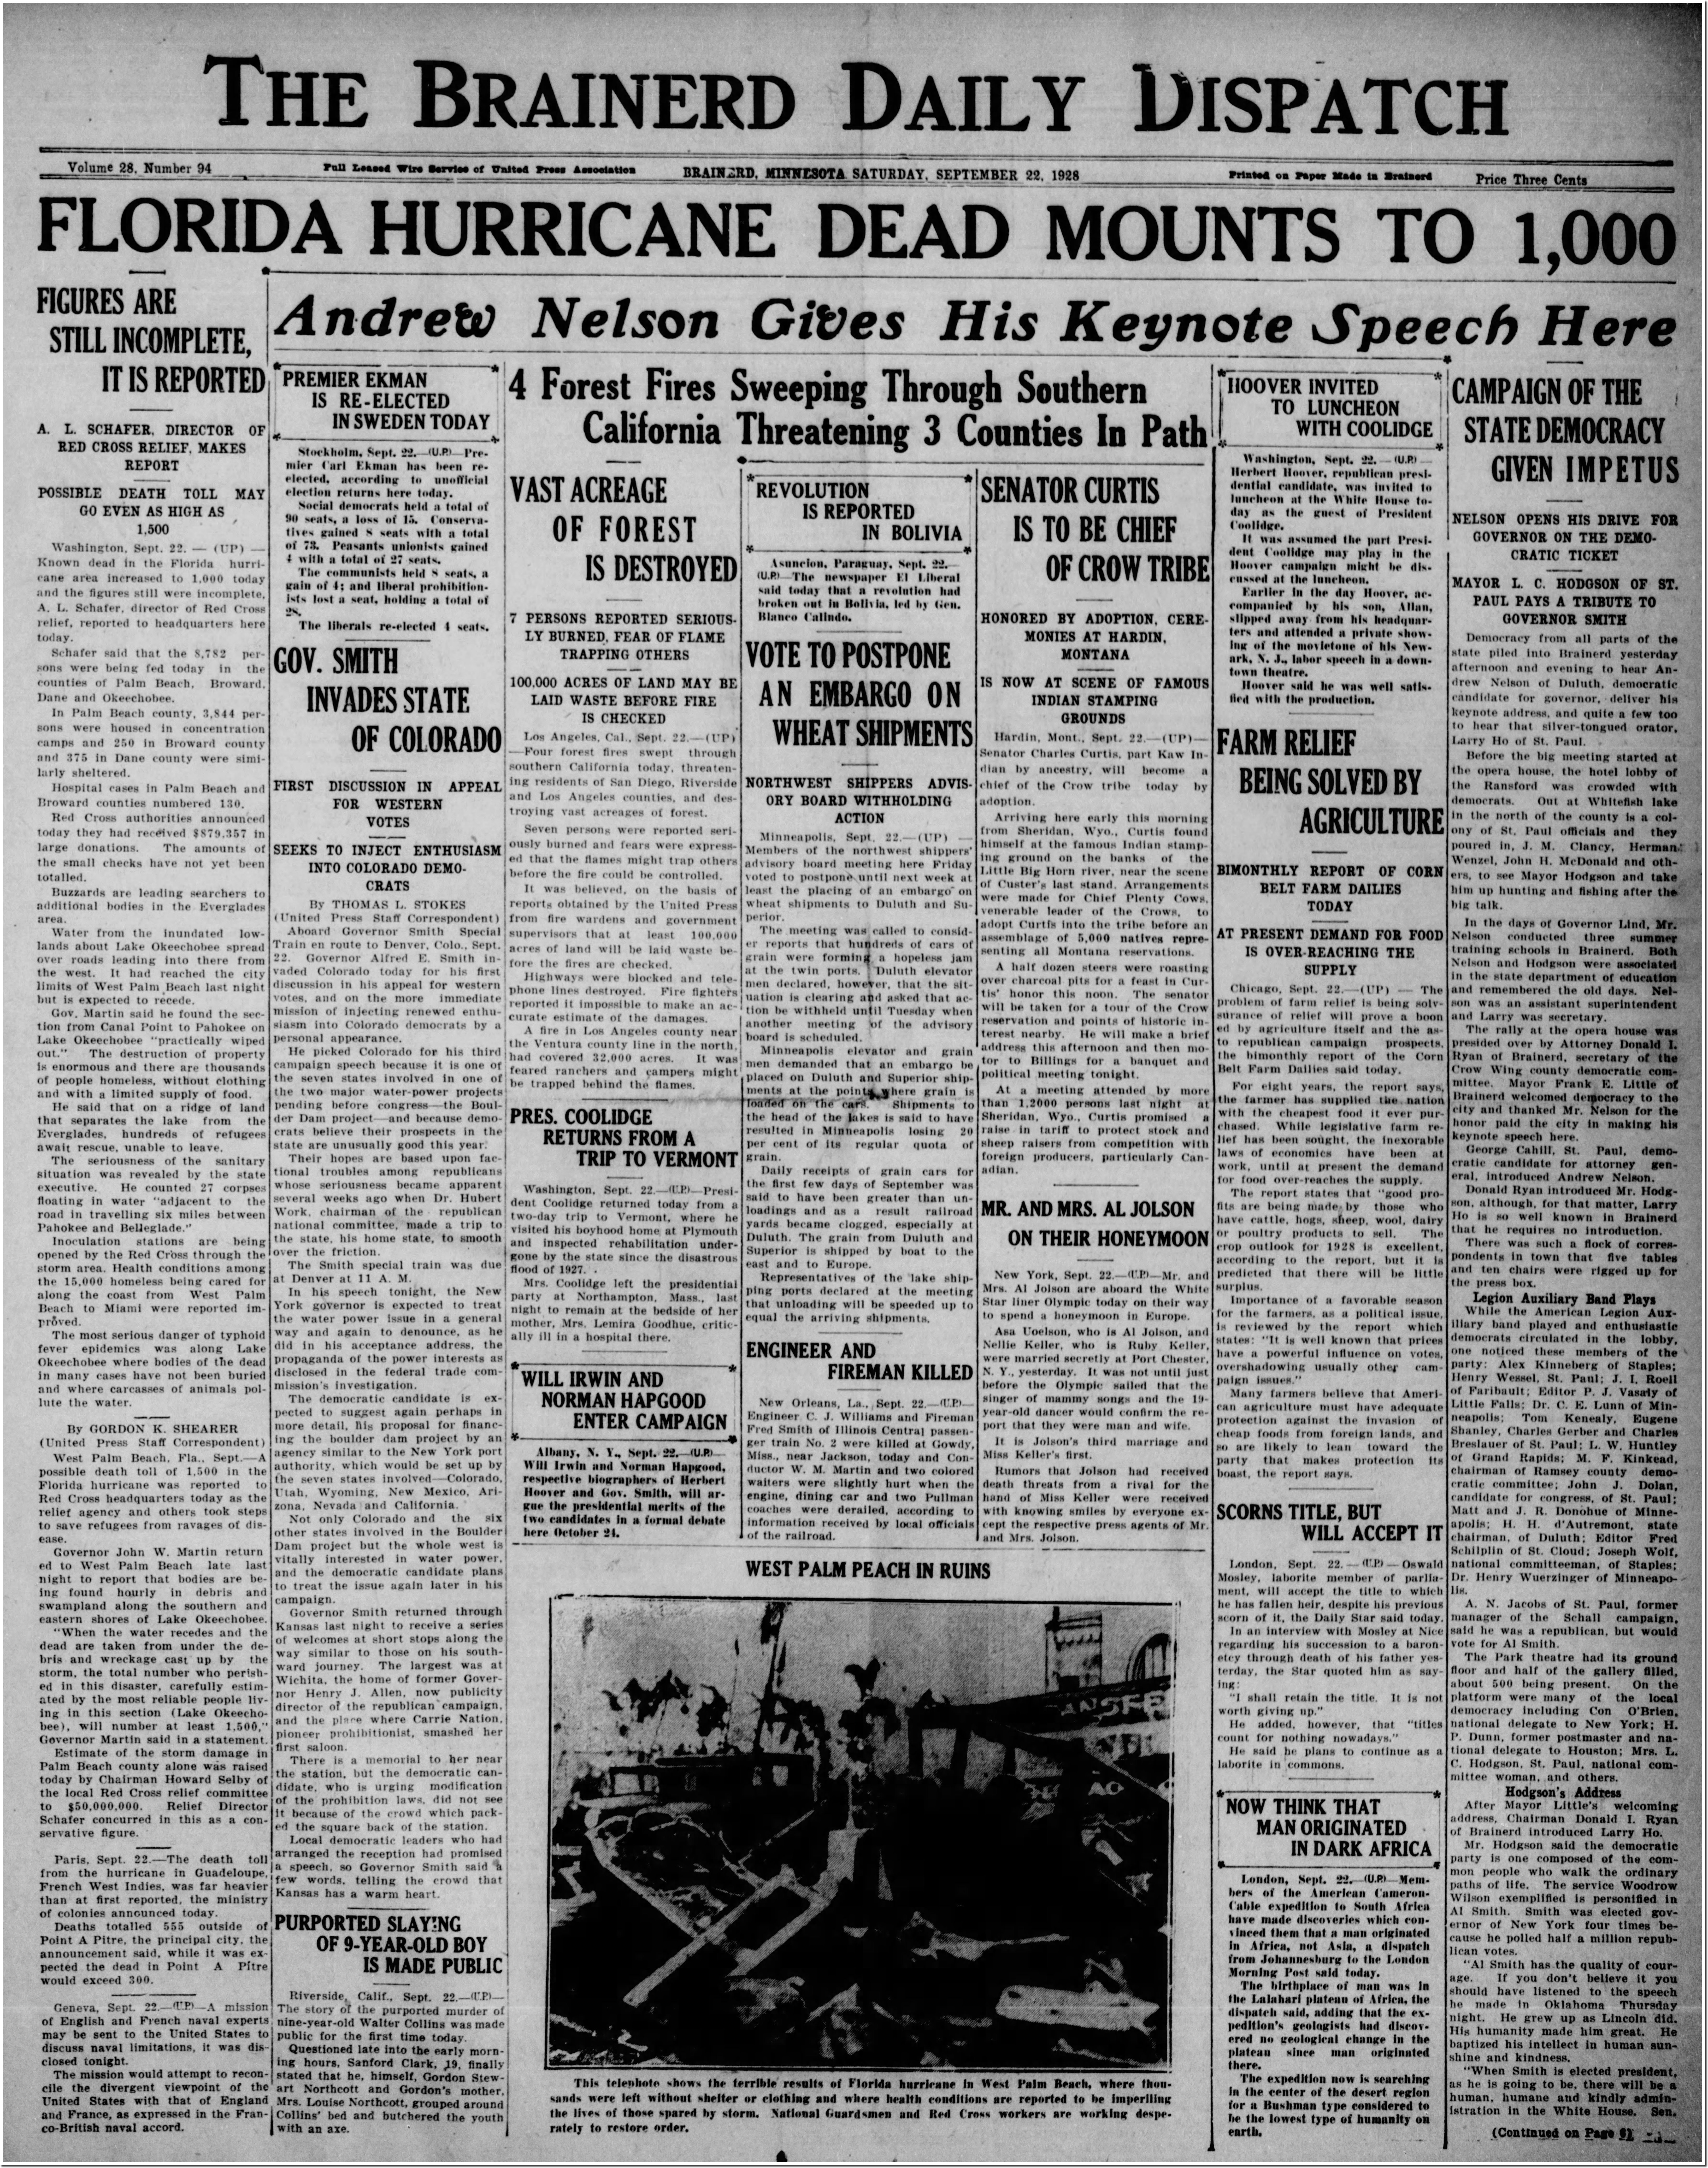
The following year. 1928, brought one of the deadliest hurricanes in US history to Florida, while massive forest fires were burning in California.
22 Sep 1928, Page 1 – The Brainerd Daily Dispatch at Newspapers.com
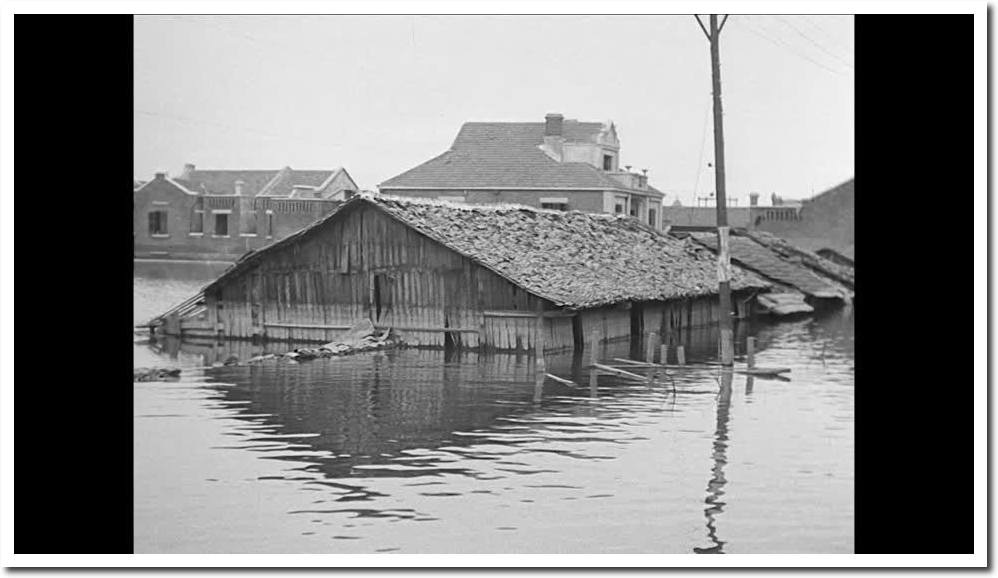
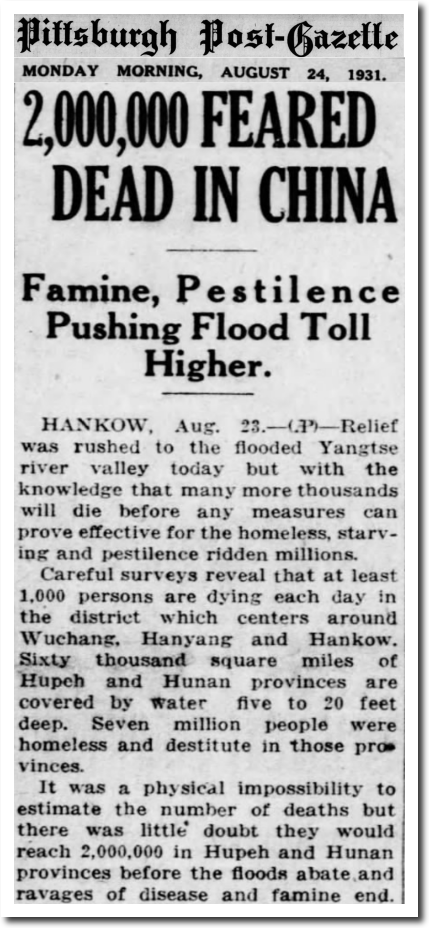
The year 1931 brought the deadliest floods in world history. More than three million people died.
21 Aug 1931 – 30 MILLIONS HUNGRY – Trove
24 Aug 1931, Page 1 – Pittsburgh Post-Gazette
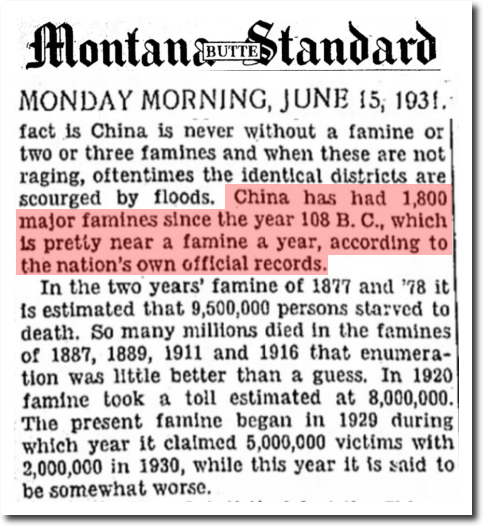
China was having their 1,800th major famine since the year 108 BC.
15 Jun 1931, Page 6 – Montana Butte Standard at Newspapers.com
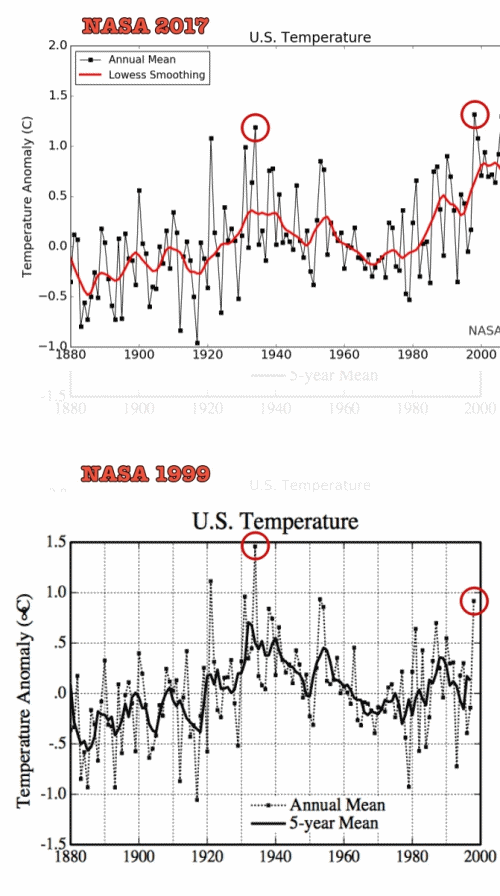
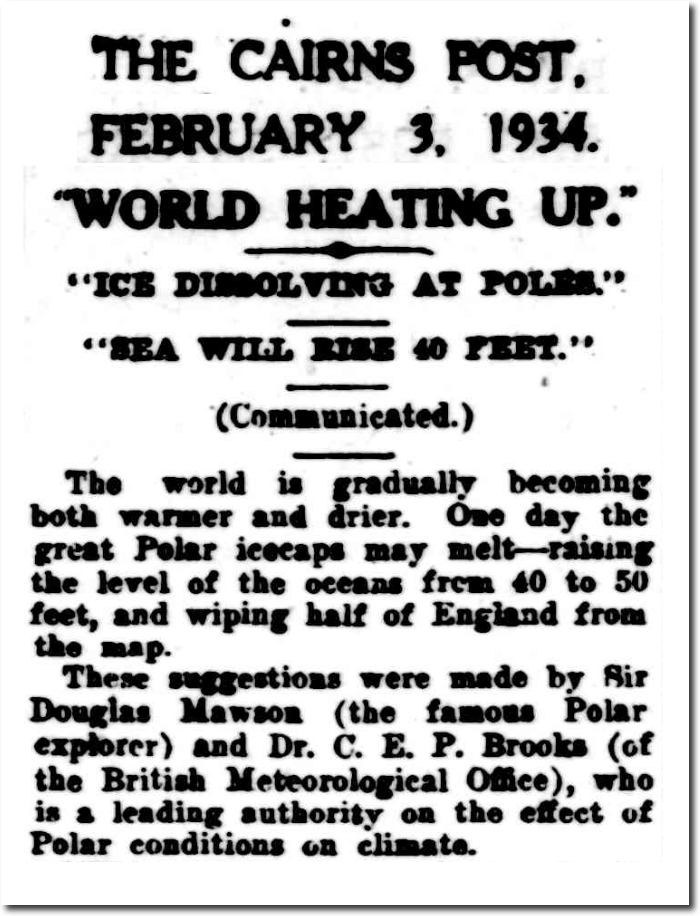
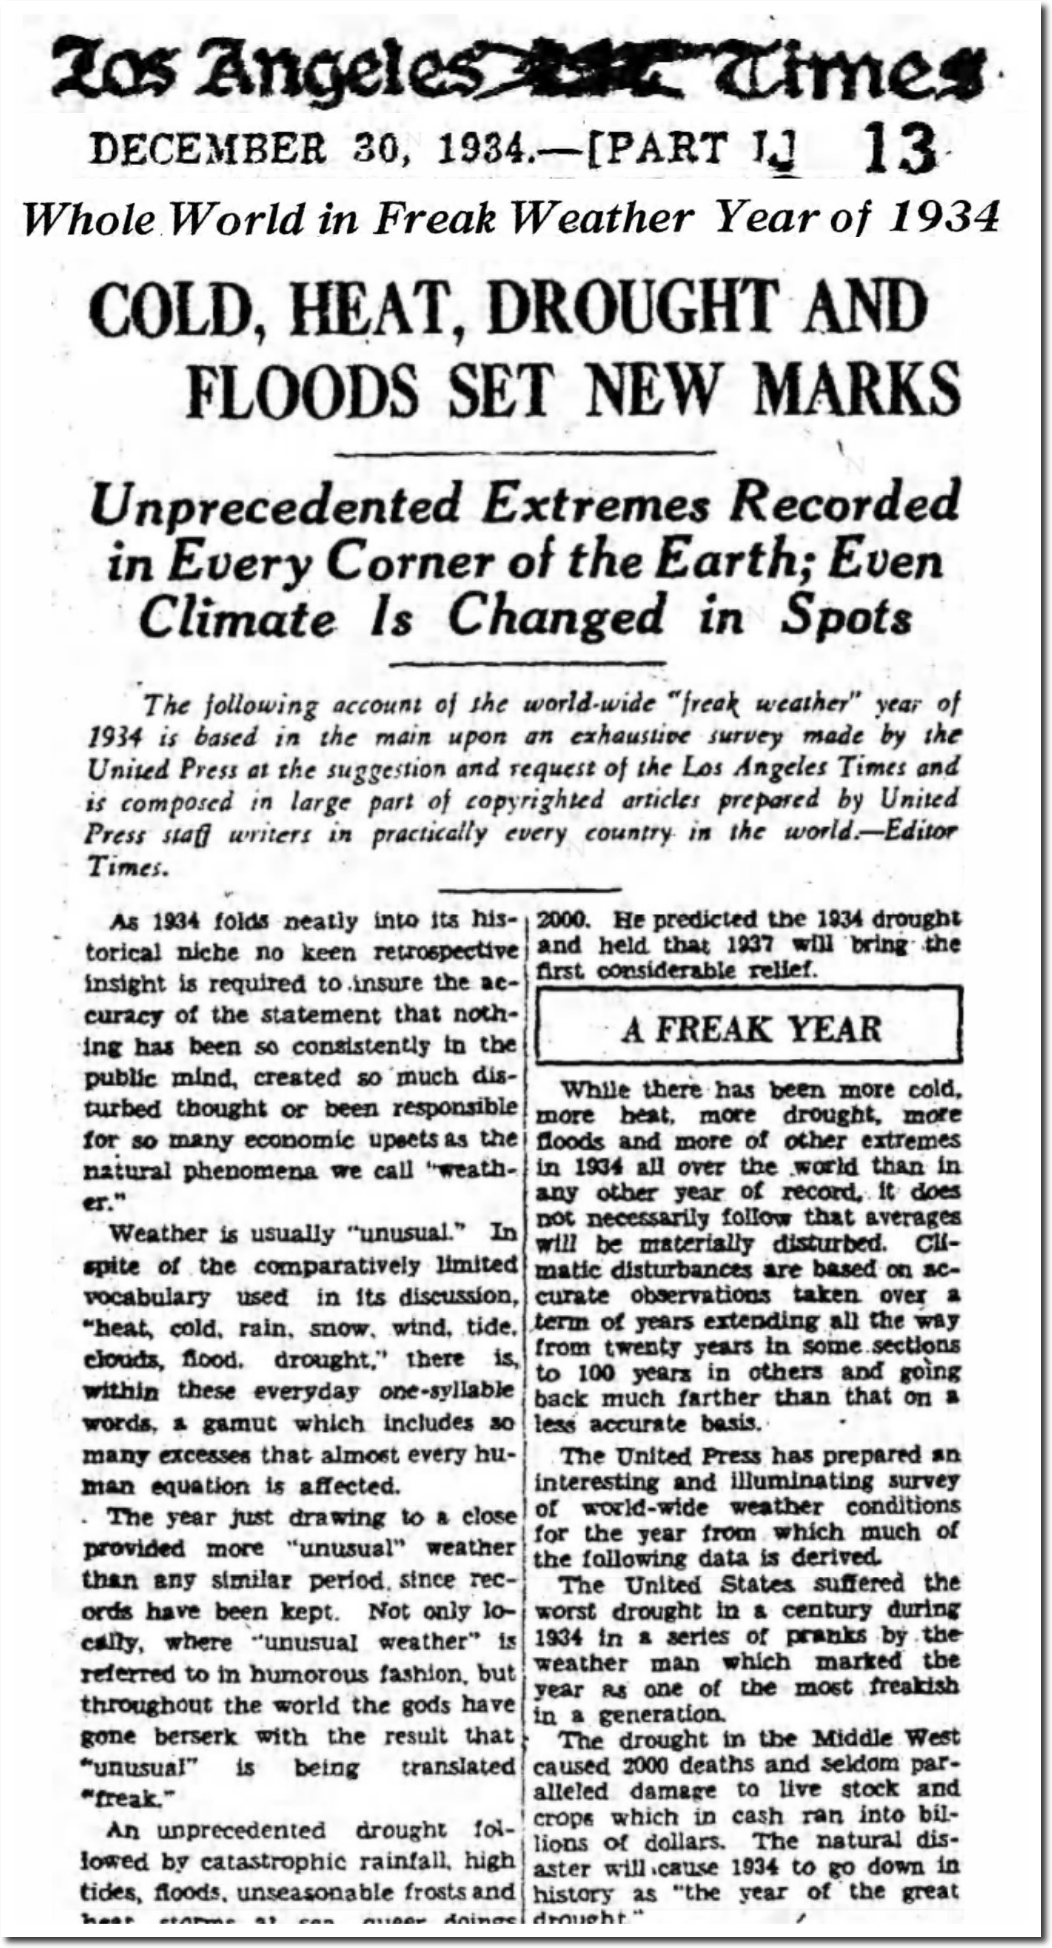
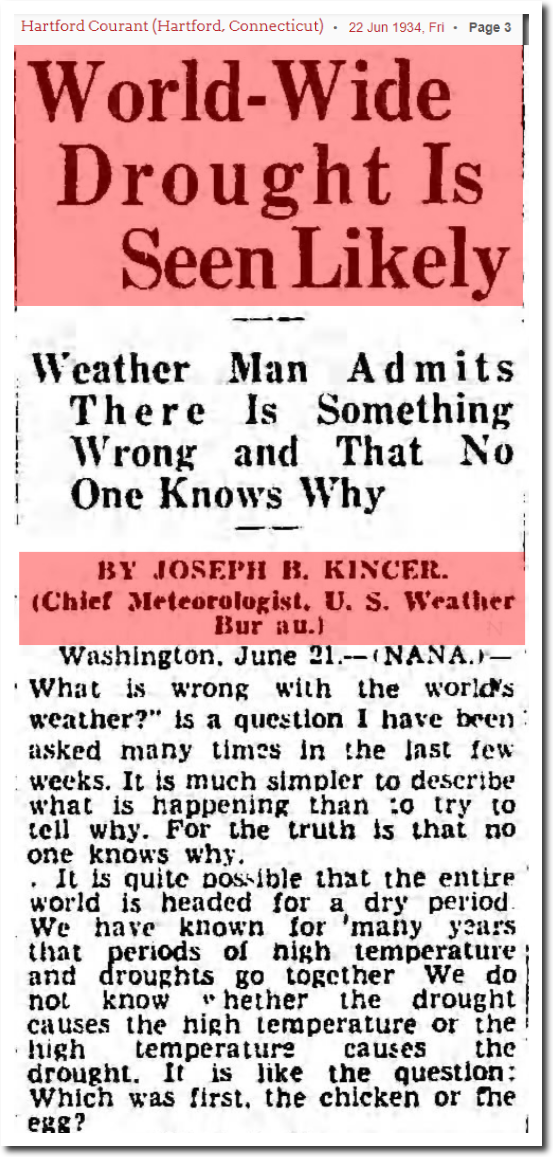
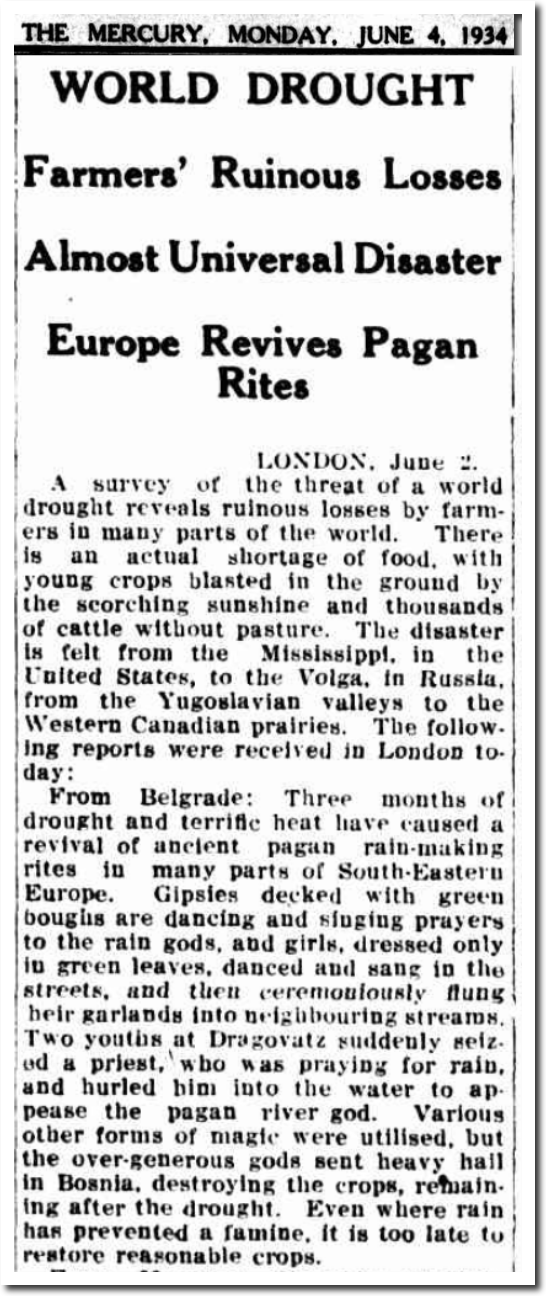
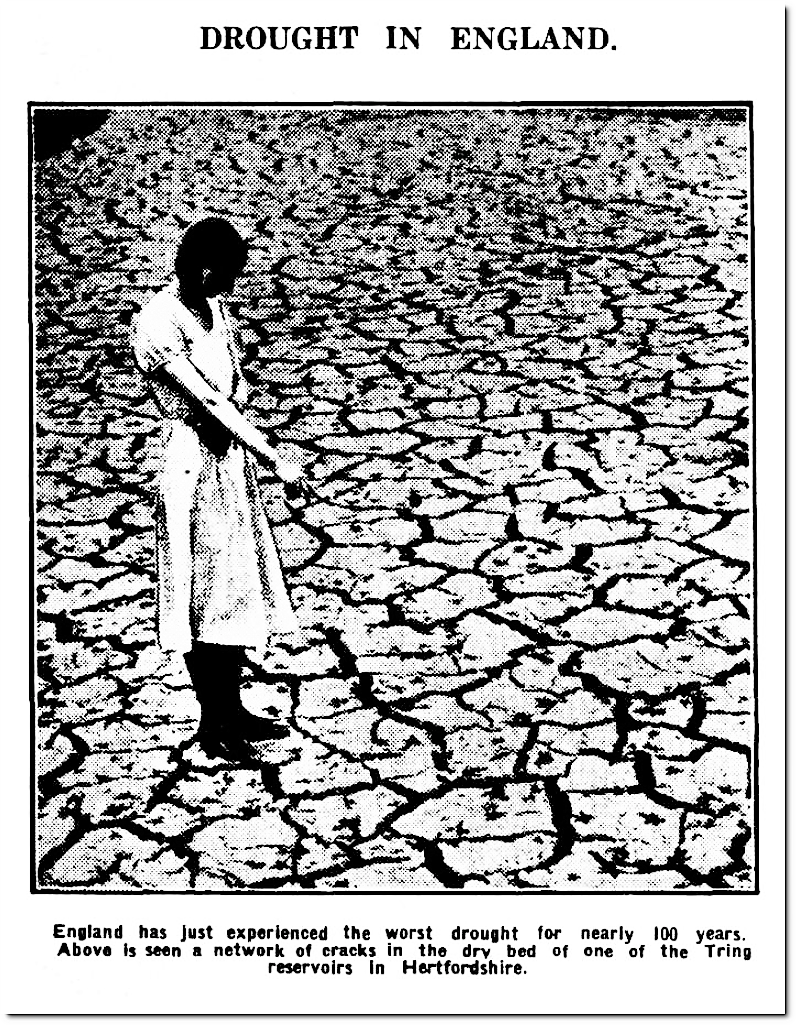
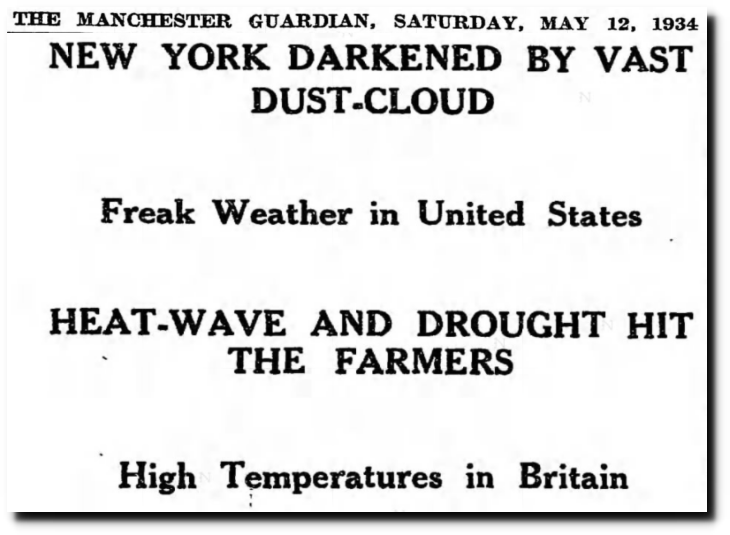
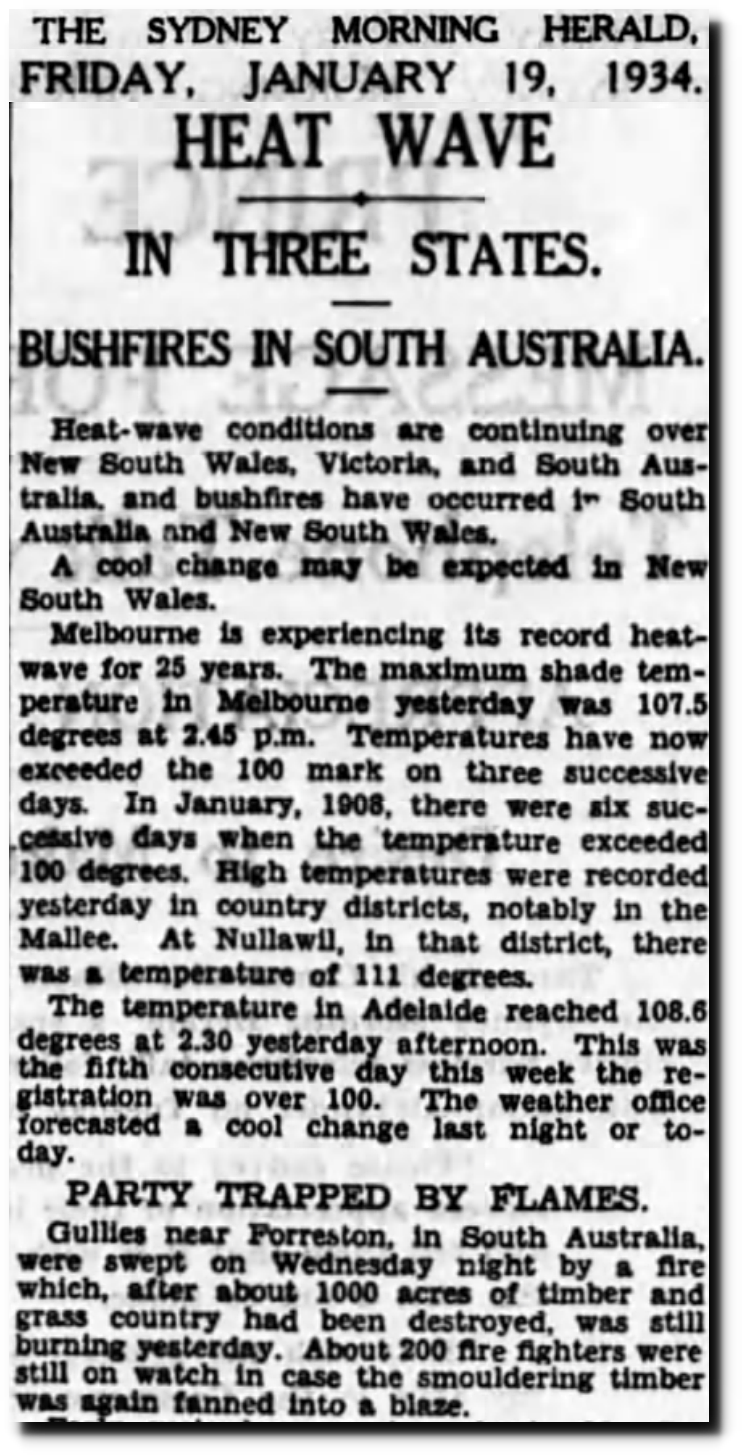
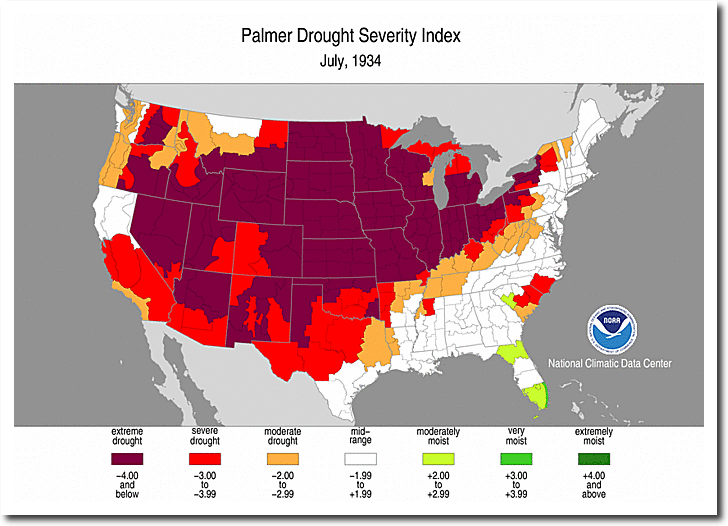
The year 1934 was the hottest year on record in the US, and brought a world-wide drought. This didn’t suit NASA’s global warming agenda, so they altered their data to make the heat disappear.
03 Feb 1934 – “WORLD HEATING UP.” – Trove
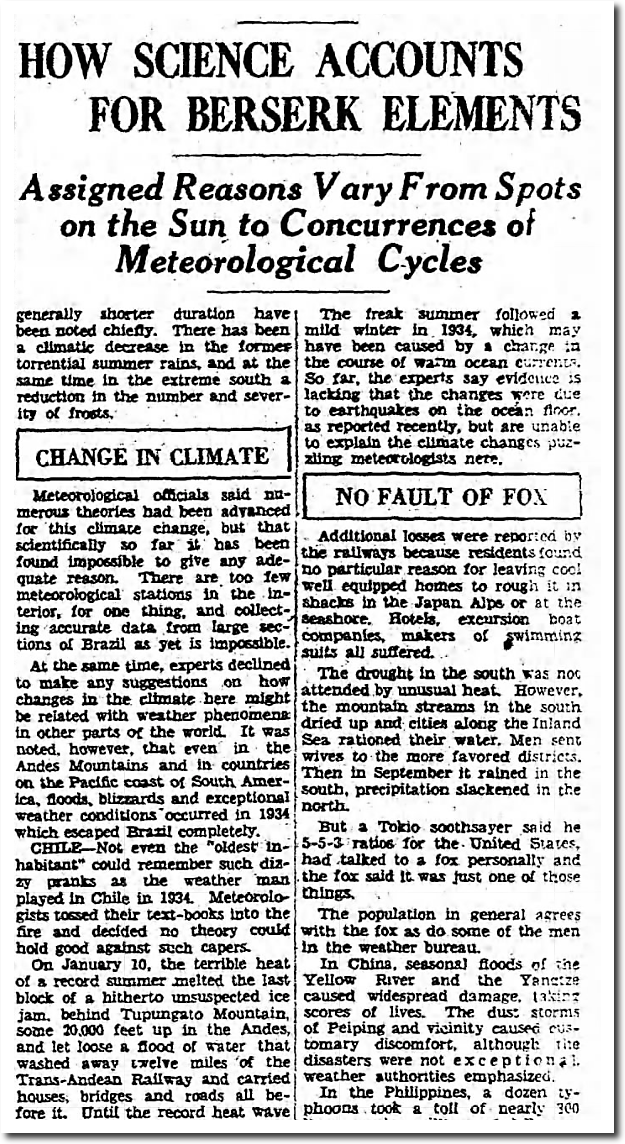
30 Dec 1934, Page 13 – The Los Angeles Times at Newspapers.com
22 Jun 1934, Page 3 – Hartford Courant at Newspapers.com
04 Jun 1934 – WORLD DROUGHT – Trove
19 Jul 1934 – DROUGHT IN ENGLAND. – Trove
12 May 1934, 13 – The Guardian at Newspapers.com
19 Jan 1934, Page 10 – The Sydney Morning Herald at Newspapers.com
05 Jun 1934, Page 5 – The News-Chronicle at Newspapers.com
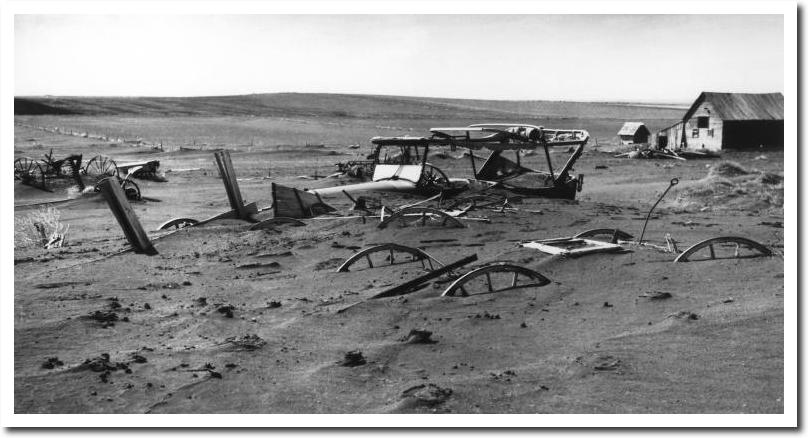
The drought of 1934 was by far the worst in US history.
The extreme heat and drought caused millions of climate refugees to flee the Great Plains and move to California, as John Steinbeck described in “The Grapes of Wrath.”
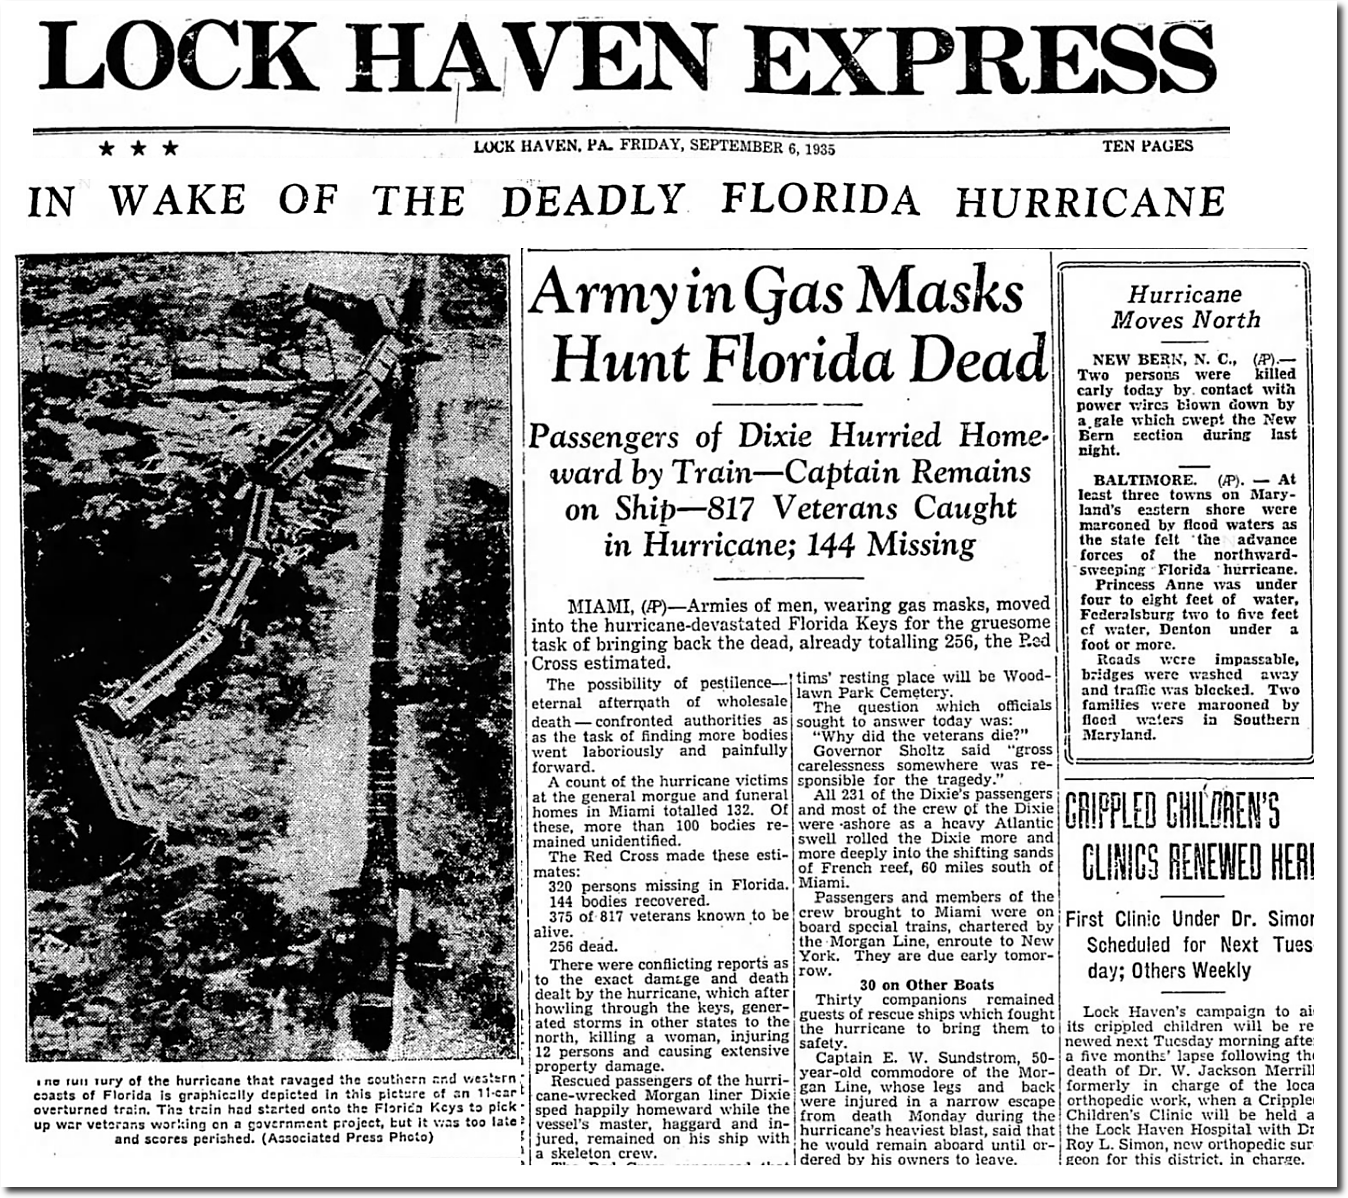
Labor Day 1935 brought the most intense hurricane in US history to the Florida Keys.
06 Sep 1935, Page 1 – The Express at Newspapers.com
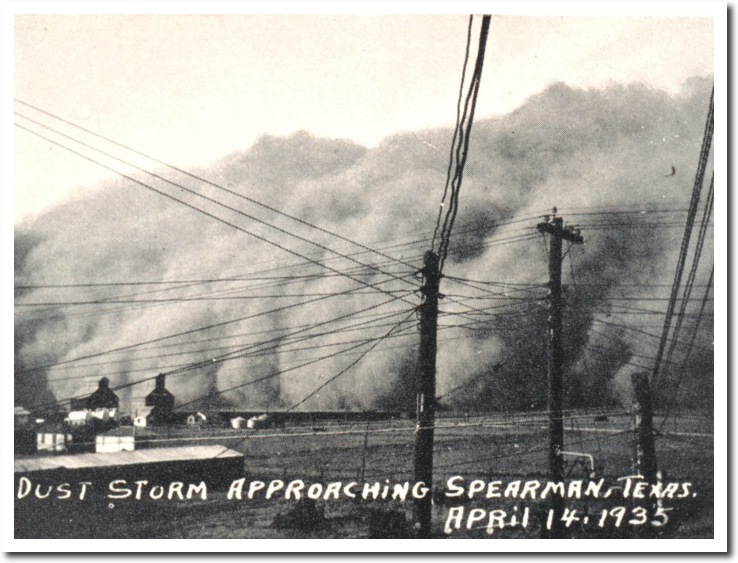
This came a few weeks after the worst dust storm and most intense rainfall on record.
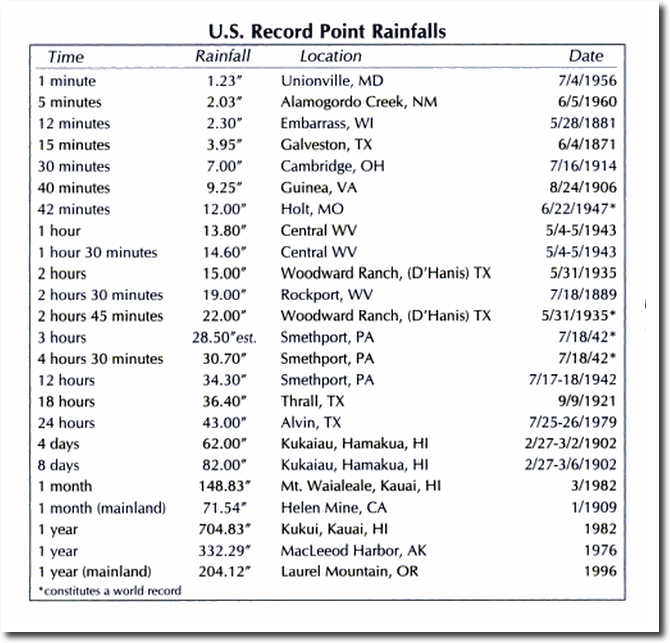
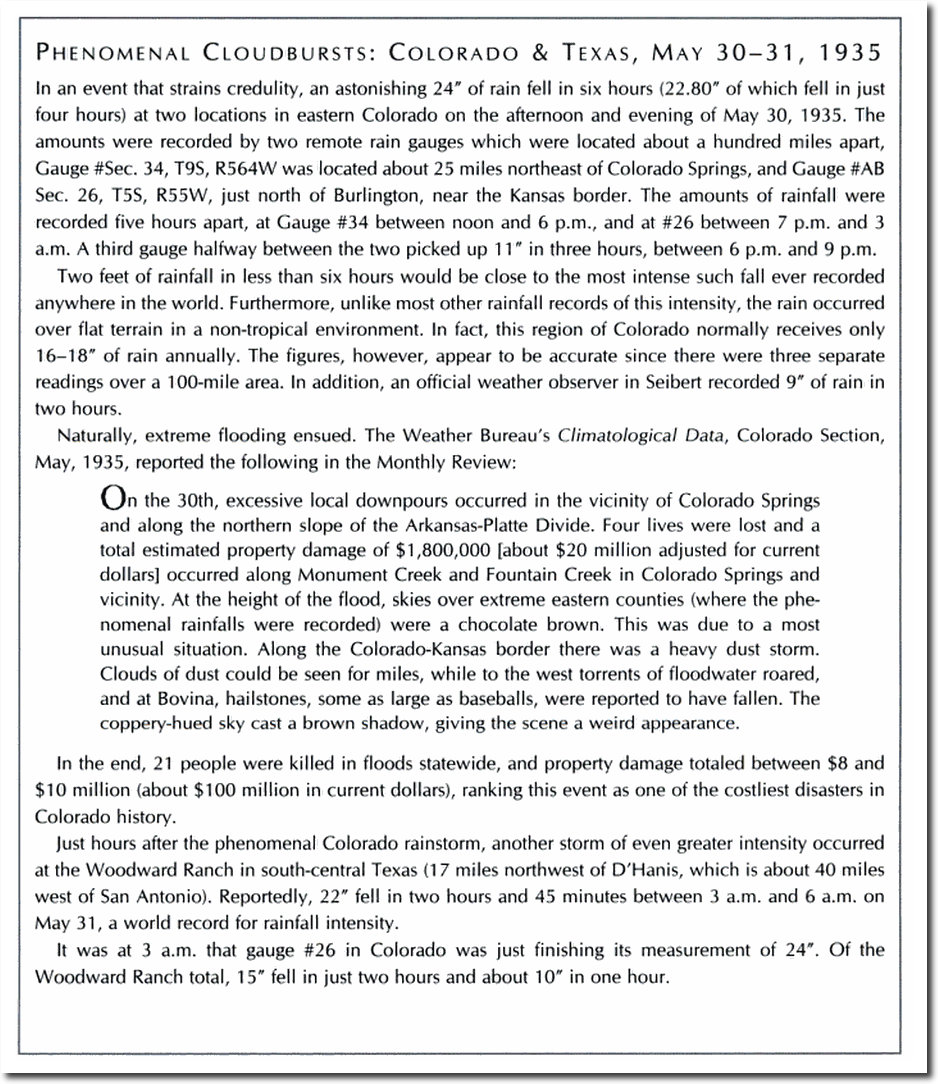
On May 31, 1935 Woodward Ranch, Texas set the world record with 22 inches of rain in less than three hours.
Colorado got nearly that much rain a few hours earlier.
Extreme Weather: A Guide & Record Book – Christopher C. Burt – Google Books
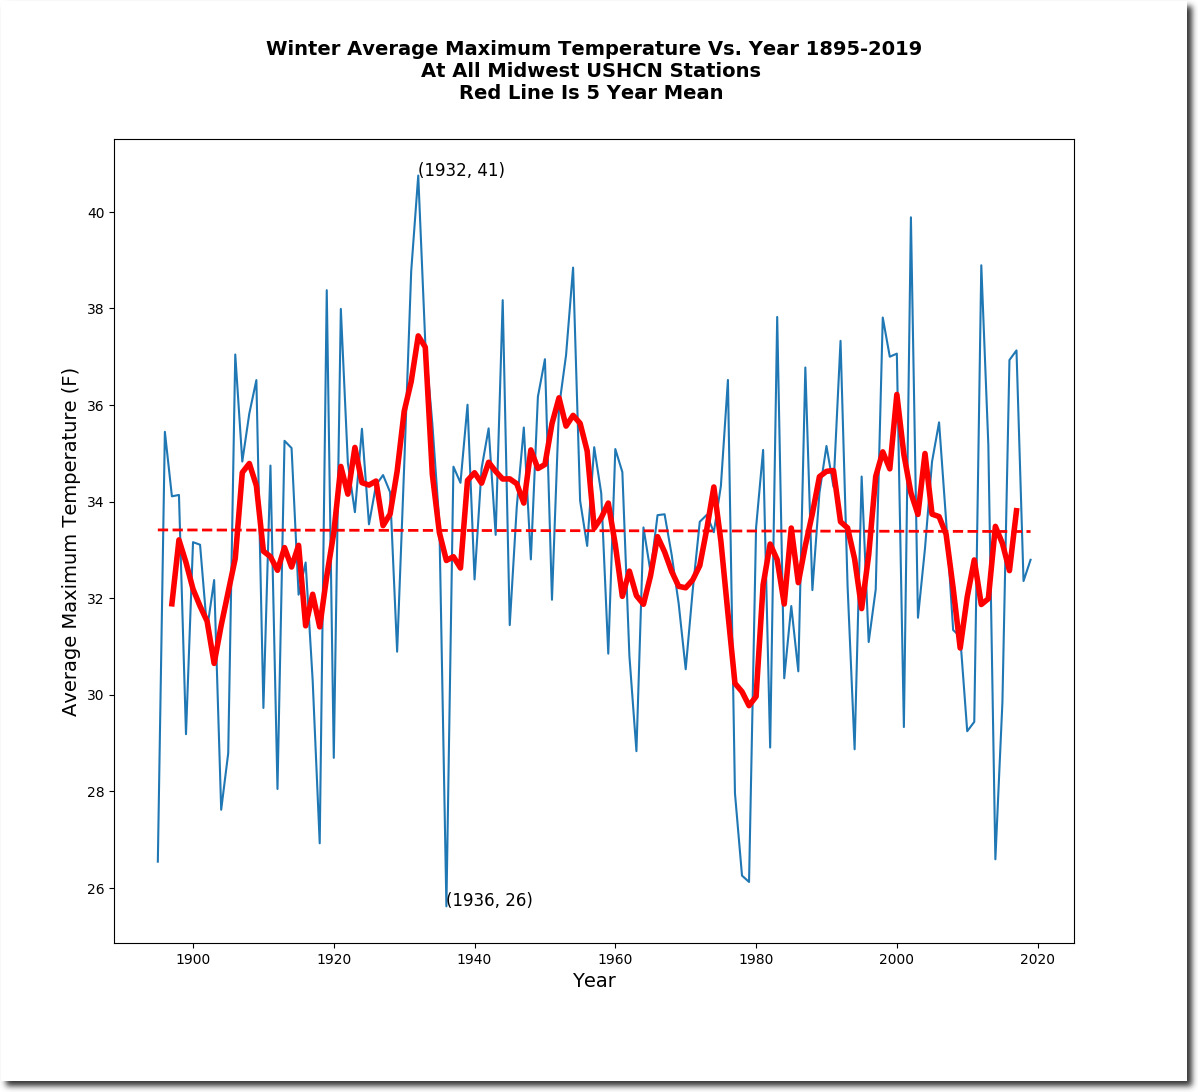
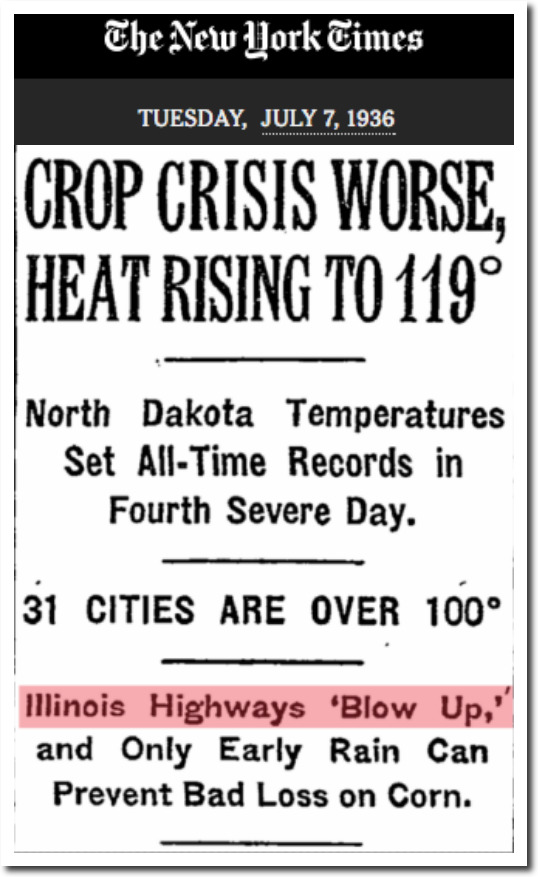
The following year was the most extreme year in US history – the winter of 1936 was the coldest, and the summer of 1936 was the hottest.
A huge number of stations set their all-time high temperature record in 1936. North Dakota and Kansas reached 121 degrees, South Dakota, Oklahoma, Arkansas and Texas reached 120 degrees. Iowa was 118 degrees, and Wisconsin was 114 degrees. New Jersey was 100 degrees.
Thousands of people died in the heat.
The Bulletin – Google News Archive Search
TimesMachine: July 7, 1936 – NYTimes.com
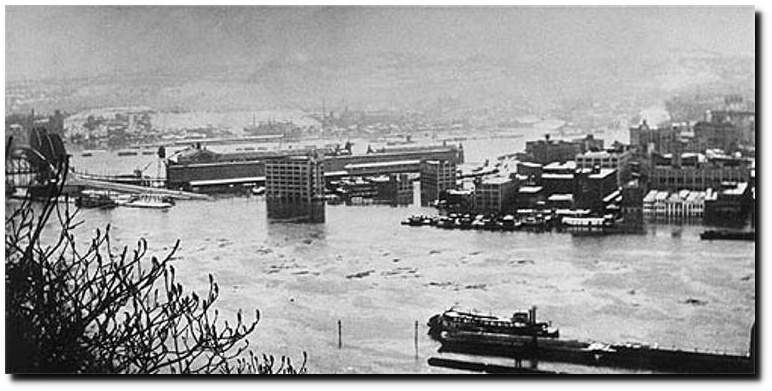
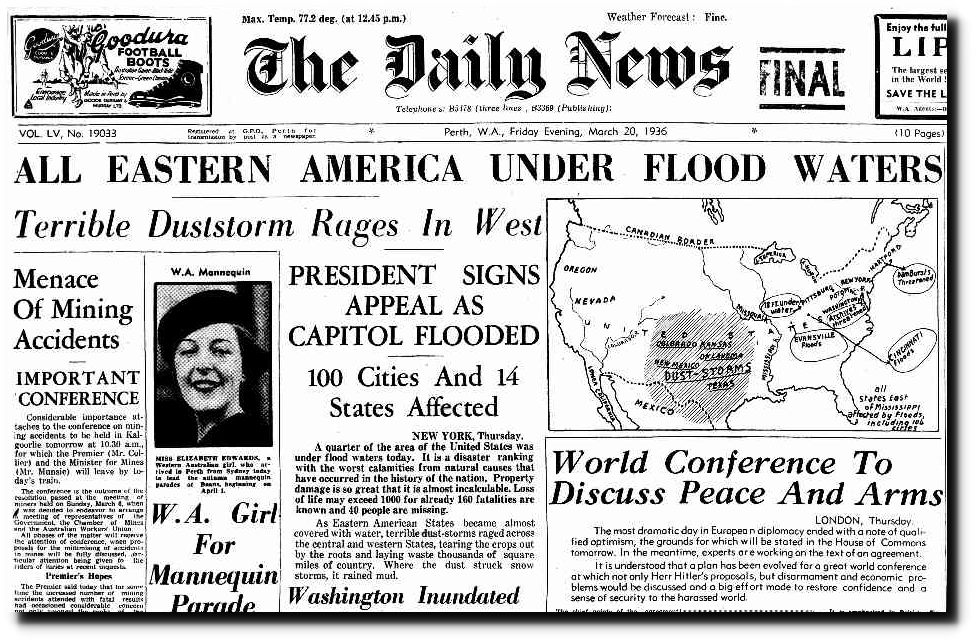
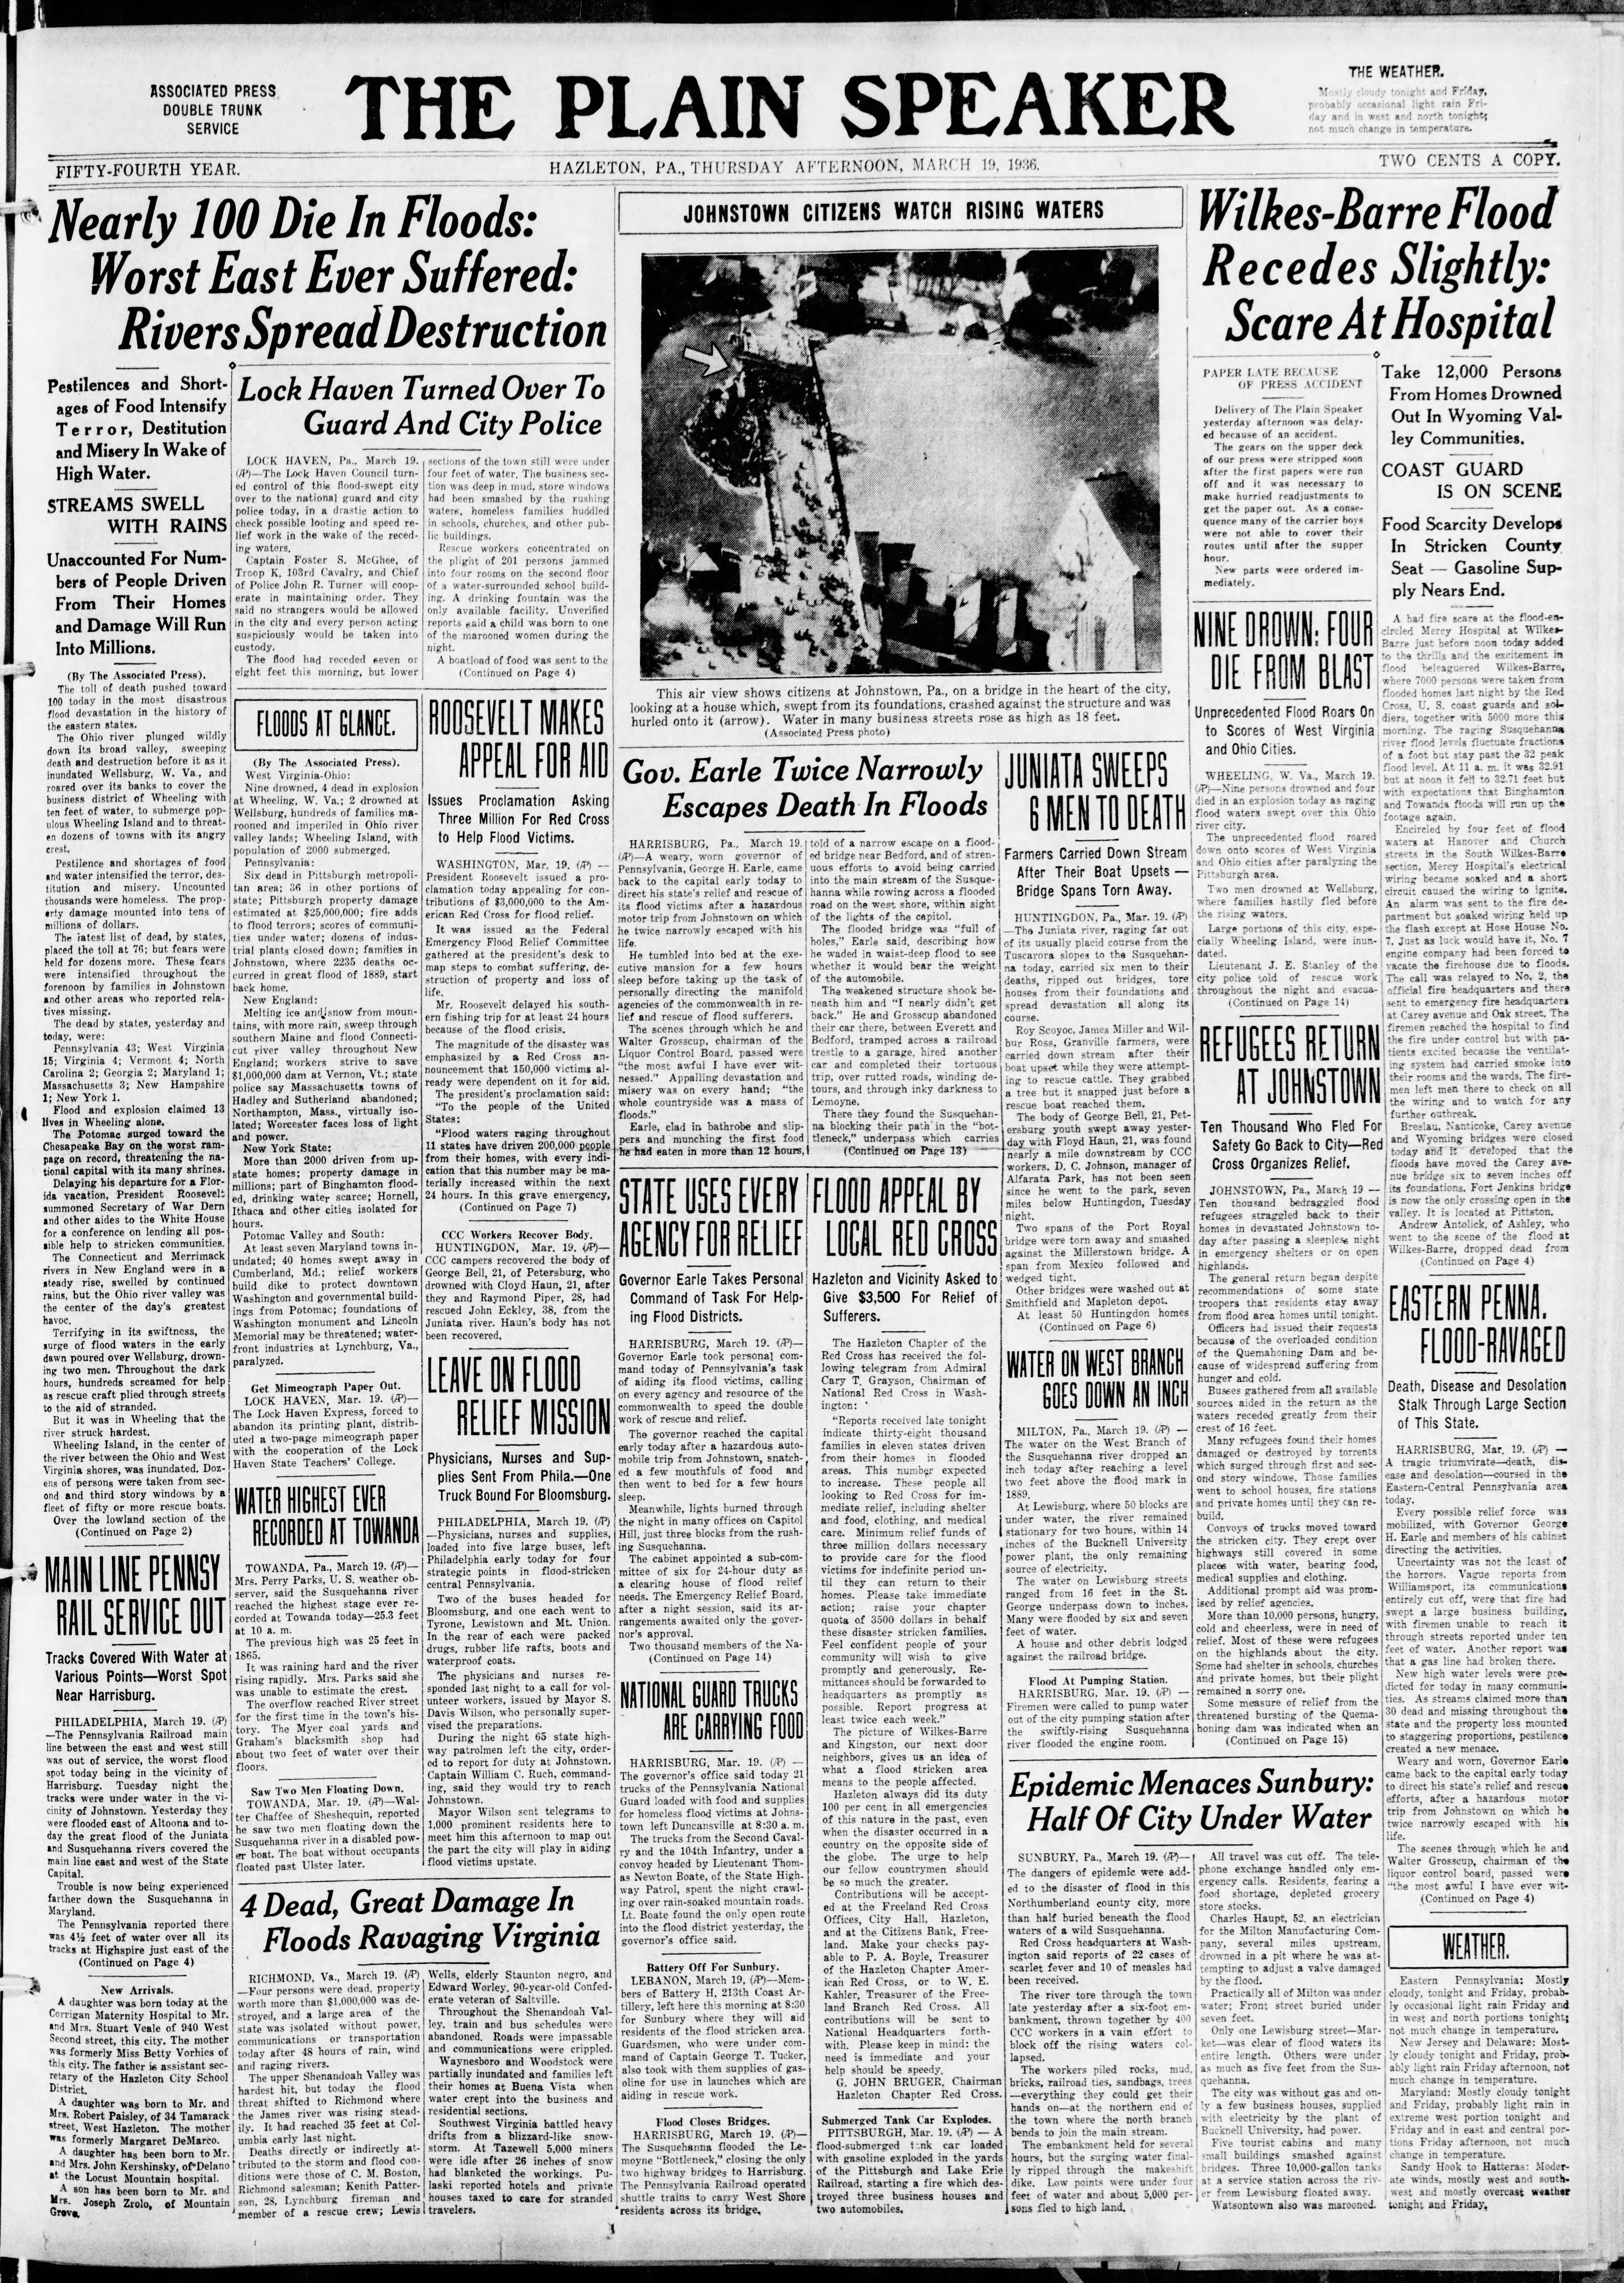
March of 1936 brought record flooding to the Eastern US. My grandfather was evacuated by boat from downtown Pittsburgh.
20 Mar 1936 – ALL EASTERN AMERICA UNDER FLOOD WATERS
19 Mar 1936, Page 1 – The Plain Speaker at Newspapers.com
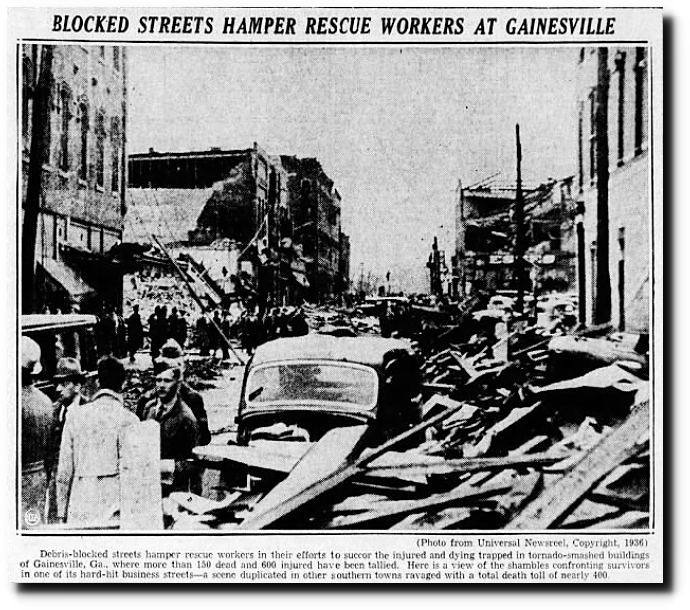
April of 1936 brought one of the worst tornado outbreaks in US history.
11 Apr 1936, Page 1 – Weekly Town Talk
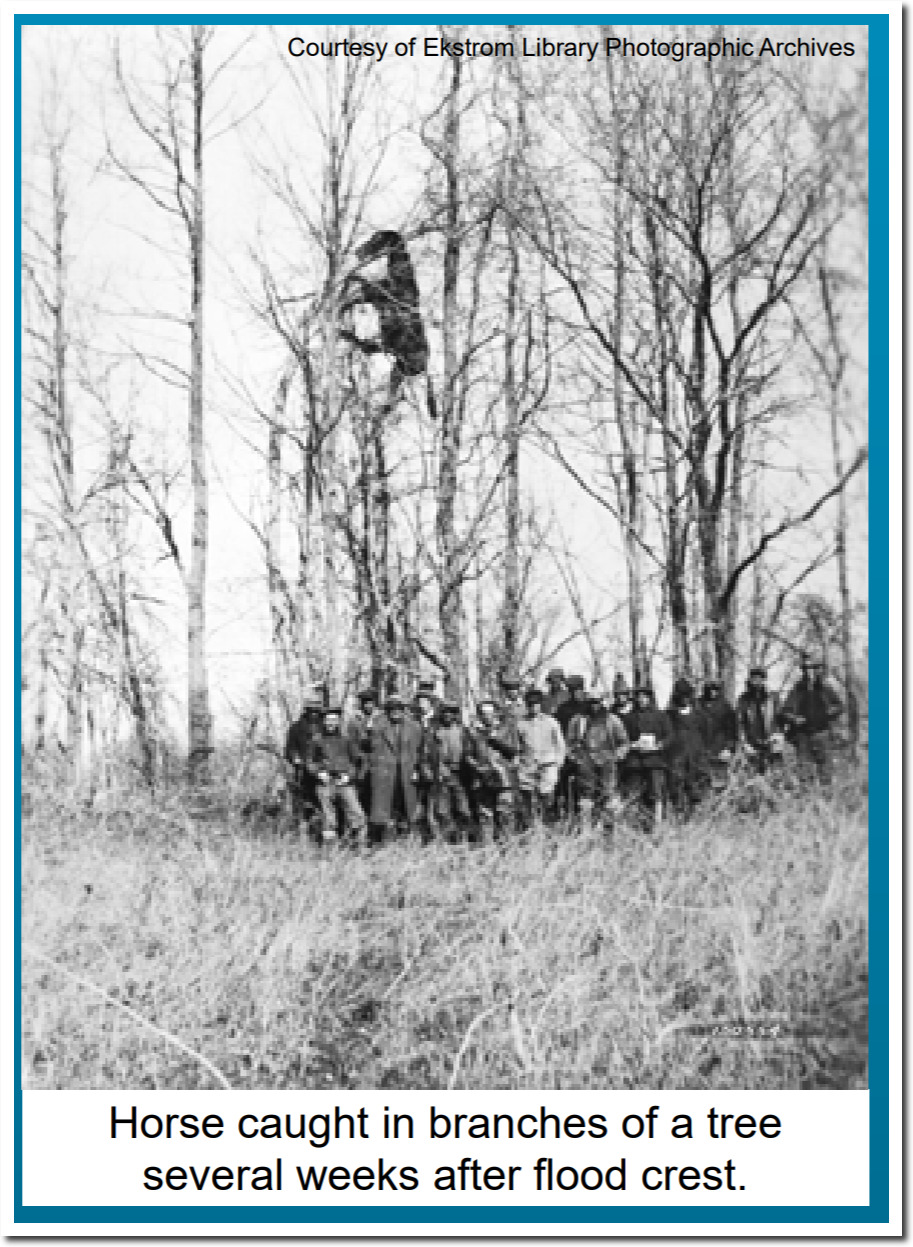
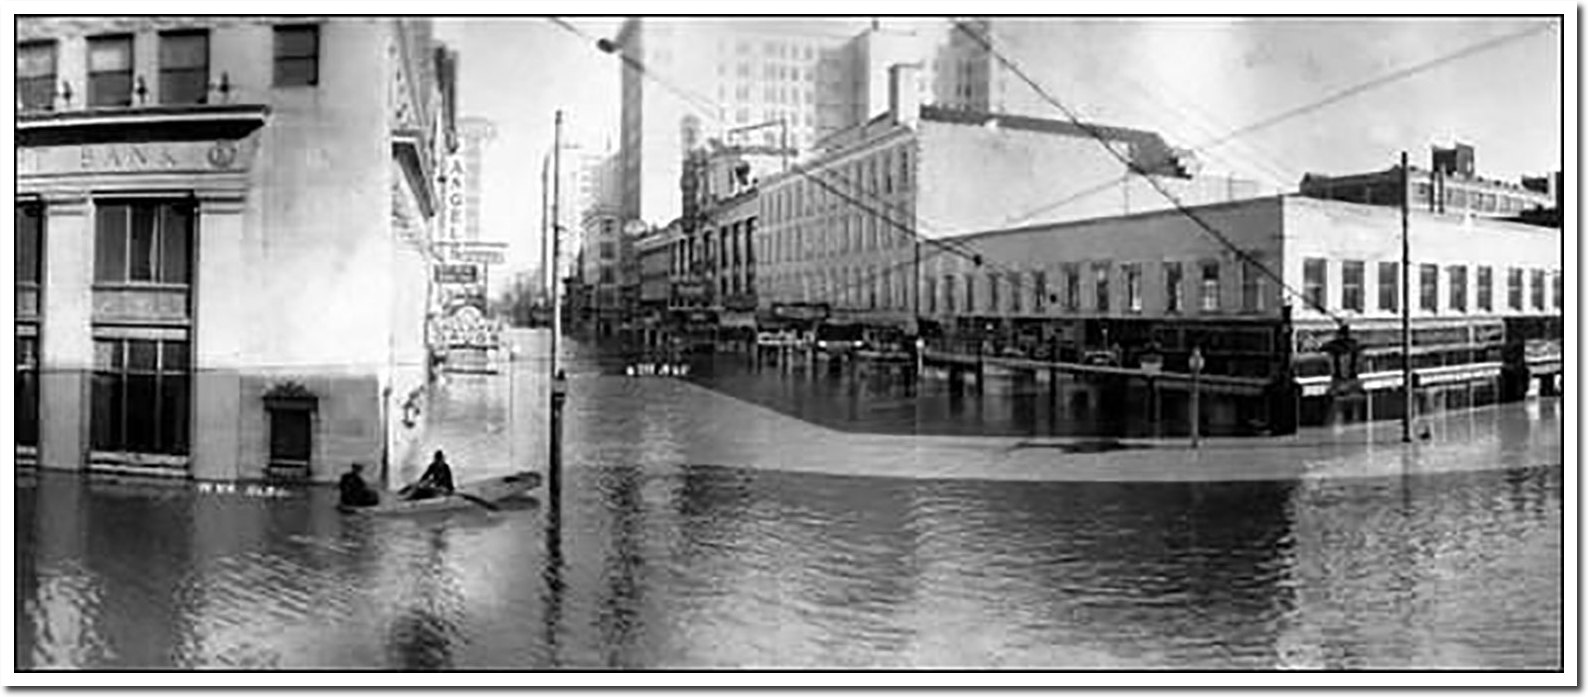
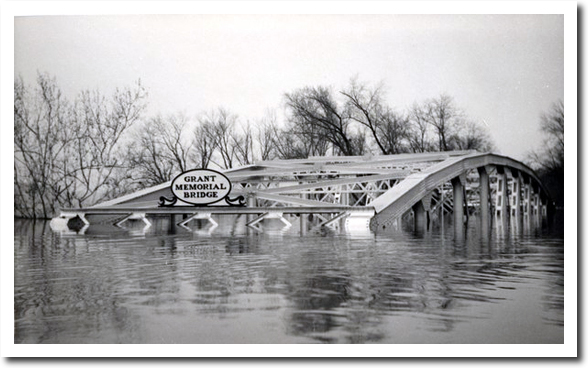
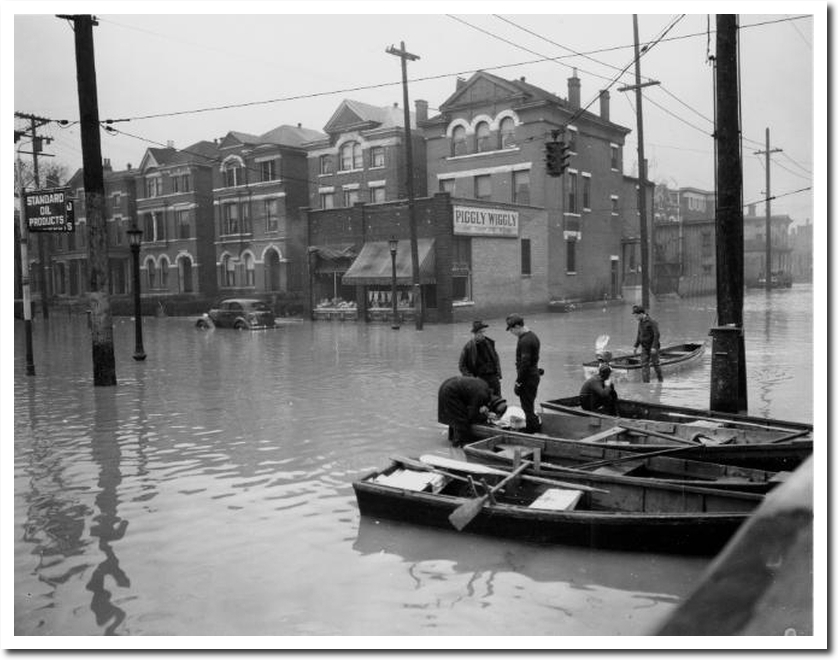
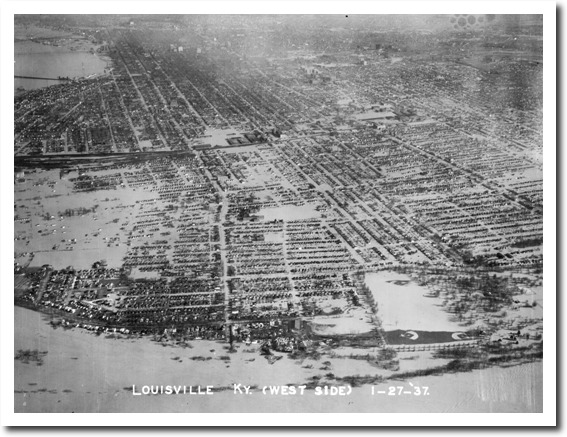
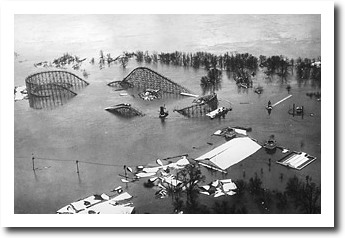
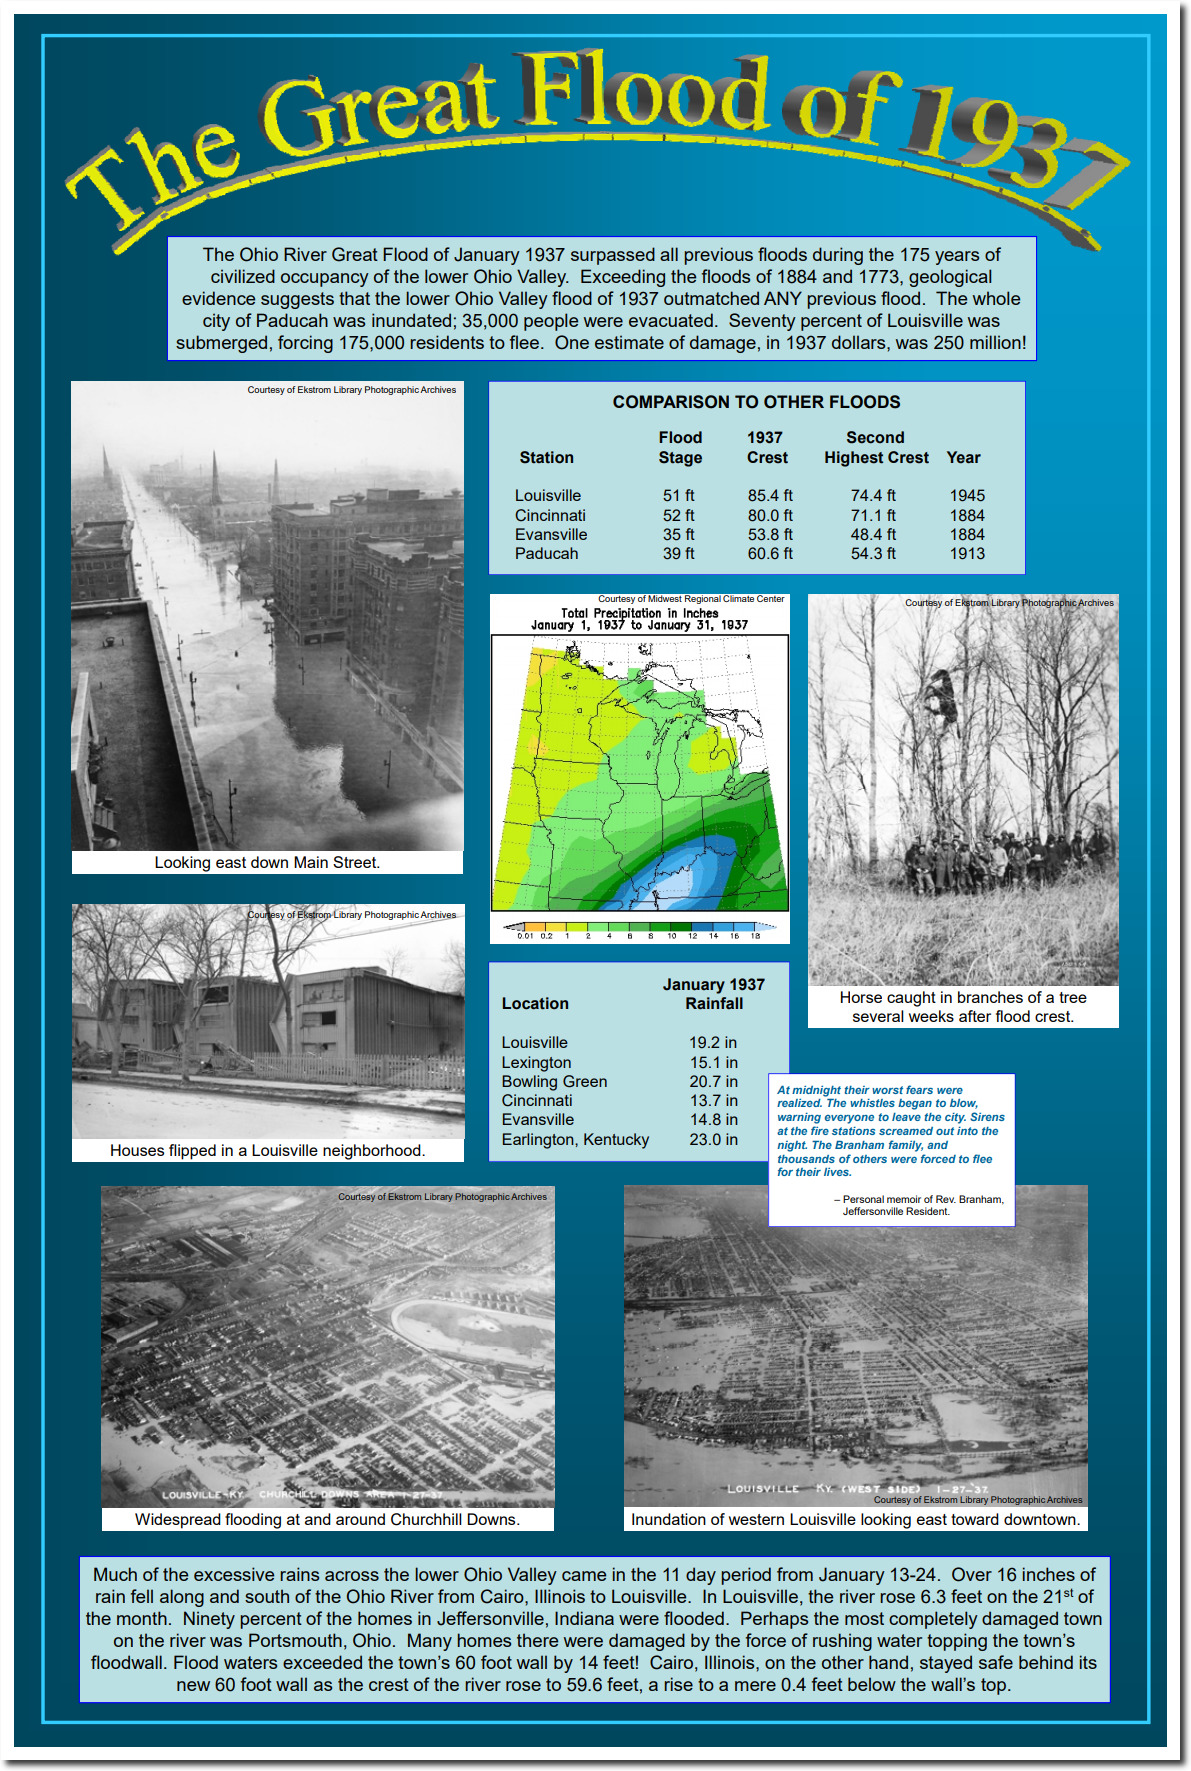
The following year brought record flooding to the Ohio Valley, an 85 foot crest on the Ohio River.
Seventy percent of Louisville was underwater.
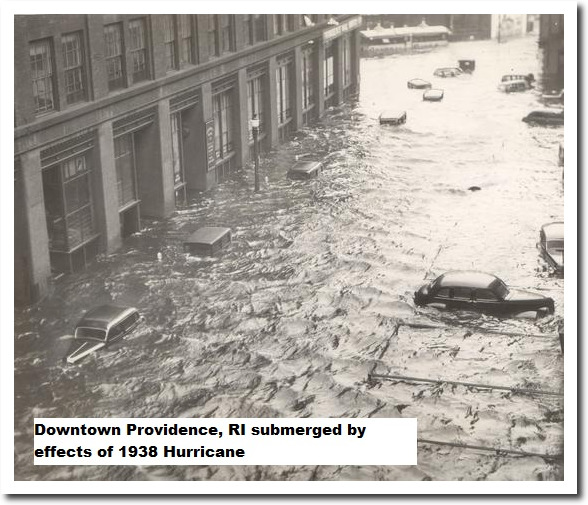
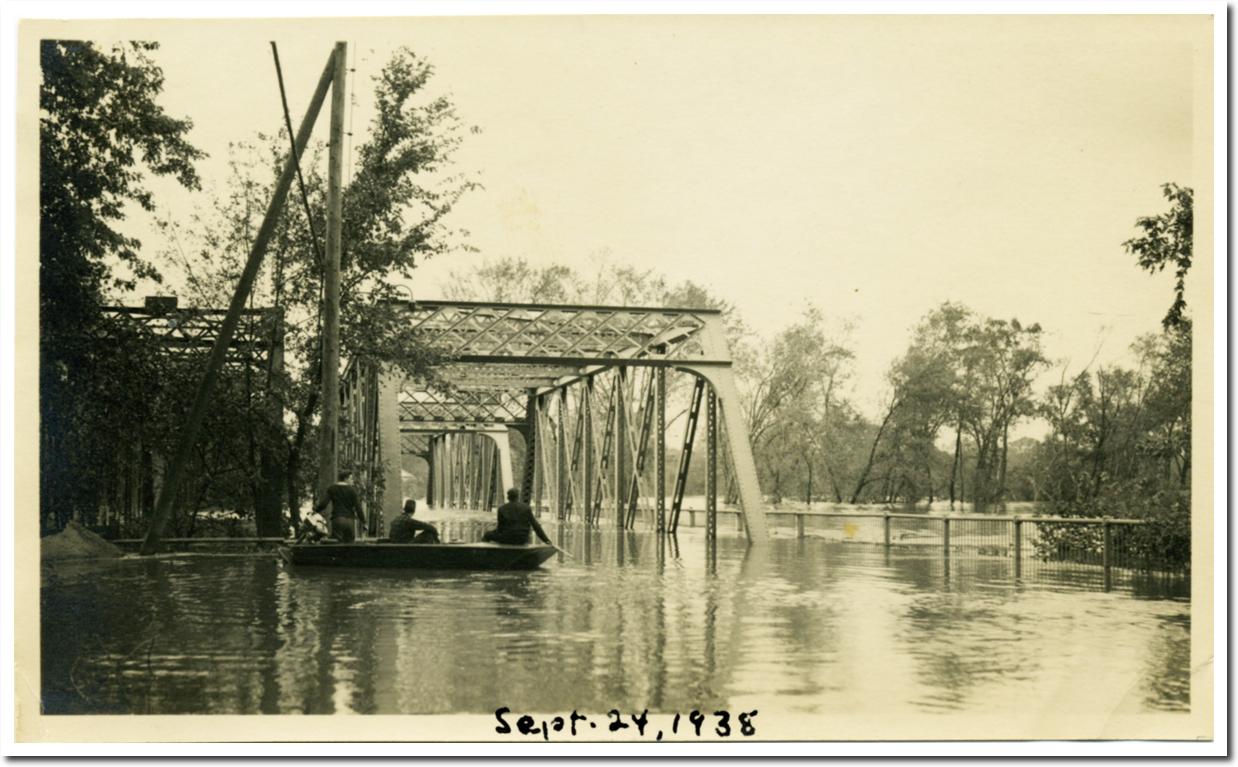
Then came the 1938 New England Hurricane, which missed narrowly missed Manhattan and was the most damaging storm on record in New England.
The weather was far more extreme from 1925 to 1938 than anything Americans have experienced recently, but very few people still have memories of that. Imagine the hysteria if we had a period of extreme weather like that now!
There is no indication that the climate is becoming more extreme, but lots of evidence that it is becoming less extreme. What is becoming more extreme is the misinformation, propaganda and lies from academics, journalists and politicians. President Eisenhower warned about this in his 1961 farewell speech.
The prospect of domination of the nation’s scholars by Federal employment, project allocations, and the power of money is ever present — and is gravely to be regarded.
Yet, in holding scientific research and discovery in respect, as we should, we must also be alert to the equal and opposite danger that public policy could itself become the captive of a scientific-technological elite.
– President Eisenhower January 17, 1961

