Orwellian Class Fraud At Scientific American

“He who controls the past controls the future. He who controls the present controls the past.”

  • George Orwell  1984

Scientific American claims that the 1970’s global cooling scare consisted of nine paragraphs in Newsweek in 1975.

How the “Global Cooling” Story Came to Be – Scientific American

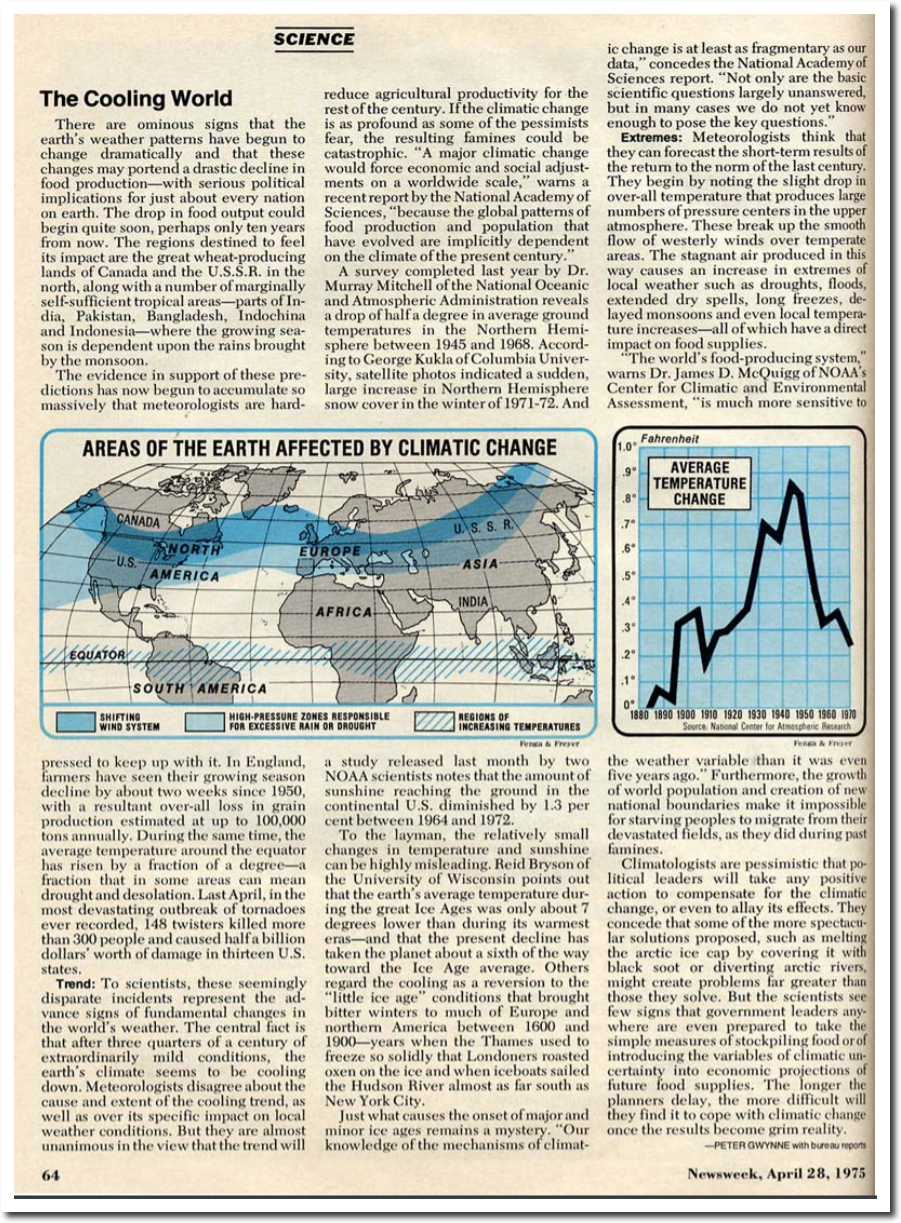
The Scientific American claim is rather incredible, given that the Newsweek article referenced specific people at NOAA, The National Academy of Sciences, and used temperature data from NCAR.

Newsweek April 28, 1975

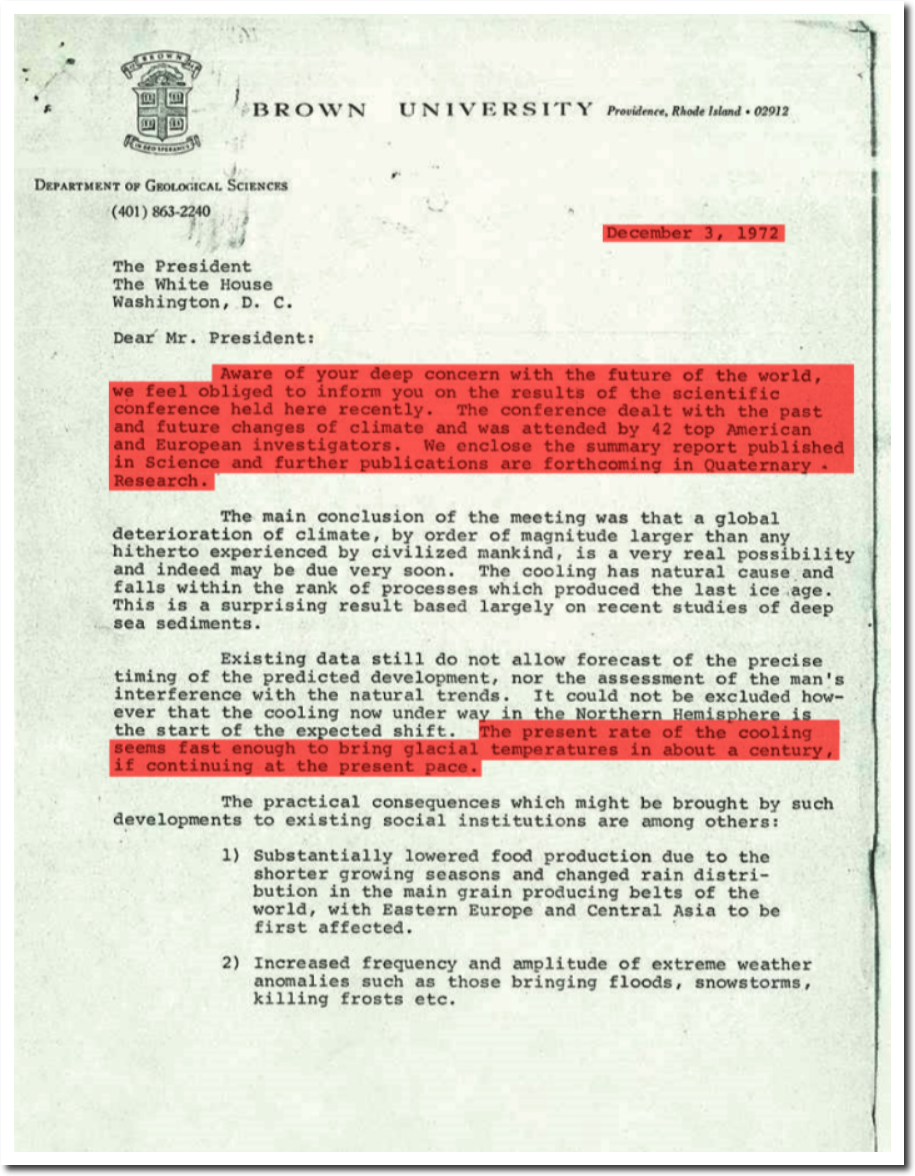
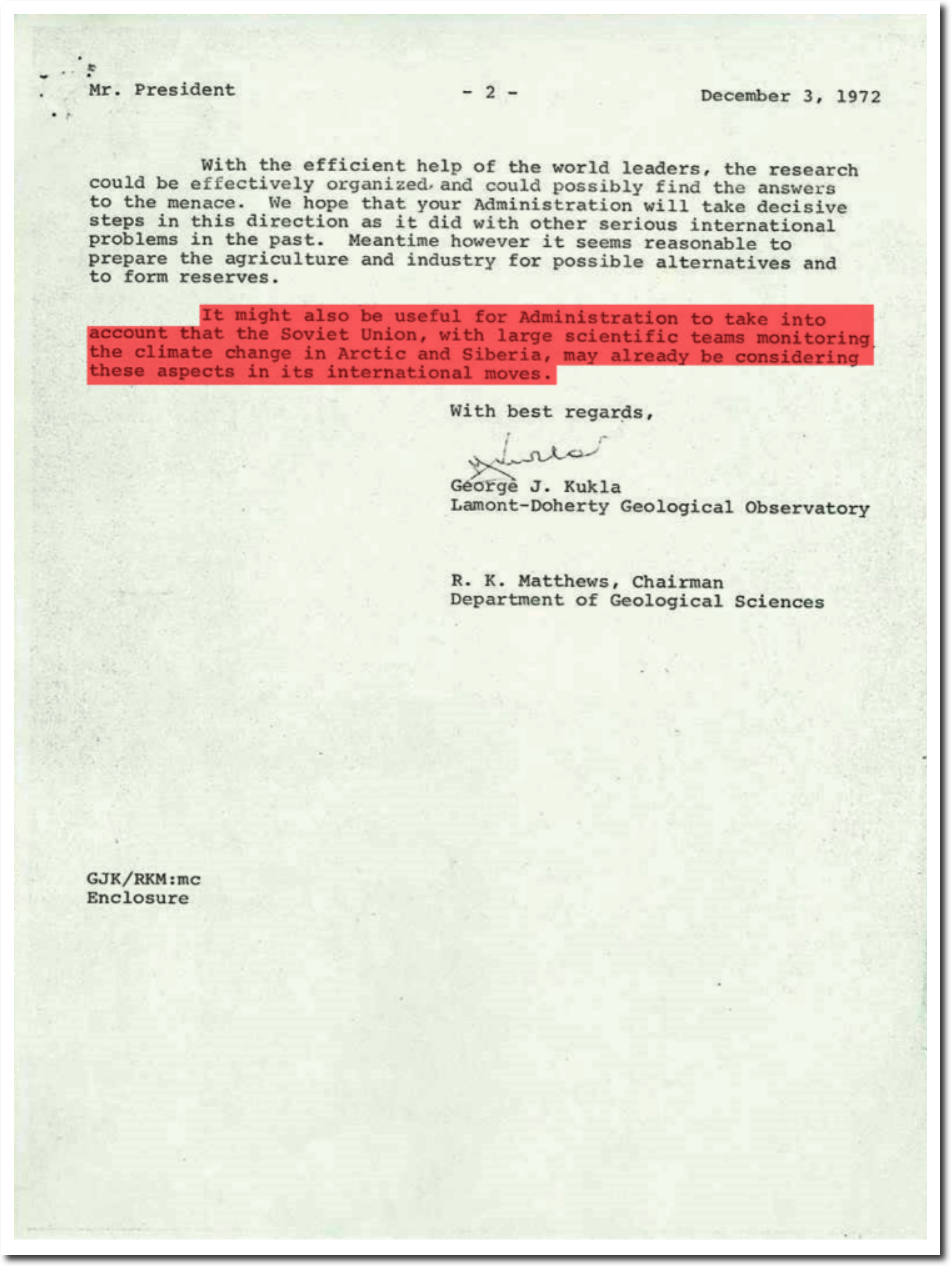
I could write an entire book of references to the 1970’s global cooling scare, but here are a few highlights. In 1972, “42 top American and European investigators” from the National Science Foundation wrote a letter to President Nixon warning of  a new ice age within a century.

NOAA Powerpoint  Slide 6

NCAR’s top people were warning of global cooling.

12 Jun 1974, Page 20 – at Newspapers.com

Obama’s future science adviser warned of  a new ice age.

Global ecology : readings toward a rational strategy for man / edited by John P. Holdren, Paul R. Eh… | National Library of Australia

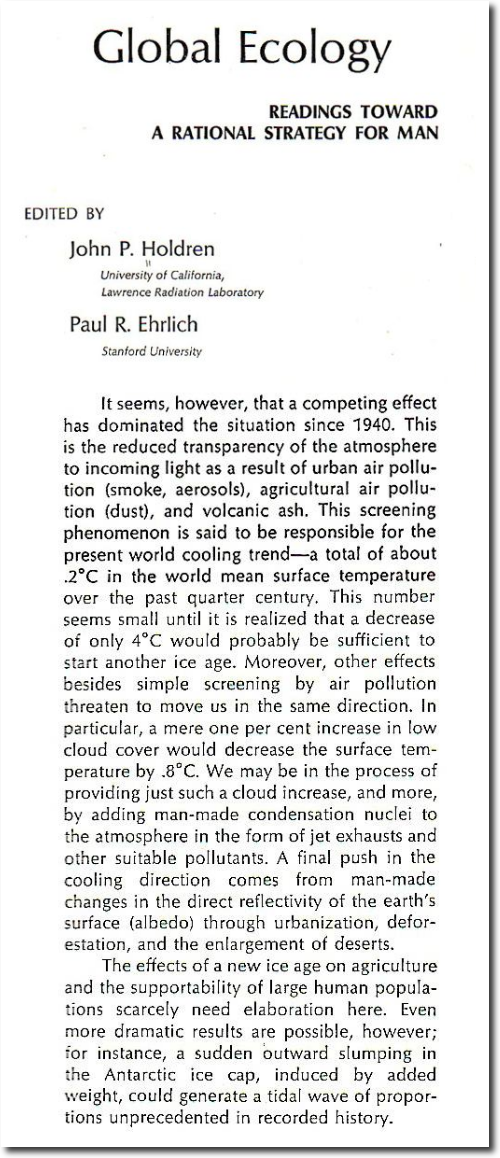
NASA’s top climatologist warned of a new ice age.

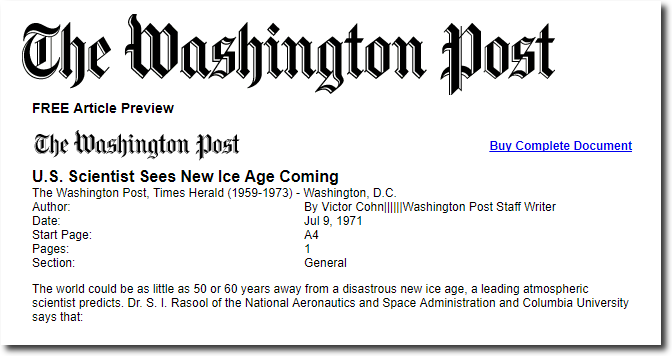
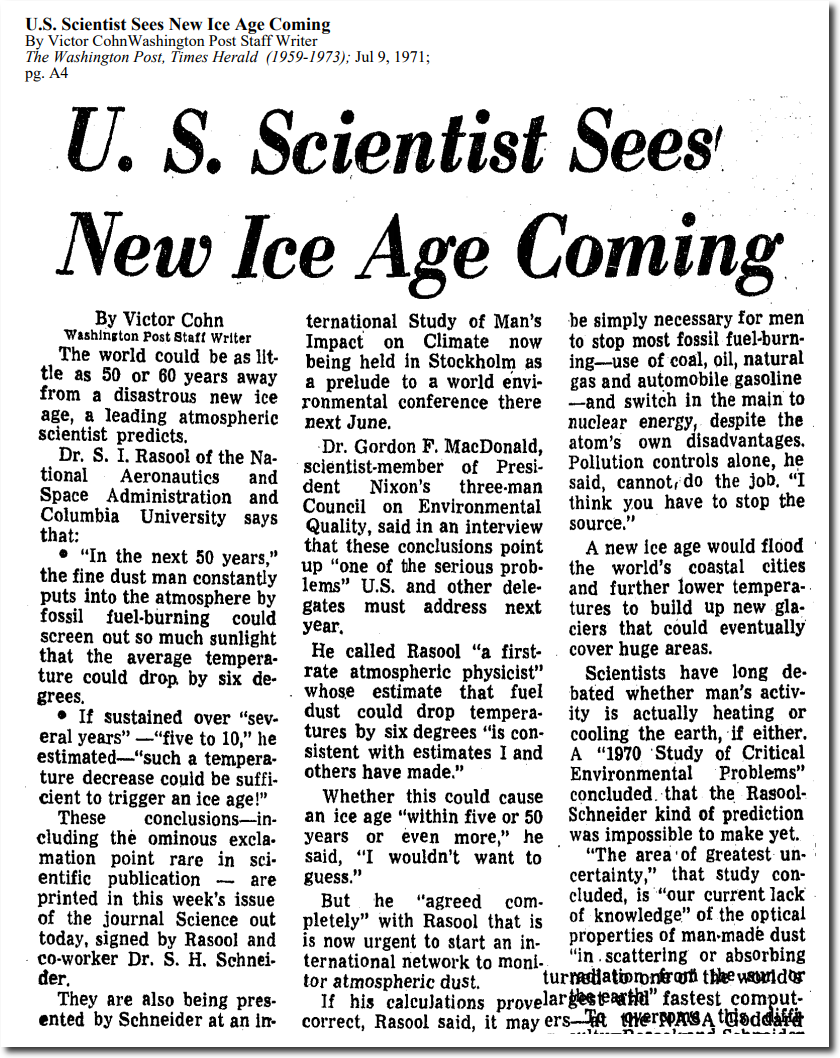
U.S. Scientist Sees New Ice Age Coming

Front Page of the New York Times, July 18, 1970. US and Soviet scientists were worried about Arctic cooling and expanding Arctic ice, and wanted to melt the Arctic by spreading coal dust on it.

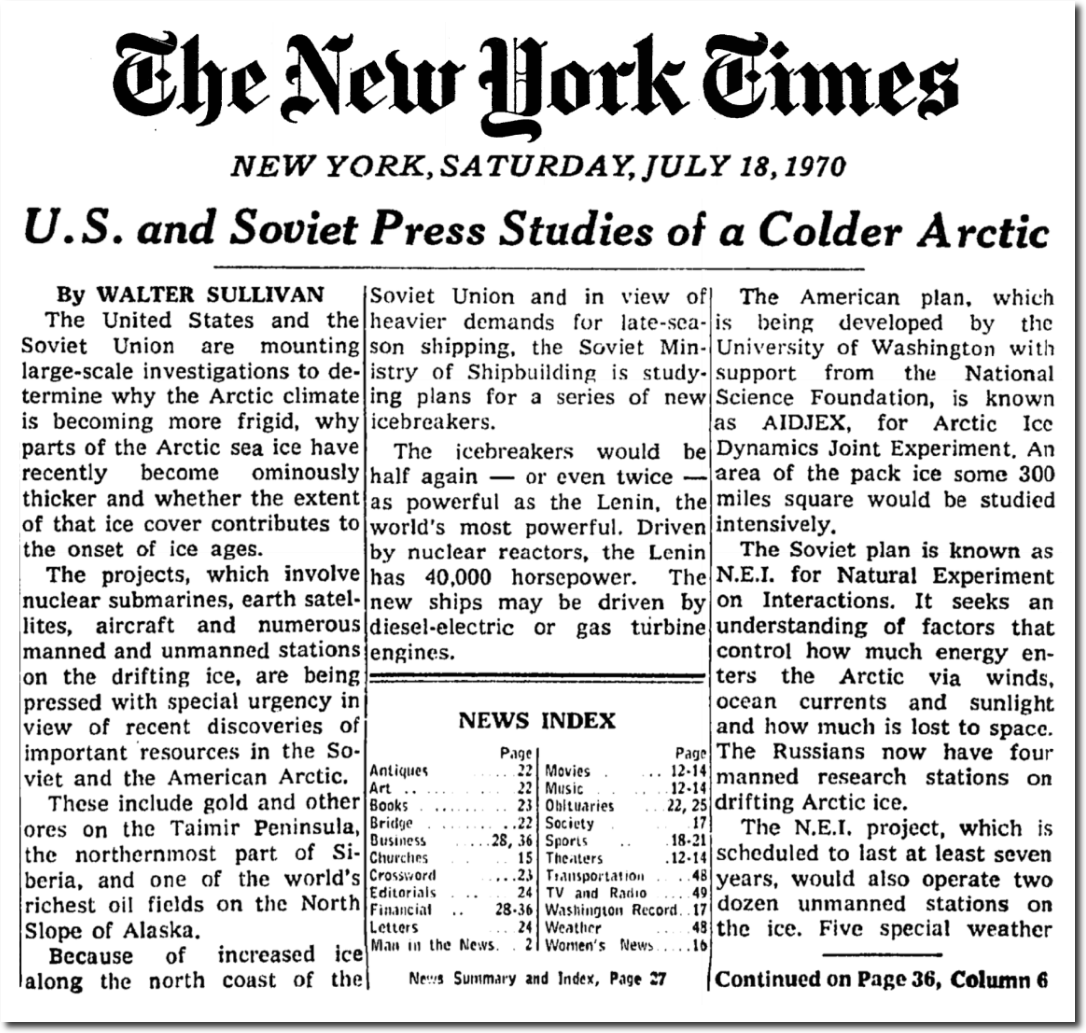
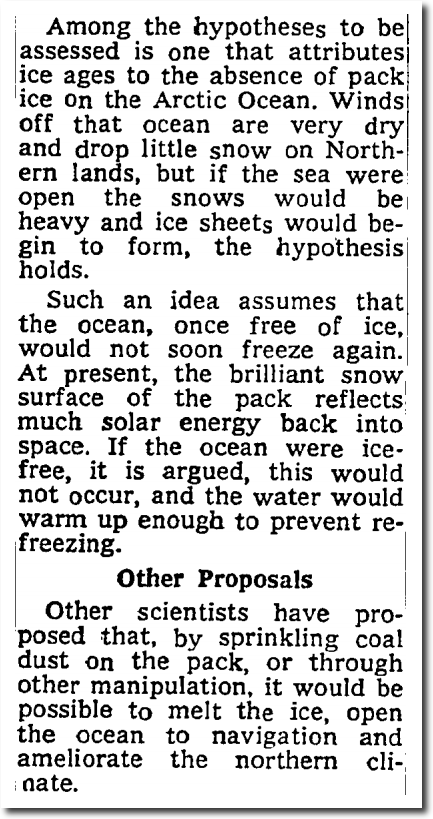
U.S. and Soviet Press Studies of a Colder Arctic – The New York Times

The National Academy of Sciences wanted to relocate six million people to save them from drought caused by global cooling.

TimesMachine: December 29, 1974 – NYTimes.com

In 1978, an international team of specialists saw no end in sight to the cooling.

The report, prepared by German, Japanese and American specialists, appears in the Dec. 15 issue of Nature, the British journal.

International Team of Specialists Finds No End in Sight to 30?Year Cooling Trend in Northern Hemisphere – The New York Times

In 1961, there was unanimous consensus among scientists that earth was cooling.

January 30, 1961 – NYTimes

The National Academy of Sciences showed the cooling, and warned that it could be serious within a century.

1975 National Academy Of Sciences Report

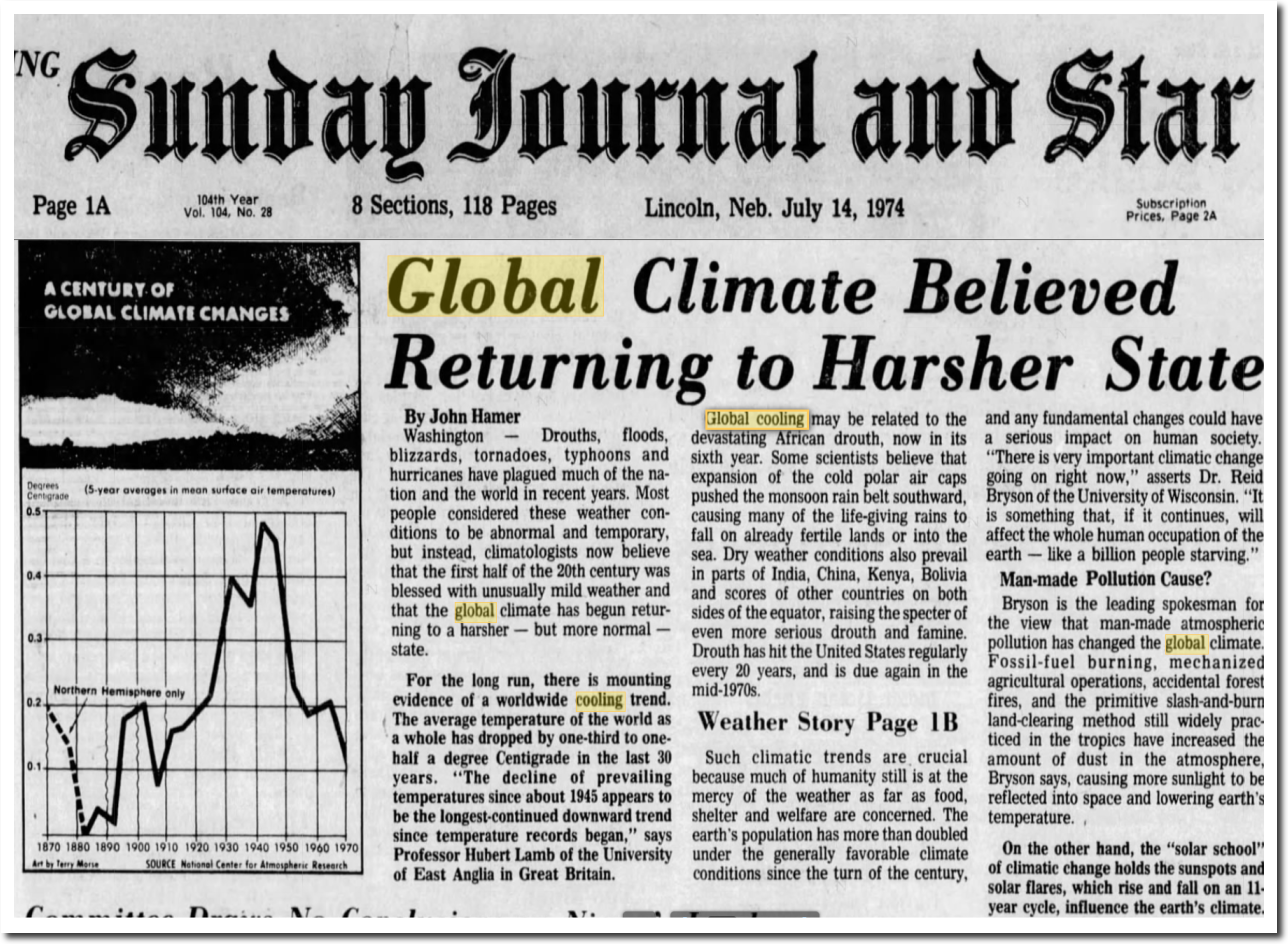
NCAR showed the cooling, and blamed drought, floods, blizzards, tornadoes and hurricanes on it.

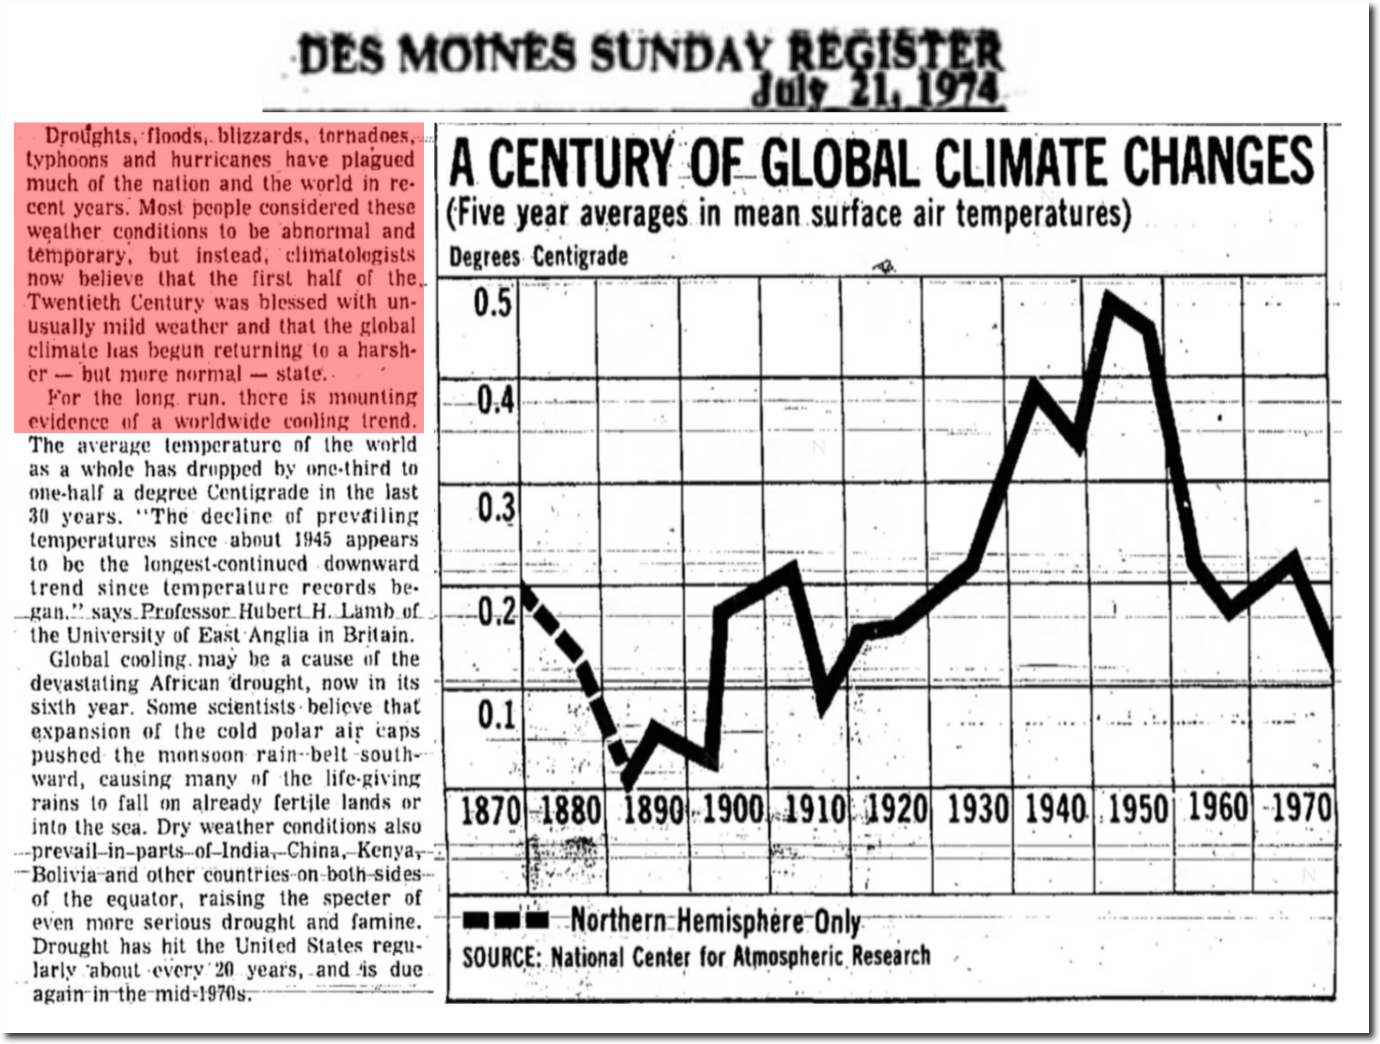
21 Jul 1974, Page 13 – The Des Moines Register at Newspapers.com

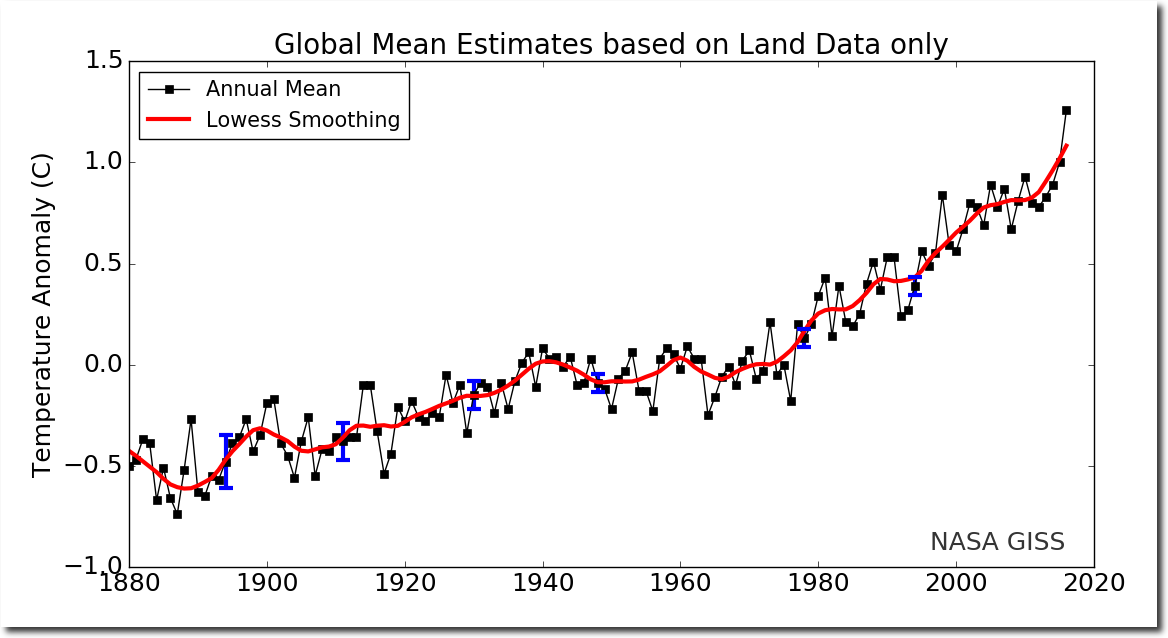
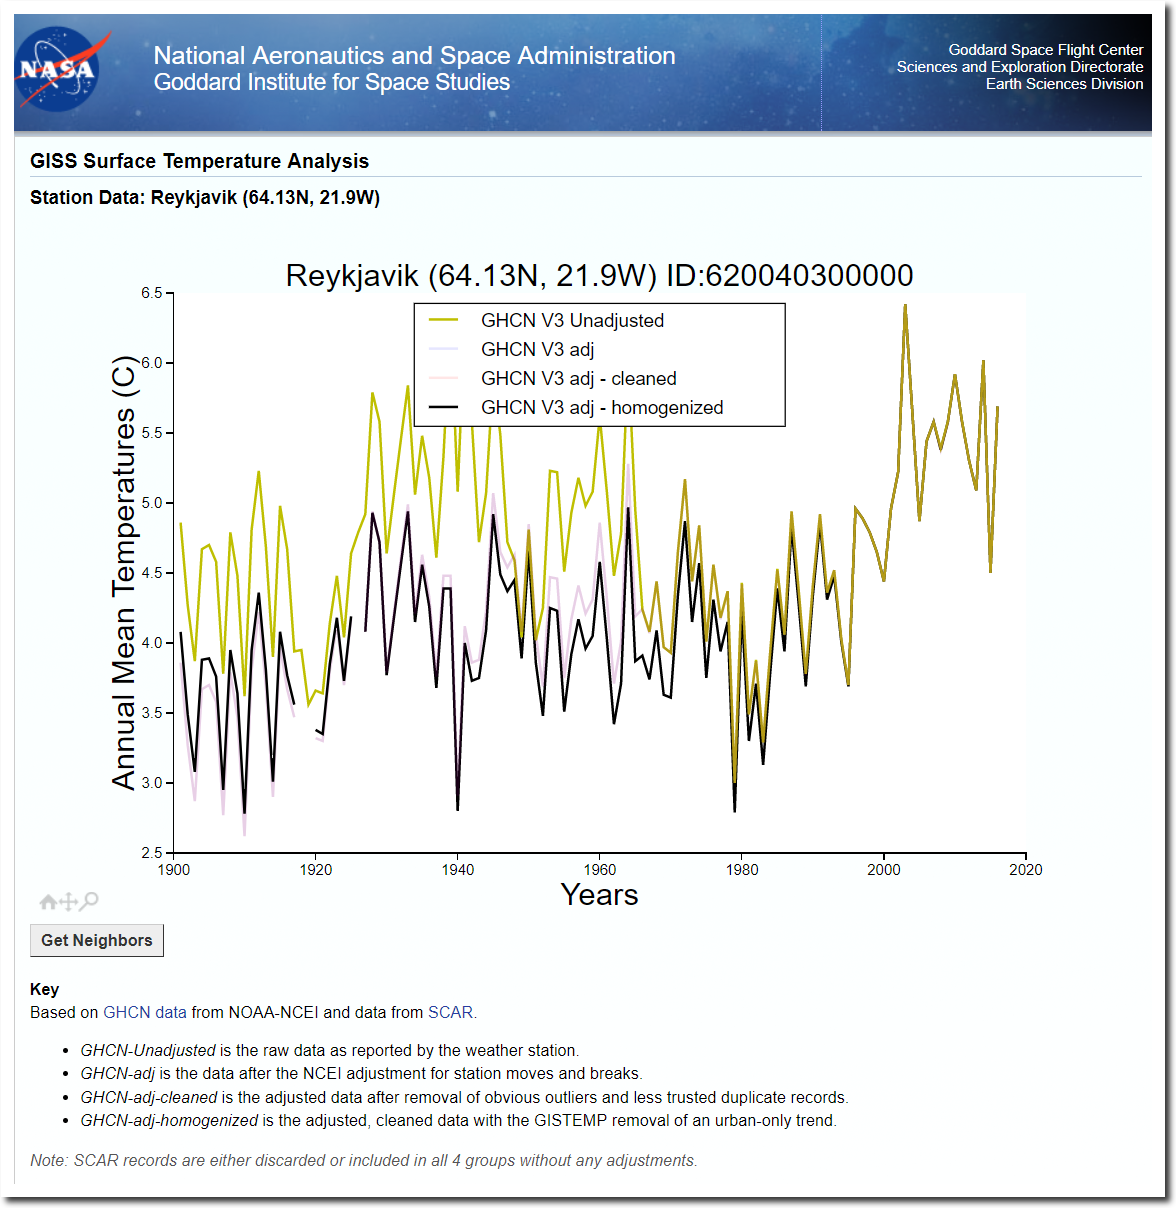
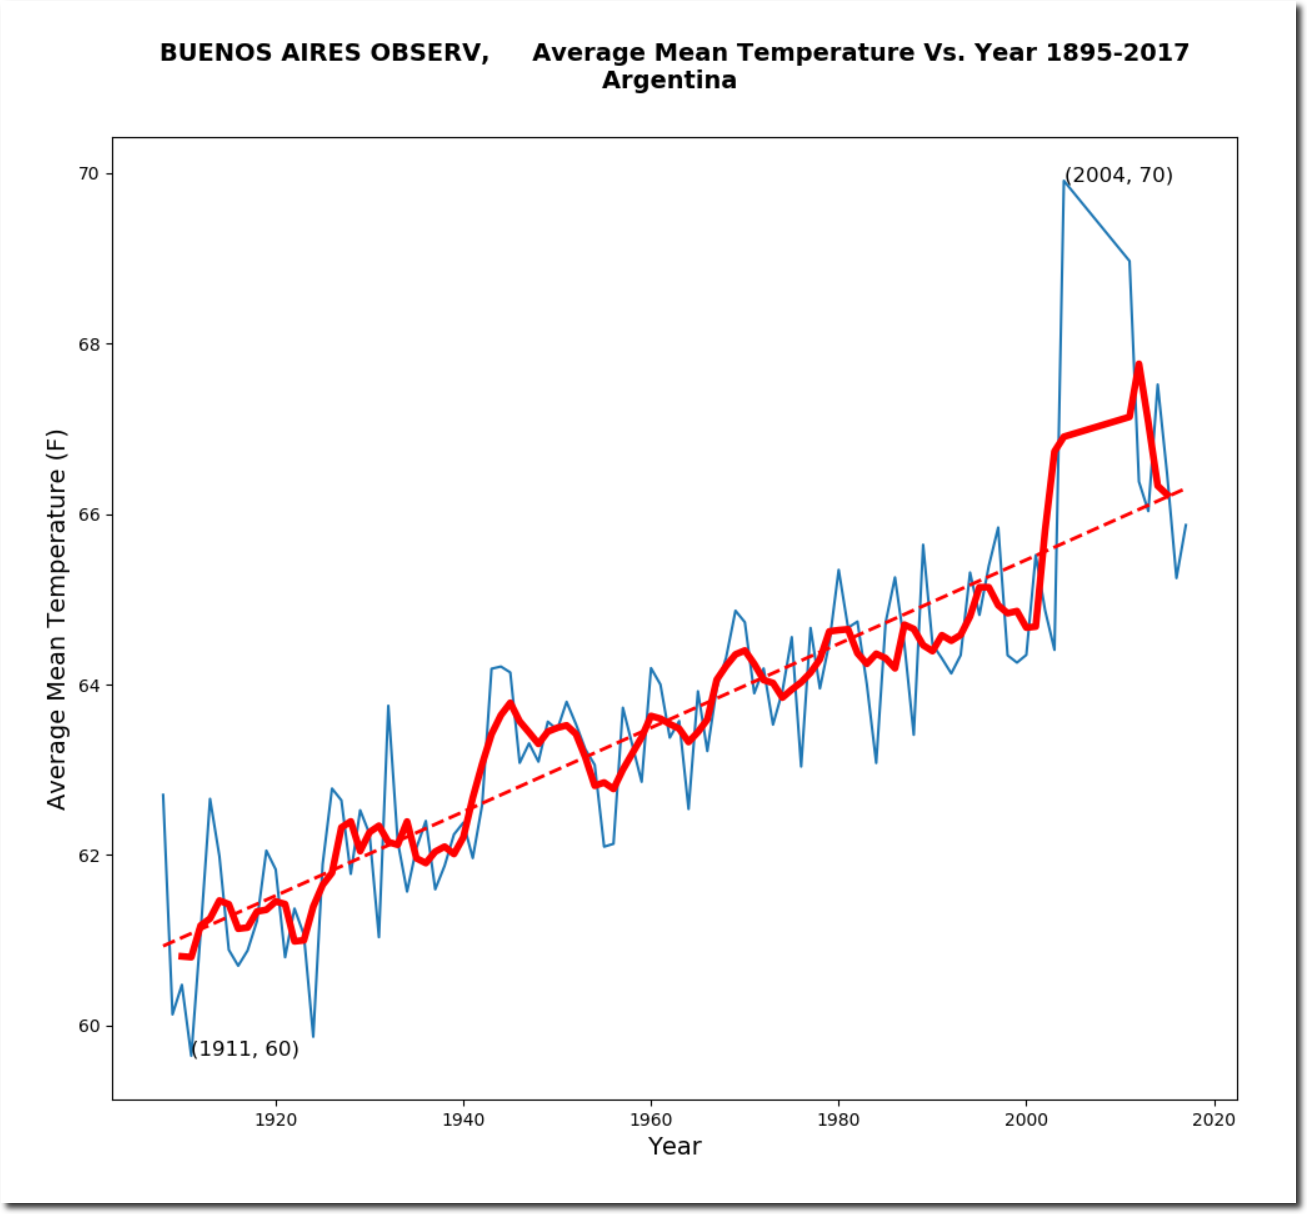
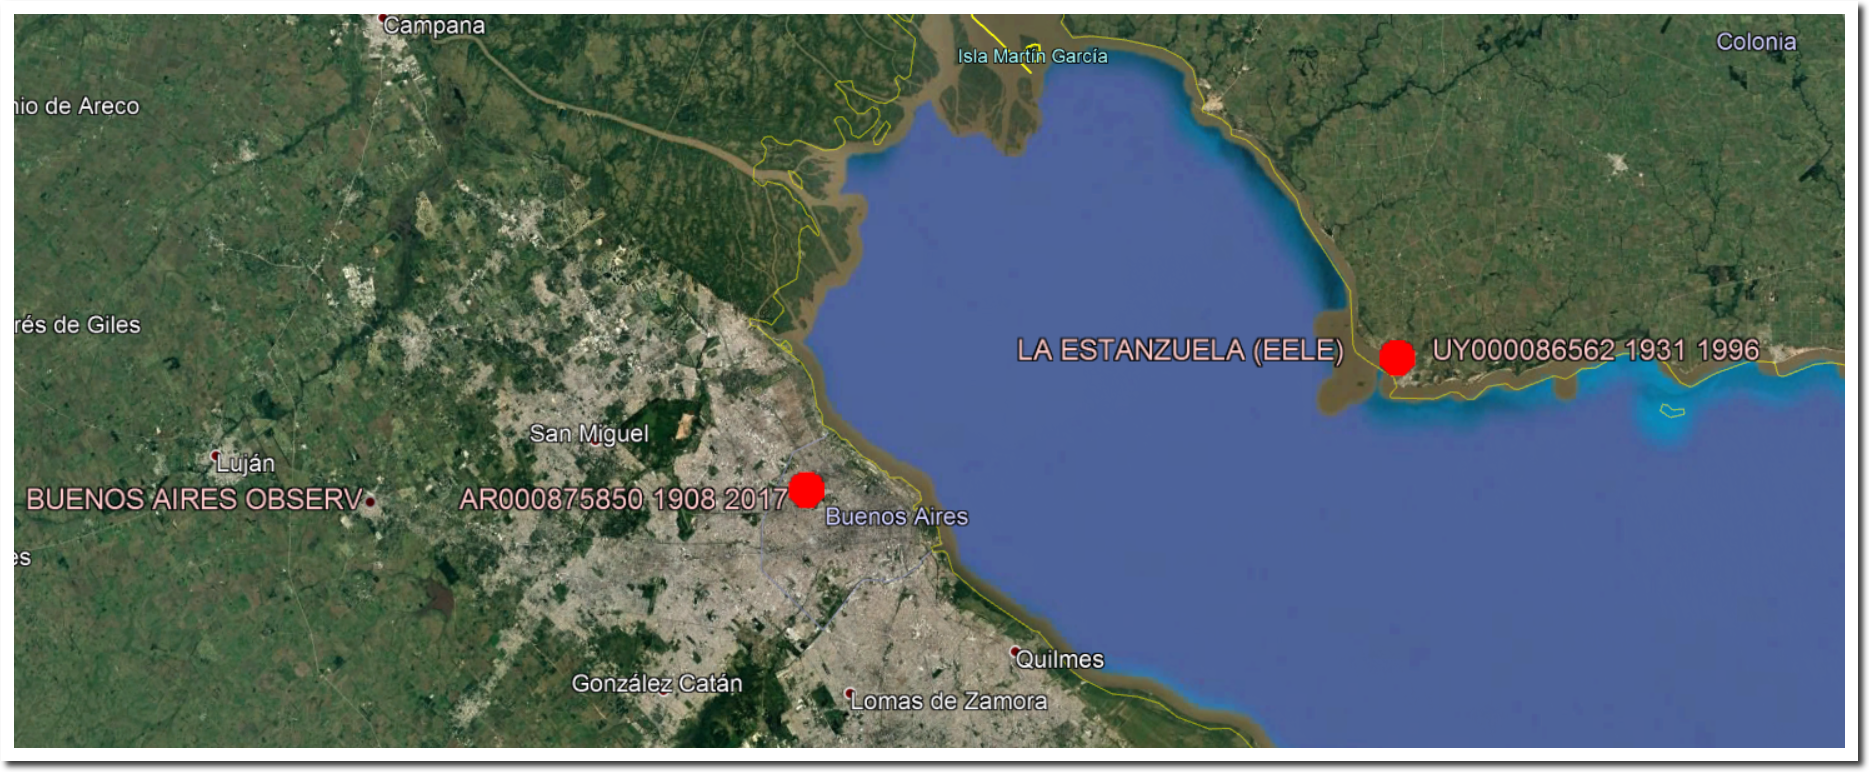
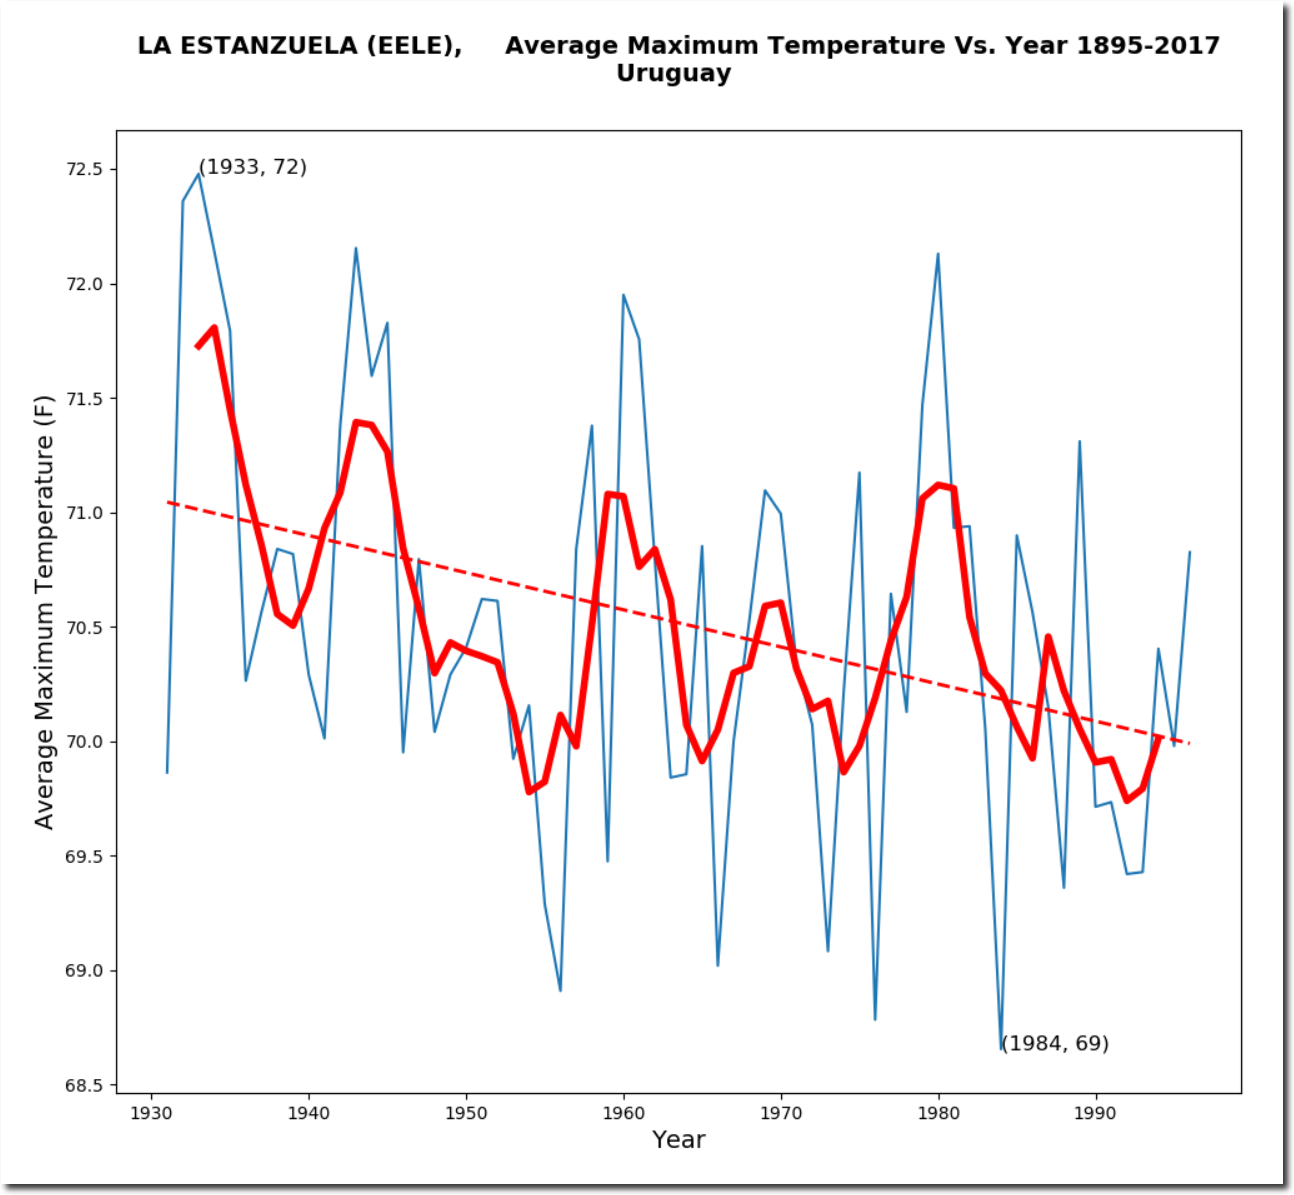
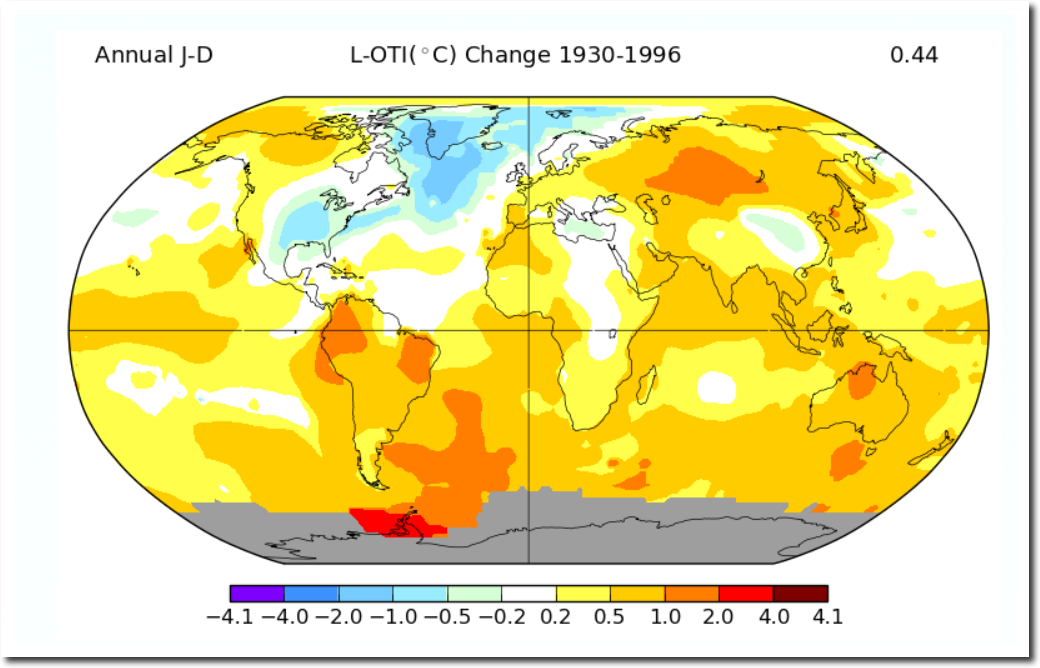
NASA has since (quite predictably) erased the cooling.

graph.png (1130×600)

The list above is just barely scratching the surface. As I mentioned, I could write an entire book on this topic.

Organizations which depend financially on global warming alarmism (like NASA and  Scientific American) have ramped up their lies and fraud to a level which was supposed to be fictional in Orwell’s novel 1984.

Posted in Uncategorized | Leave a comment

Distinguishing Global Cooling From Global Warming

Scientists say global warming causes droughts, floods, blizzards, typhoons, tornadoes, hurricanes and expansion of the polar vortex.

Forty years ago, scientists said global cooling causes droughts, floods, blizzards, typhoons, tornadoes, hurricanes and expansion of the polar vortex.

14 Jul 1974, 1 – The Lincoln Star at Newspapers.com

The symptoms of global cooling and global warming are identical. Which guarantees funding for the criminals known as government funded climate scientists.

Posted in Uncategorized | Leave a comment

Arctic Sea Ice Increasing For Eleven Years

Day 285 Arctic sea ice extent has been increasing since the start of MASIE records in 2006. This year is fifth highest since 2006.

fmasie_4km_allyears_extent_sqkm.csv

Meanwhile, criminals in the press and scientific community continue to report the exact opposite of what the data shows.

Posted in Uncategorized | Leave a comment

Eleven Years After The Demise Of Whistler

Eleven years ago, the fake news New York Times announced the demise of Whistler ski area due to global warming.

PROBLEMS AT WHISTLER – NYTimes.com

This year. Vail Resorts bought Whistler for one billion dollars, and Bloomberg declared it to be the best ski resort in North America.

Whistler, North America’s Best Ski Resort, Is About to Get Even Better – Bloomberg

The New York Times loves climate fake news. Three years ago they announced the end of snow everywhere.

The End of Snow? – The New York Times

Posted in Uncategorized | Leave a comment

45 Years Since Scientists Announced The End Of Warmth

03 Nov 1972, Page 6 – Standard-Speaker at Newspapers.com

Posted in Uncategorized | Leave a comment

Famous Lines From Democrats

I attended the Women’s March on DC, wearing a Make America Great Again hat. I got called every obscenity in the book. Later, a Democratic acquaintance told me :

You should have known better than to wear a Trump hat in Washington (the day after he was inaugurated)

Nothing has changed. In the 1960’s Democrats told black people that they should have known better than to use the white rest room.

Posted in Uncategorized | Leave a comment

“Worse Than Michael Mann”

Three years ago, Anthony Watts announced that I was worse than Michael Mann – because I said 40% of USHCN stations were missing. Anthony also conflated the frost point with the freezing point, as did many other commenters on his blog.

The Blackboard » How not to calculate temperature

Water freezes at 0C, but ice won’t accumulate on the surface until it the temperature gets below the current frost point.  This is because sublimation is happening faster than freezing. The frost point is determined by the partial pressure of H2O. The freezing point is independent, and is fixed at 0C. Same concept is true for CO2. The fact that a person doesn’t have any savings, doesn’t necessarily mean they aren’t getting paid. It just means they are spending money faster than they are making it.

No matter how many times I tried to explain this simple concept, I couldn’t make any headway. I have had to put up with this nonsense for almost a decade.

I still have people throwing Anthony’s comment at me.

On average, 43% of the 1218 USHCN stations report no monthly temperatures, and are marked with an “E”. i.e. they are missing from the USHCN database. This is up from less than 11% in 1991.

ftp://ftp.ncdc.noaa.gov/pub/data/ushcn/v2.5/ushcn.tavg.latest.FLs.52j.tar.gz

I’m working very hard to get the message of data tampering out, and often have to fight people on both sides of the imaginary climate change debate.

Posted in Uncategorized | Leave a comment

NOAA/NASA Iceland Fraud – Worse Than It Seems

I’ve blogged numerous times about NOAA and NASA erasing the 1940’s warmth in Iceland.

Data.GISS: GISS Surface Temperature Analysis

The CIA knew about the 1930s-1940’s warmth in Iceland and subsequent cooling.

a number of climatologists are in agreement that the northern hemisphere, at least, is growing cooler.*

–Iceland, because of its location, is a good indicator of changes in the whole Northern Hemisphere. The weather records and evidence for Iceland indicate that the past 4 decades were the most abnormal period in the last 1000 years–much much warmer. (See Figure 4.)

–The arctic ice area has perceptibly increased
in the past few years.

–The English growing season has been
shortened by a week or more since the 1940’s.

potentialtrends.pdf

Iceland warmth in the 1940’s wrecked the global warming story, so climate fraudsters at NOAA and NASA simply erased it.

But the Iceland story is much worse than it seems. NOAA only has daily temperature data for Reykjavik going back to 1949.

ftp://ftp.ncdc.noaa.gov/pub/data/ghcn/daily/all/IC000004030.dly

In fact, NOAA has no daily temperature data for any Iceland station prior to 1944, and none from 1945, 1946, 1947 or 1948. So what is the basis for their data tampering? Whatever it is, it has nothing to do with science.

Posted in Uncategorized | Leave a comment

Mosher Busted By Gavin Schmidt, Zeke Hausfather And Nick Stokes

Mosher is afraid to come over here, and is posting more nonsense on WUWT.

Dirty bird carcasses tell the story of how air pollution has improved in the last 100 years | Watts Up With That?

Mosher’s stupidity and dishonesty is impressive.

4. I spent way too much time with his old code, could not find a single line supporting any of the graphs

His inability to analyze and run code which thousands of other people have used is very telling, but quite believable for the crew of incompetents at Berkeley Earth.

Plus, he is using a TINY subset of data to cherry pick his results. There are 19000 Stations in the US he ignores and 42000 stations in the rest of the world he ignores

The USHCN data set (which NOAA has been using for decades) is about 1200 stations which were chosen because of the quality of the stations. I didn’t choose them, NOAA did. Gavin says you only need half that many.

Gavin Schmidt: Global weather services gather far more data than we need. To get the structure of the monthly or yearly anomalies over the United States, for example, you’d just need a handful of stations, but there are actually some 1,100 of them. You could throw out 50 percent of the station data or more, and you’d get basically the same answers.

NASA Climatologist Gavin Schmidt Discusses the Surface Temperature Record

There is no reason to use more US stations. The quality of the USHCN stations is infinitely superior to the garbage set of global stations which Berkeley Earth uses. Mosher’s argument is idiotic, at best.  And as Nick Stokes and Zeke have explained, there is very good reason not to use all of the US stations. It is called “changing station composition.

The number of US GHCN stations has changed dramatically over time.

Stations are being added at more southerly locations.

The quality of reporting at the new stations has been declining.

Even if you use all of the US GHCN stations, you get basically the same pattern. The frequency of hot days is declining.

A better experiment would be to use all US GHCN stations which have been continuously active over the past century. This eliminates the problem of changing station composition, and produces results almost identical to the USHCN data set. Maximum temperatures are declining, as is the frequency of hot days.

The addition of a large number of US GHCN stations in the 1950’s (mostly at lower latitudes) introduced about 0.3F warming bias.


There is very good reason not to use all of the US GHCN stations. Mosher has no clue what he is talking about, and is directly contradicting Zeke and Nick about changing station composition.

No matter how many times Mosher and his friends lie about it, there is no correlation between CO2 and hot weather.

And I’m not ignoring the complete set of global stations. Quite the opposite. I’m documenting that they don’t exist. Without daily temperature data, GHCN station data is illegitimate.  There is no such thing as a monthly thermometer.

Posted in Uncategorized | Leave a comment

The Completely Worthless Global Temperature Record

NOAA has no daily temperature records for any location in South America prior to 1908. From 1908 to 1931, they had only one station – at Buenos Aires. One of the worst urban heat island contaminated thermometers on Earth.

That thermometer showed a lot of warming over the past century.

In 1931, South America got another thermometer, across the bay in Uruguay. Now there were two thermometers with daily temperature records for the entire continent.

That thermometer showed a lot of cooling while it was active through 1996.

Given that the more rural station showed cooling, it would make sense to believe that part of South America was cooling from 1930 to 1996, and that Buenos Aires warming was a local effect caused by urbanization.

But the fraudsters at NASA and NOAA show warming.

Data.GISS: GISS Surface Temperature Analysis: Global Maps from GHCN v3 Data

Facts don’t fit the global warming agenda. There is no NOAA daily temperature data for South America prior to 1908, the data from 1908 to 1931 is from a single UHI contaminated station, and from 1931 to 1996 NOAA/NASA show non-existent warming.

Junk science doesn’t get any worse than this.

Posted in Uncategorized | Leave a comment