October 1871 – Worst Fires In US History

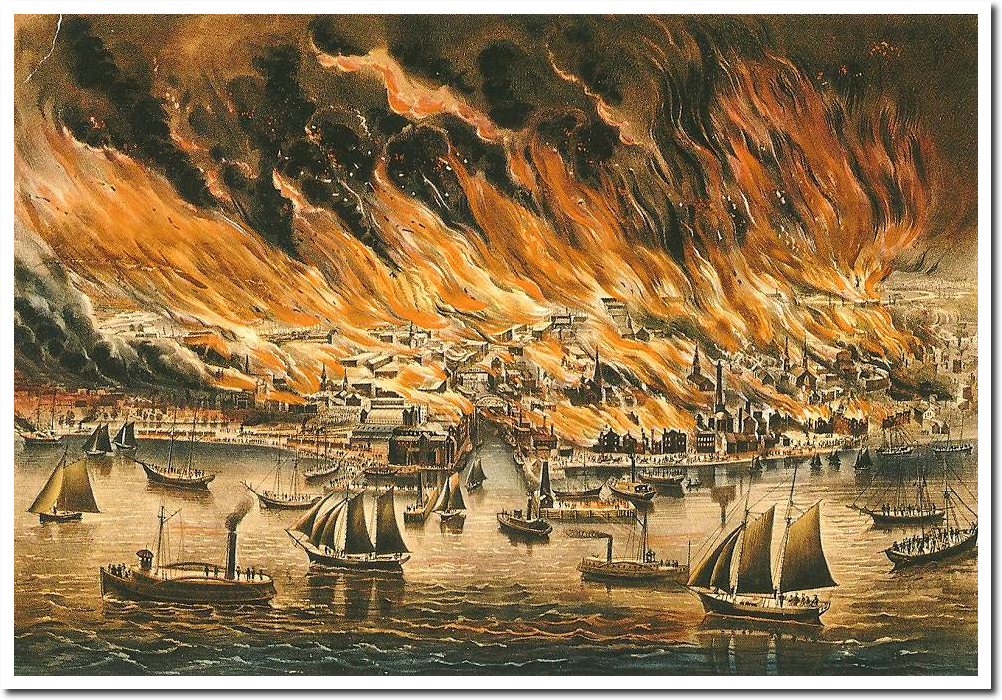
Most people have heard of the Great Chicago Fire of 1871, but there were much worse fires burning at that time. Thousands of people were killed by massive fires in Wisconsin, Michigan and Ontario. There were also huge fires burning in the Rocky Mountains.

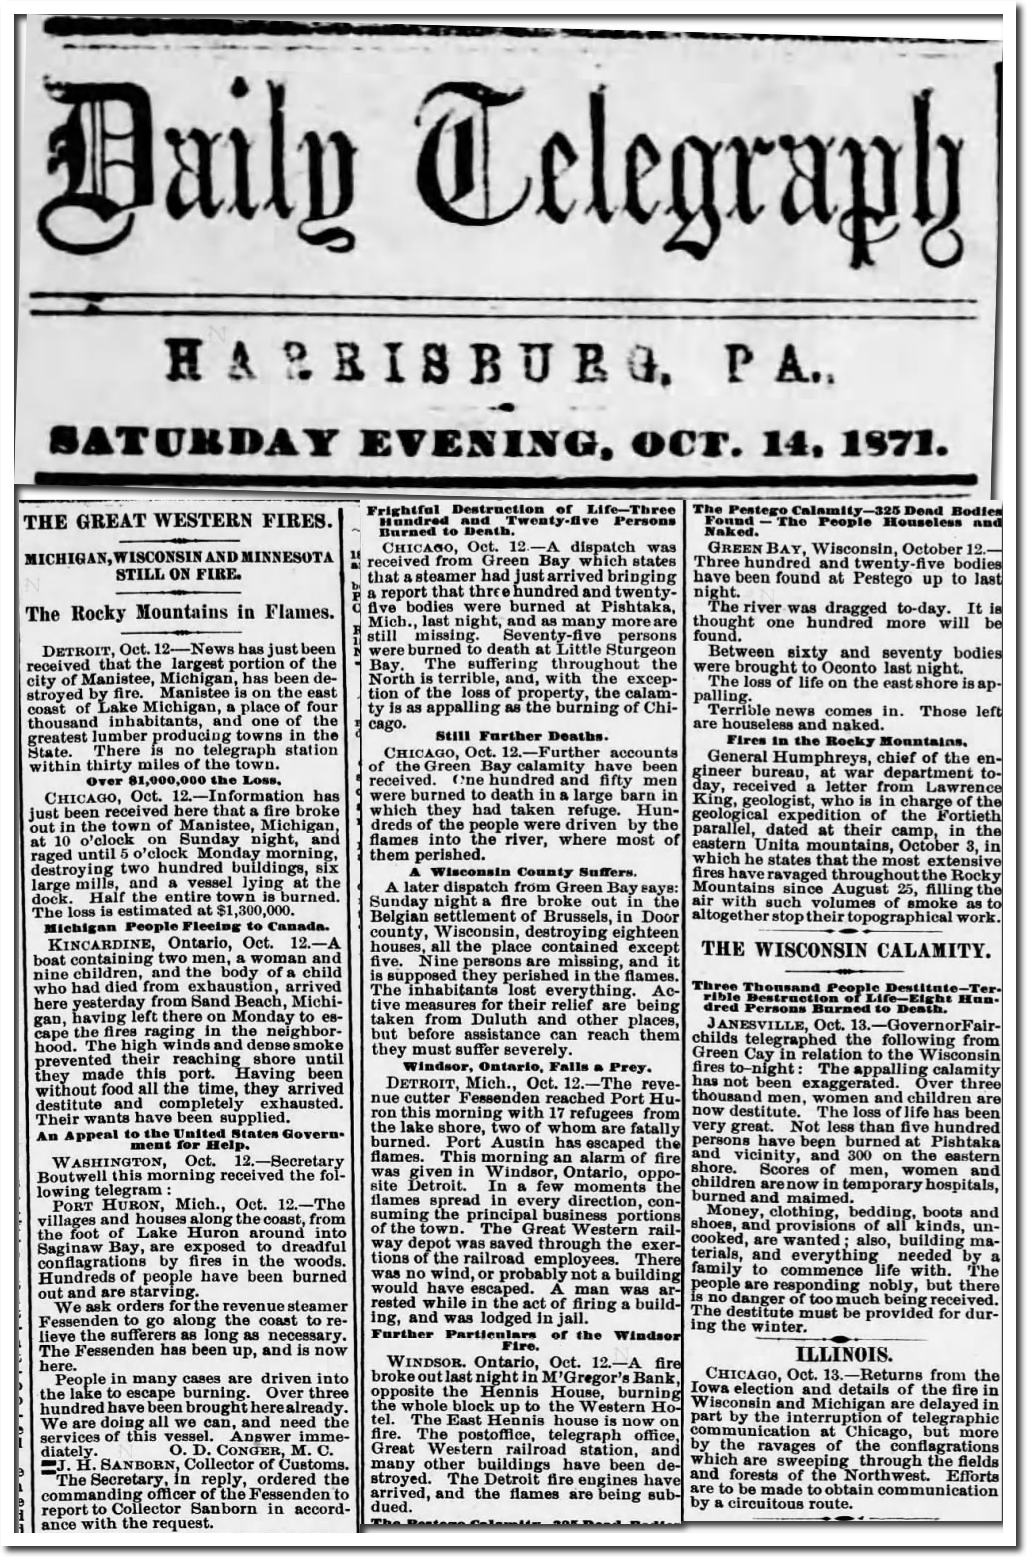
14 Oct 1871, Page 2 – Harrisburg Telegraph at Newspapers.com

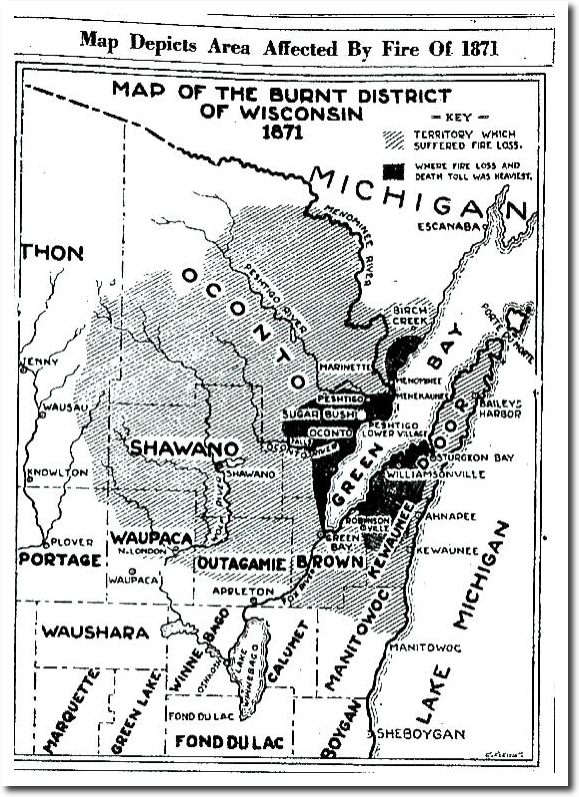
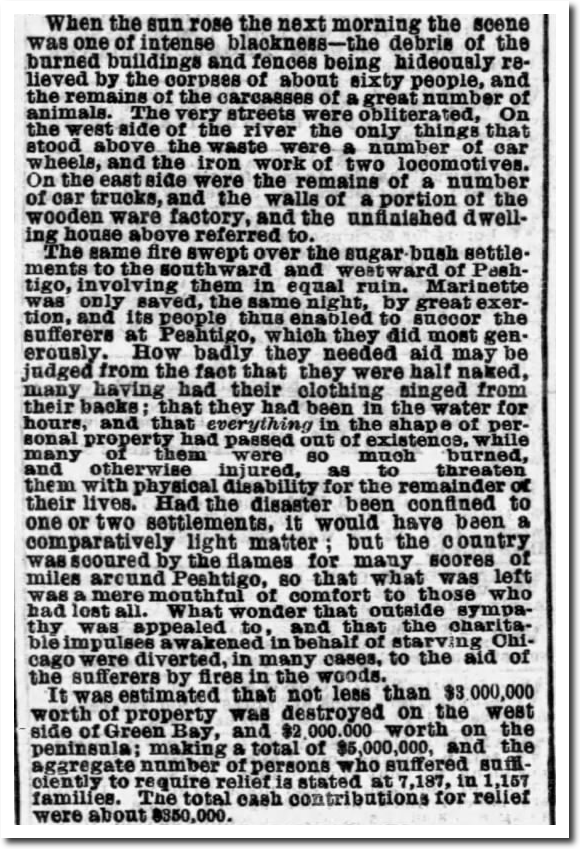
The worst of these fires occurred at Peshtigo, Wisconsin, which killed more than 1,000 people.

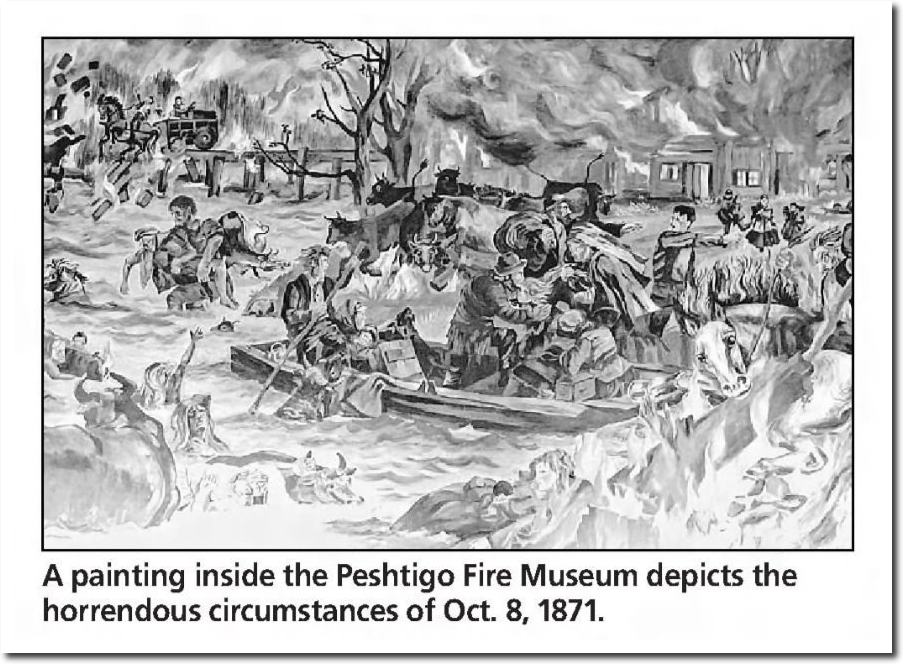
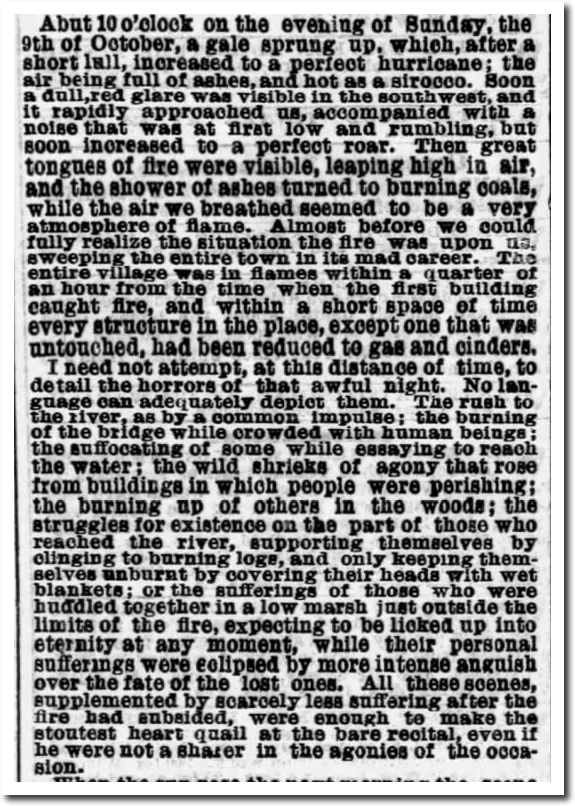
The fire was fanned by a 12 mile wide “hurricane” which knocked many trees down and blocked escape from the city.


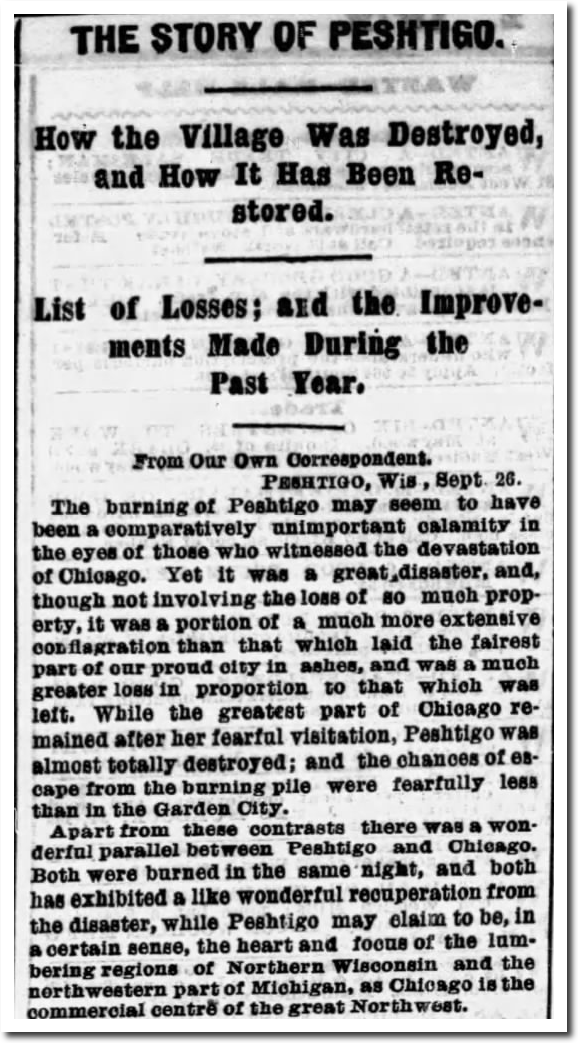
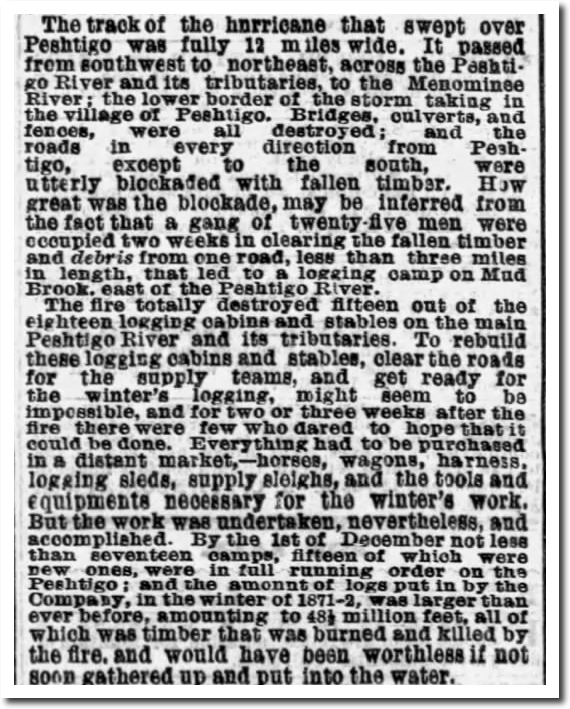
02 Oct 1872, Page 6 – Chicago Tribune at Newspapers.com

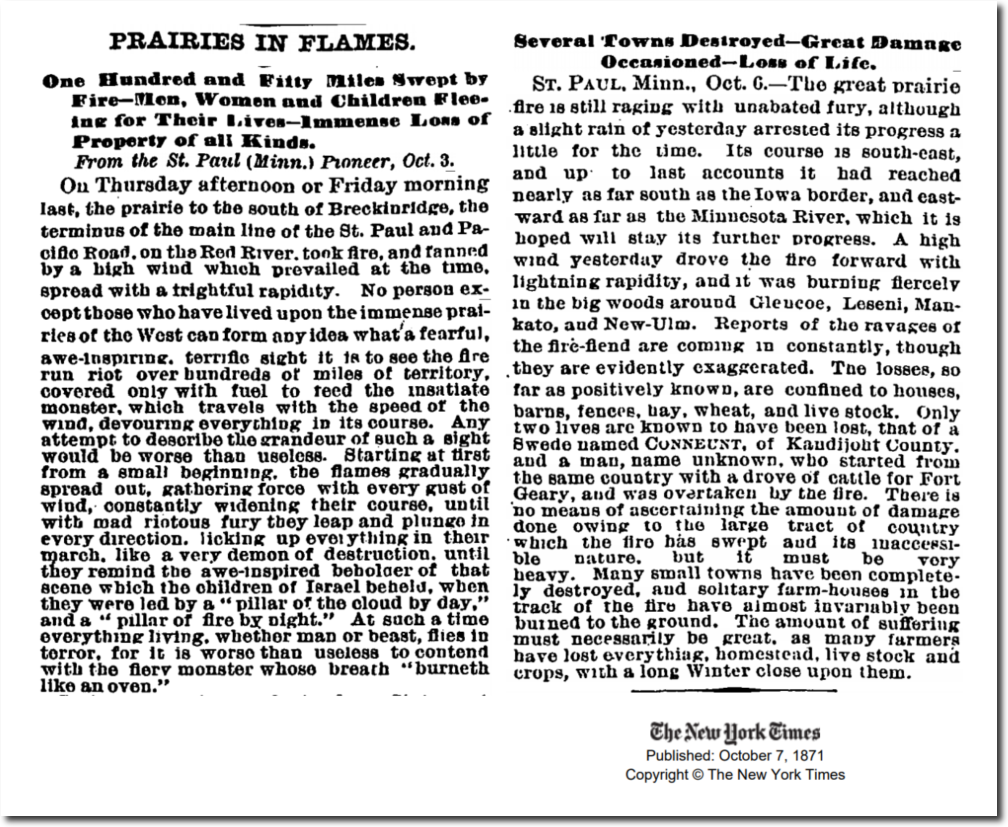
Minnesota was also on fire.

PRAIRIES IN FLAMES. – One Hundred and Fifty Miles Swept by Fire–Men, Women and Children Fleeing for Their Lives–Immense Loss of Property of all Kinds. Several Towns Destroyed–Great Damage Occasioned–Loss of Life. – View Article – NYTimes.com

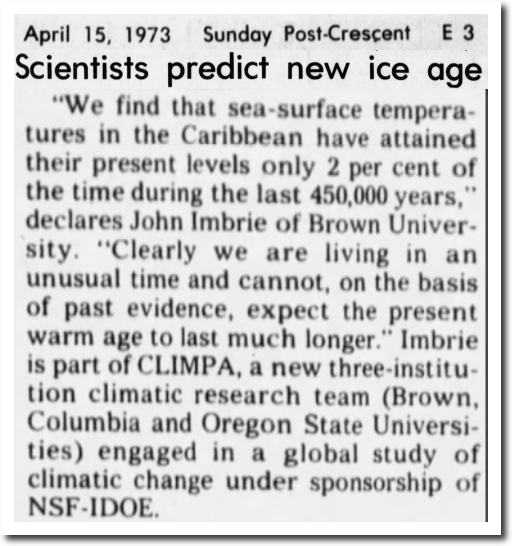
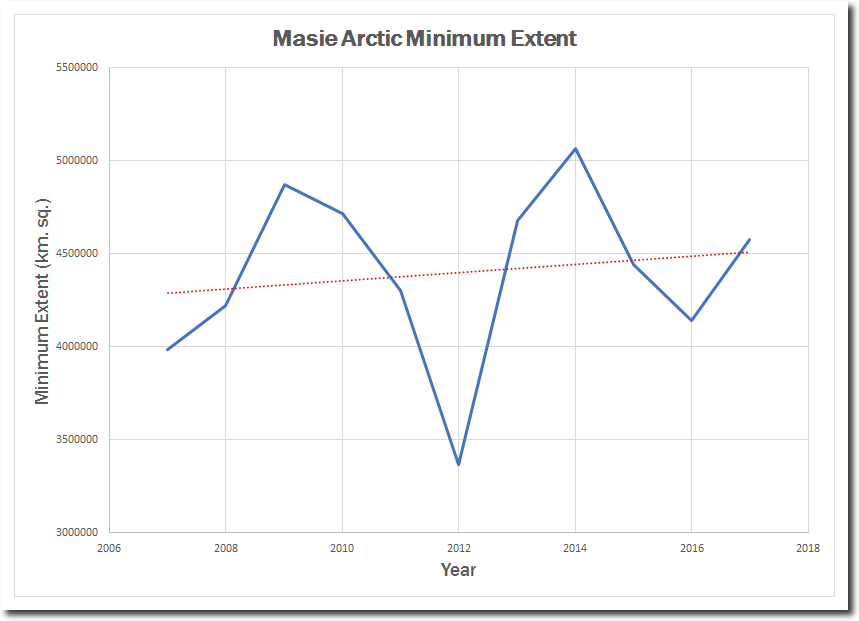
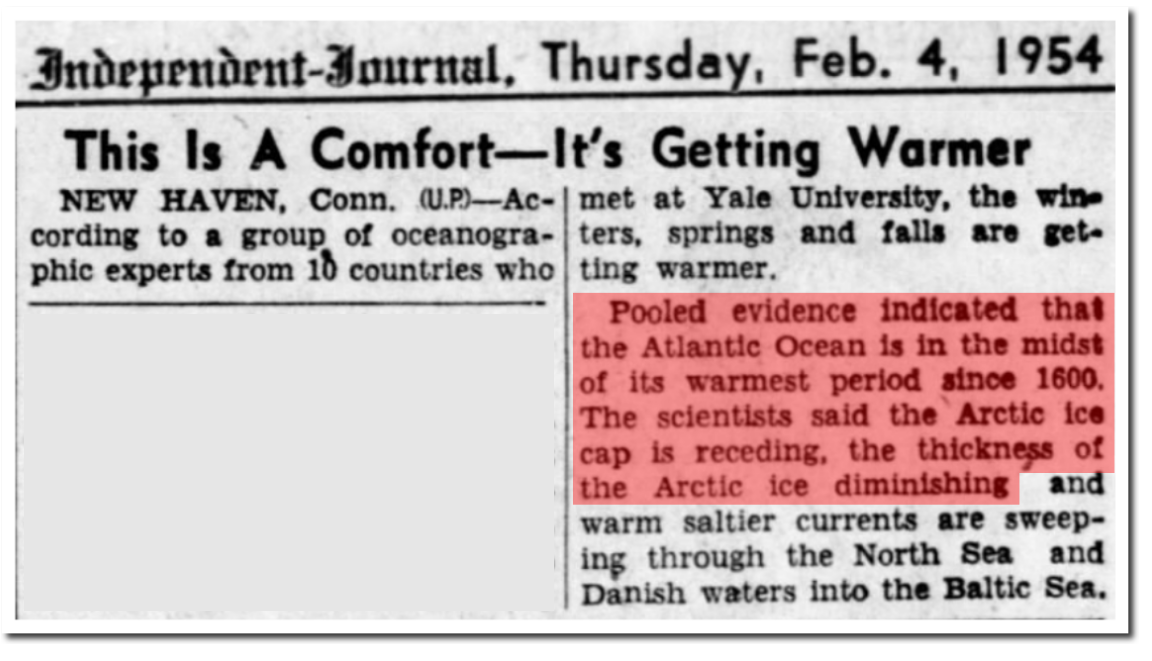
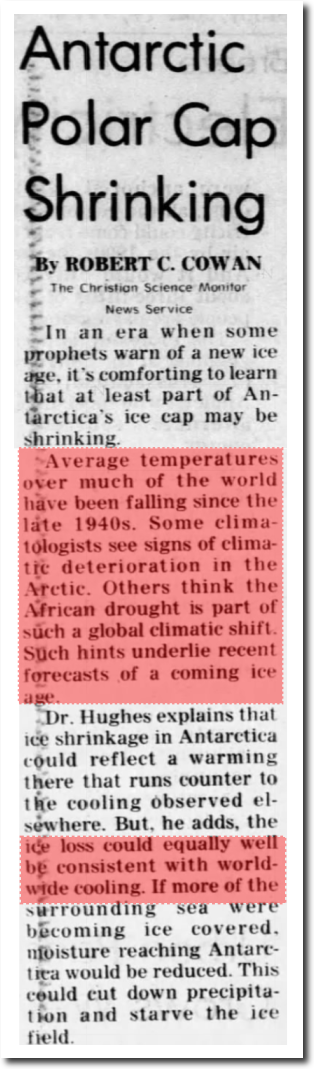
The 1871 fires were much worse than any recent fires. But one thing that hasn’t changed since 1871 is an obsession with imaginary climate change. Atmospheric CO2 was below 300 PPM at the time.

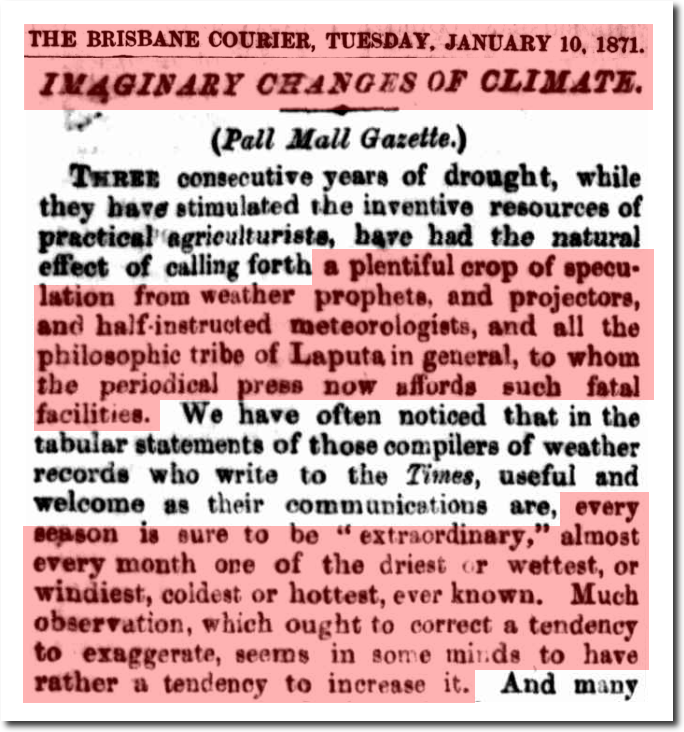
10 Jan 1871 – IMAGINARY CHANGES OF CLIMATE

If we could reduce CO2 levels to 300PPM, perhaps we could expect a return to the “safe climate” of 1871?

Posted in Uncategorized | Leave a comment

Request For Prayer

This afternoon in Boulder

I haven’t mentioned it on the blog, but for the past two months I have been dealing with an acute medical condition which has sent me to the emergency room six times, most recently last weekend while visiting New Mexico. I’m hoping to be finished with it tomorrow.

I thought I had it resolved two weeks ago, but got active again too fast and triggered a relapse. I would greatly appreciate your prayers tonight! And Rambo and Oreo too.

Posted in Uncategorized | Leave a comment

Plummeting October 16 Temperatures In The US

October 16 used to be a very warm day in the US, but temperatures have plummeted over the past century. There was a large drop after 1960.


On this date in 1938, there were 90 degree temperatures into Indiana, and 80 degree temperatures into Massachusetts.

Posted in Uncategorized | Leave a comment

New Video : Corrupted Climate Graphs Lead To Corrupted Climate Science

Posted in Uncategorized | Leave a comment

Moonlight Landing

Posted in Uncategorized | Leave a comment

1973 : Brown, Columbia, Oregon State Universities Predicted A New Ice Age

In 1973, the Climate Long Range Mapping And Prediction Project (CLIMPA) from Brown, Columbia, and OSU predicted a new ice age.

15 Apr 1973, 59 – The Post-Crescent at Newspapers.com

In 1975, CLIMPA downgraded it to a little ice age. They said bad weather is associated with cooling, and good weather is associated with warmth.

11 Oct 1975, Page 41 – Daily Independent Journal at Newspapers.com

These same institutions now predict warming. And they say bad weather is associated with warming, and good weather is associated with cold.

The one thing we know for sure about climate science racketeering, is that climate scientists scamsters will say whatever appears most opportune for future funding.

Posted in Uncategorized | Leave a comment

Plummeting October 15 Temperatures In The US

October 15 used to be a warm day in the US, but temperatures have plummeted over the past century.

The percent of the US over 80 degrees plummeted during the 1970s.

On this date in 1938, much of the Midwest was over 90 degrees.

Same story in 1963, with 80 degree weather well up into New England.

Posted in Uncategorized | Leave a comment

Corrupted NASA Graphs And Corrupted NOAA Thinking

Twenty years ago, government experts said 1.5C warming in the Arctic from 1840 to 1950 was largely due to natural forces, but recent warming “must be attributed to greenhouse gases

14 Nov 1997, Page 7 – The Salina Journal at Newspapers.com

Overpeck’s conclusion about recent warming was undoubtedly due to using fake NASA/NOAA graphs like this one.

Data.GISS: GISS Surface Temperature Analysis

The graph above was massively tampered with to cool the past. The next graph shows the data has been altered.

Data.GISS: GISS Surface Temperature Analysis

Had Overpeck used the raw data, he would have seen a nearly perfect correlation between Eastern Arctic temperatures and the Atlantic Multidecadal Oscillation (AMO.)

Reykjavik GISS V2             AMO

The AMO peaked about ten years ago. Since then, the Arctic sea ice minimum has gotten larger.

masie_4km_allyears_extent_sqkm.csv

There is no reason to believe that changes in greenhouse gases have had any significant influence on the Arctic climate. Observations show that Arctic temperatures rise and fall with the AMO.

04 Feb 1954, Page 26 – Daily Independent Journal at Newspapers.com

NASA and NOAA are destroying science and policy with their data tampering.

Posted in Uncategorized | Leave a comment

1974 – Polar Ice Loss Caused By Global Cooling

In 1974, scientists explained that polar ice loss was caused by global cooling.

19 Jun 1974, 56 – The Jackson Sun at Newspapers.com

Now they say thickening Antarctic sea ice is killing penguins and is due to global warming.

Mass starvation has wiped out thousands of penguin chicks in Antarctica, with unusually thick sea ice forcing their parents to forage further for food

they have been declining in the Antarctic region more generally where climate change has taken its toll, with shifting ice reducing habitat while warming seas affect their prey.

In climate science – warming causes ice to grow, and cooling causes it to melt.

And scientists at the National Academy of Sciences were busy poisoning beagles, when they weren’t doing junk climate science.

19 Jun 1974, 1 – The Jackson Sun at Newspapers.com

Posted in Uncategorized | Leave a comment

No Change In Land Temperatures Since 1990

Satellite data shows that there has been no change in temperatures over land since 1990, before the eruption of Mt. Pinatubo – which cooled earth for several years.

Wood for Trees: Interactive Graphs

This is in direct contradiction to the fraudulent data from NASA and NOAA – which shows a tremendous amount of warming during that period.

graph.png (1130×600)

Posted in Uncategorized | Leave a comment