More Spectacular Fraud From NOAA And The EPA

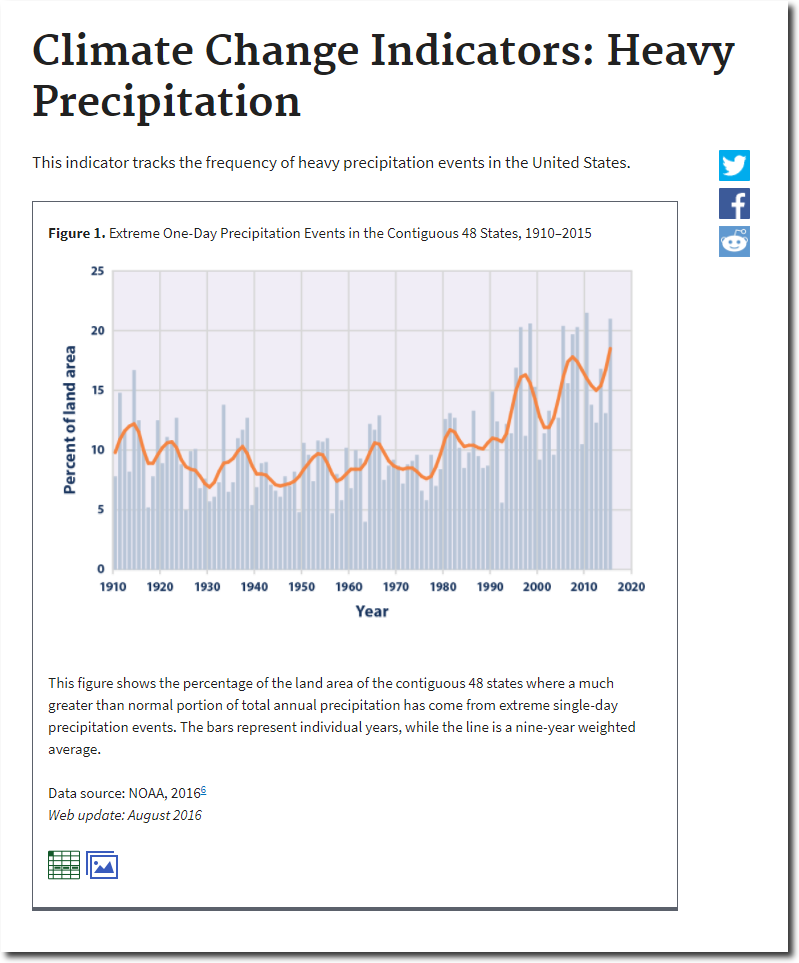
The NOAA/EPA graph is being touted by Democrats as proof that people who tell the truth about climate need to be jailed. It is intended to mislead people into believing that heavy rainfall events are due to your SUV.

Climate Change Indicators: Heavy Precipitation | Climate Change Indicators in the United States | US EPA

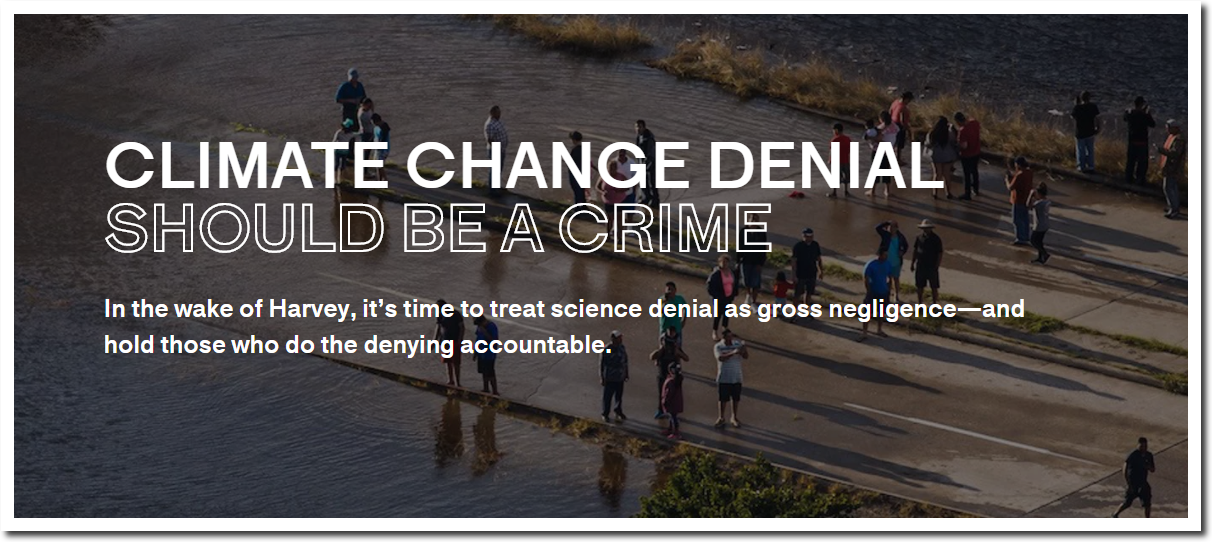
Climate change denial should be a crime | The Outline

Besides the utter insanity of Soviet mentality Democrats demanding compliance with their cult, the EPA graph itself is fraudulent. Had they extended their graph back to the start of records in 1895, the trend would have been the exact opposite.


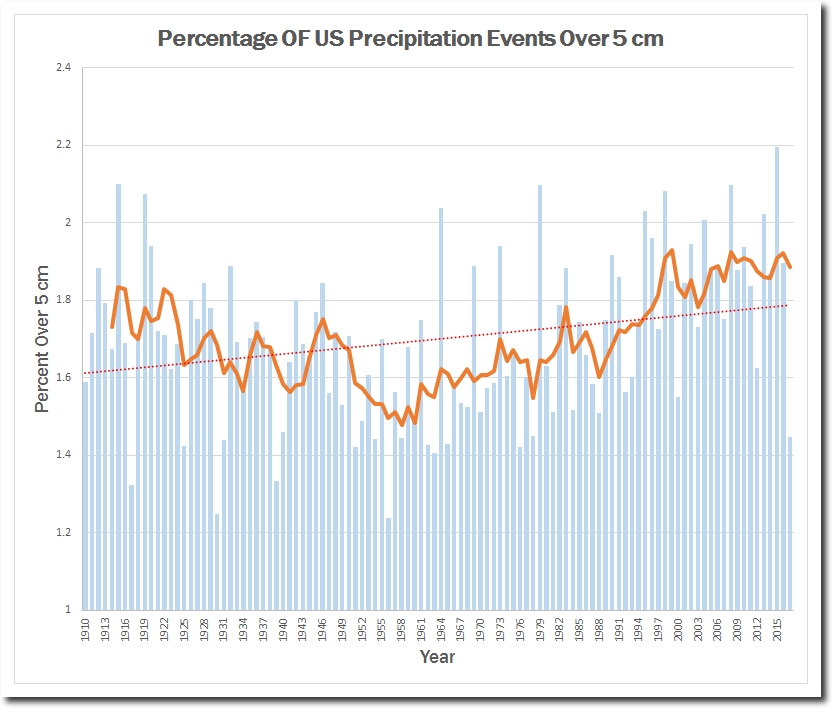
Cherry picking starting points of graphs is standard operating procedure for criminals on the left.

Posted in Uncategorized | Leave a comment

Arctic Sea Ice Volume Up 20% Since 2008

The animation below show the huge increase in 1+ meter thick sea ice in the central Arctic since 2008.

Sea ice volume is up 20% since 2008, and is also higher than 2007 and 2016.

2008   2017

The really sad thing for climate alarmists is that there will be a huge increase in the amount of Multi-Year Ice in three weeks, which will get very thick during the winter.

Posted in Uncategorized | Leave a comment

Updated Ice-Free Arctic Forecast

Current forecast is that the Arctic will be ice-free on November 2, 2018 at 3;59 PM.

Charctic Interactive Sea Ice Graph | Arctic Sea Ice News and Analysis

Climate experts insist that sea ice is at a record low, and the ice is disappearing. Because they are paid to generate propaganda – not do science.

Posted in Uncategorized | Leave a comment

Crystal Serenity Turns Off Their Cameras

My guess is they are going through a channel opened up by icebreakers, and don’t want people to know they are cheating.

Crystal Serenity | Live Cruise Ship Cam | Cruise Video Feed

Posted in Uncategorized | Leave a comment

Coolest August On Record In Nebraska

The frequency of hot August days in Nebraska has plummeted over the past century. During August, 1937 Nebraska stations averaged 25 days over 90 degrees. This year they averaged only one day over 90F.

The warmest temperature recorded at Ashland, Nebraska in August was 86 degrees. It was only the third year since 1895 which Ashland didn’t make it to 90 degrees during August. In 1913 and 1947 Ashland had 27 days over 90 degrees.

Every single day in August, 1913 was as warm or warmer than this year, with the hottest temperatures 21 degrees warmer than this year. Maximum temperatures averaged 18F cooler than 1913.

According to completely fake NASA temperature data, 1913 was one of the coolest years on record. California reached 134 degrees that summer – the hottest temperature ever recorded on Earth.

Posted in Uncategorized | Leave a comment

Arctic Sea Ice Extent Up 25% Since 2012

Arctic sea ice extent is up 25% over the past five years. Green shows ice gain since August 30, 2012.

2017     2012

Extent is fourth highest in a decade.

There has been no trend since this date in 2006.

masie_4km_allyears_extent_sqkm.csv

Surface ice mass gain in Greenland is almost 50% above normal.

Greenland Ice Sheet Surface Mass Budget: DMI

Experts insist that Arctic ice is disappearing, because if they told the truth their funding would get cut off.

Posted in Uncategorized | Leave a comment

Crystal Serenity Blocked By Ice

With their route through the Northwest Passage blocked by ice, the Crystal Serenity is zig-zagging . They have made three approaches, and turned back each time.

Crystal Serenity | Live Cruise Ship Cam | Cruise Video Feed

Posted in Uncategorized | Leave a comment

Plummeting August 31 Temperatures In The US

On this date in 1953. almost the entire Eastern US was over 90 degrees, and much of the Northeastern US was over 100 degrees. New York City was 100 degrees.

August 31 temperatures have plummeted over the past century.

Posted in Uncategorized | Leave a comment

Northwest Passage Fail

The Northwest Passage was open in 1904, but it isn’t this year.

I saw (the Northwest Passage) open before my ship the first year of my voyage.

  • Amundsen

TimesMachine: March 9, 1907 

According to NASA. that was the coldest year on record.

graph.png (1130×600)

The Crystal Serenity is encountering ice, and is backtracking and meandering. Temperatures have dropped well below freezing.

Crystal Serenity | Live Cruise Ship Cam | Cruise Video Feed

The forecast shows temperatures below freezing along their path for the next two weeks. Not much ice is going to melt.

Posted in Uncategorized | Leave a comment

Alternating Drought And Flood Is Climate – Not Climate Change

Ten years ago, the government of Australia announced the permanent drought.

This drought may never break – Environment – smh.com.au

Two years later it was raining so much in Australia that sea level was falling.

Australian floods of 2010 and 2011 caused global sea level to drop | Environment | The Guardian

Alternating flood and drought is the normal climate. In 1850 Australia had both.

13 Oct 1868 – THE CLIMATE OF AUSTRALIA

Superstitious and stupid people always imagine that the climate is changing.

10 Jan 1871 – IMAGINARY CHANGES OF CLIMATE

And regardless of the weather, they key thing is always to blame it on White Men.

11 Mar 1846 – ON THE CHANGE OF CLIMATE

Posted in Uncategorized | Leave a comment