
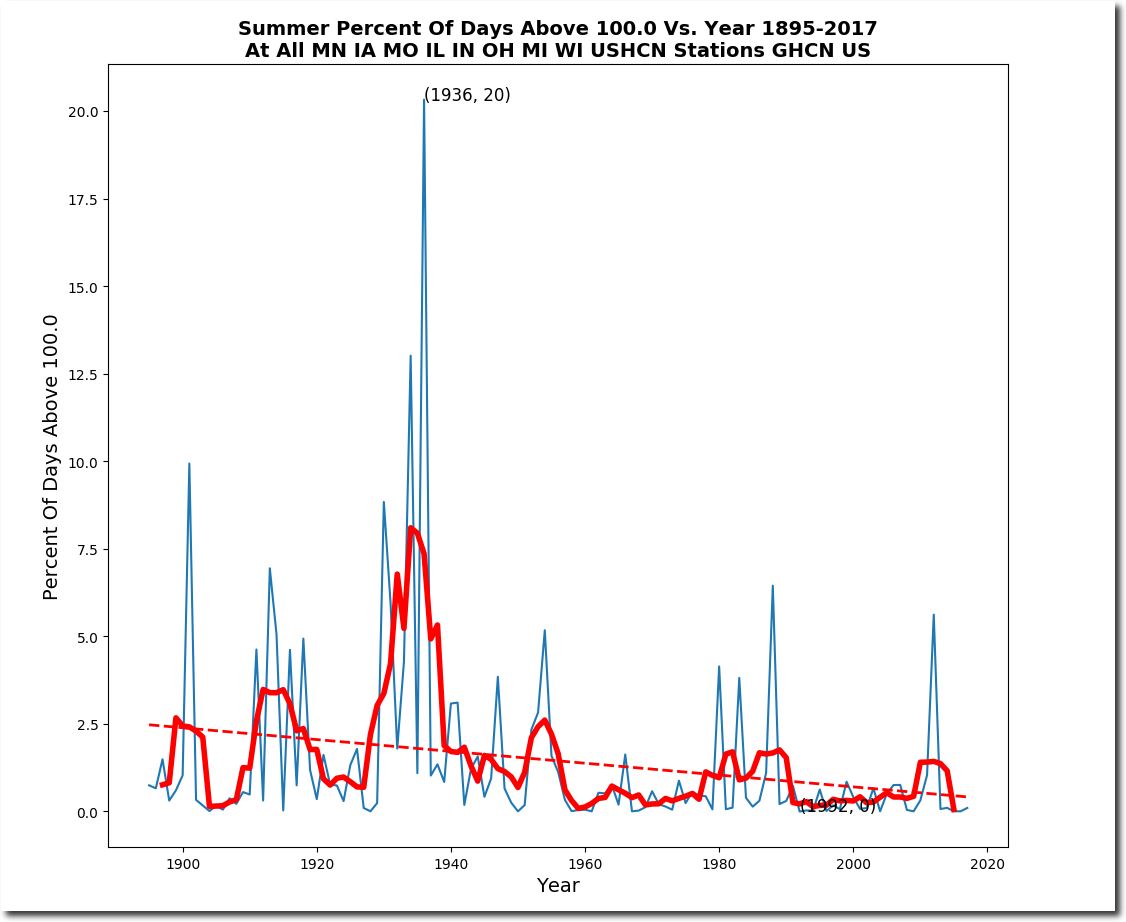
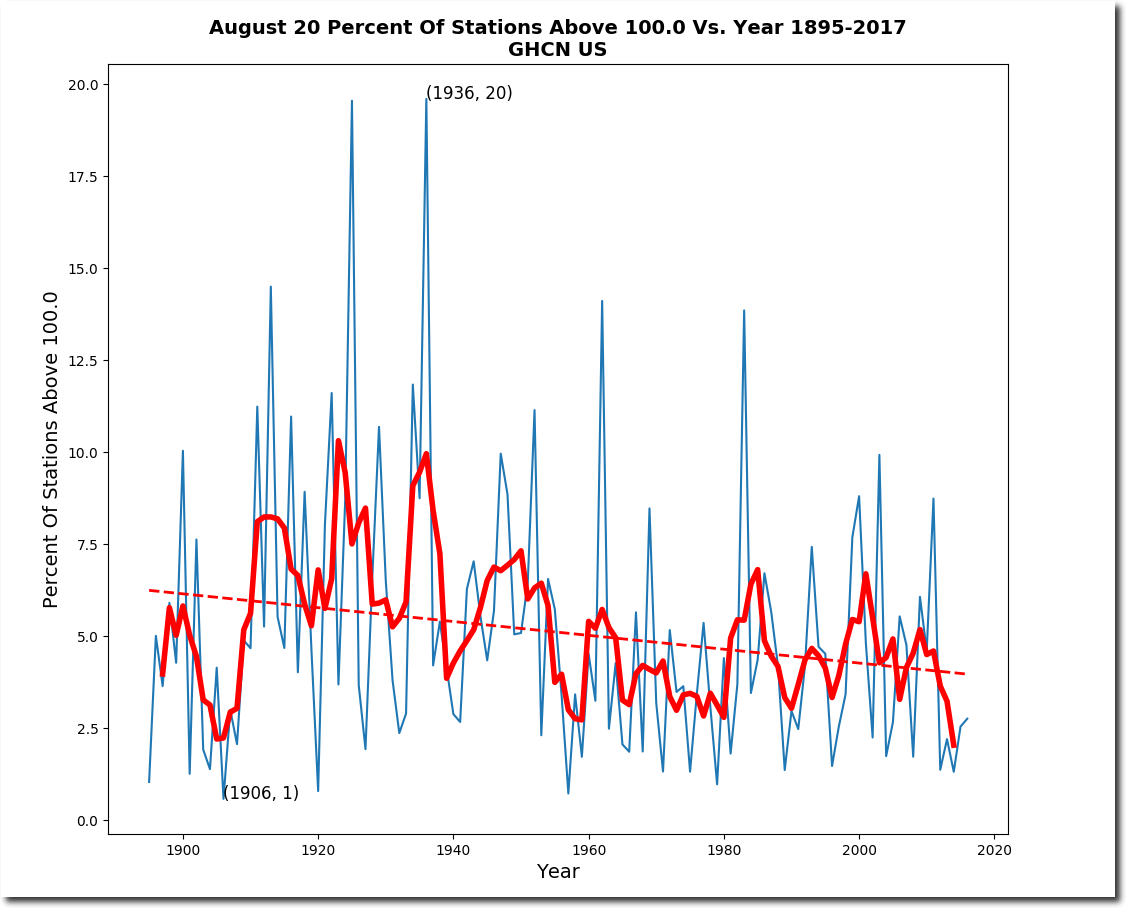
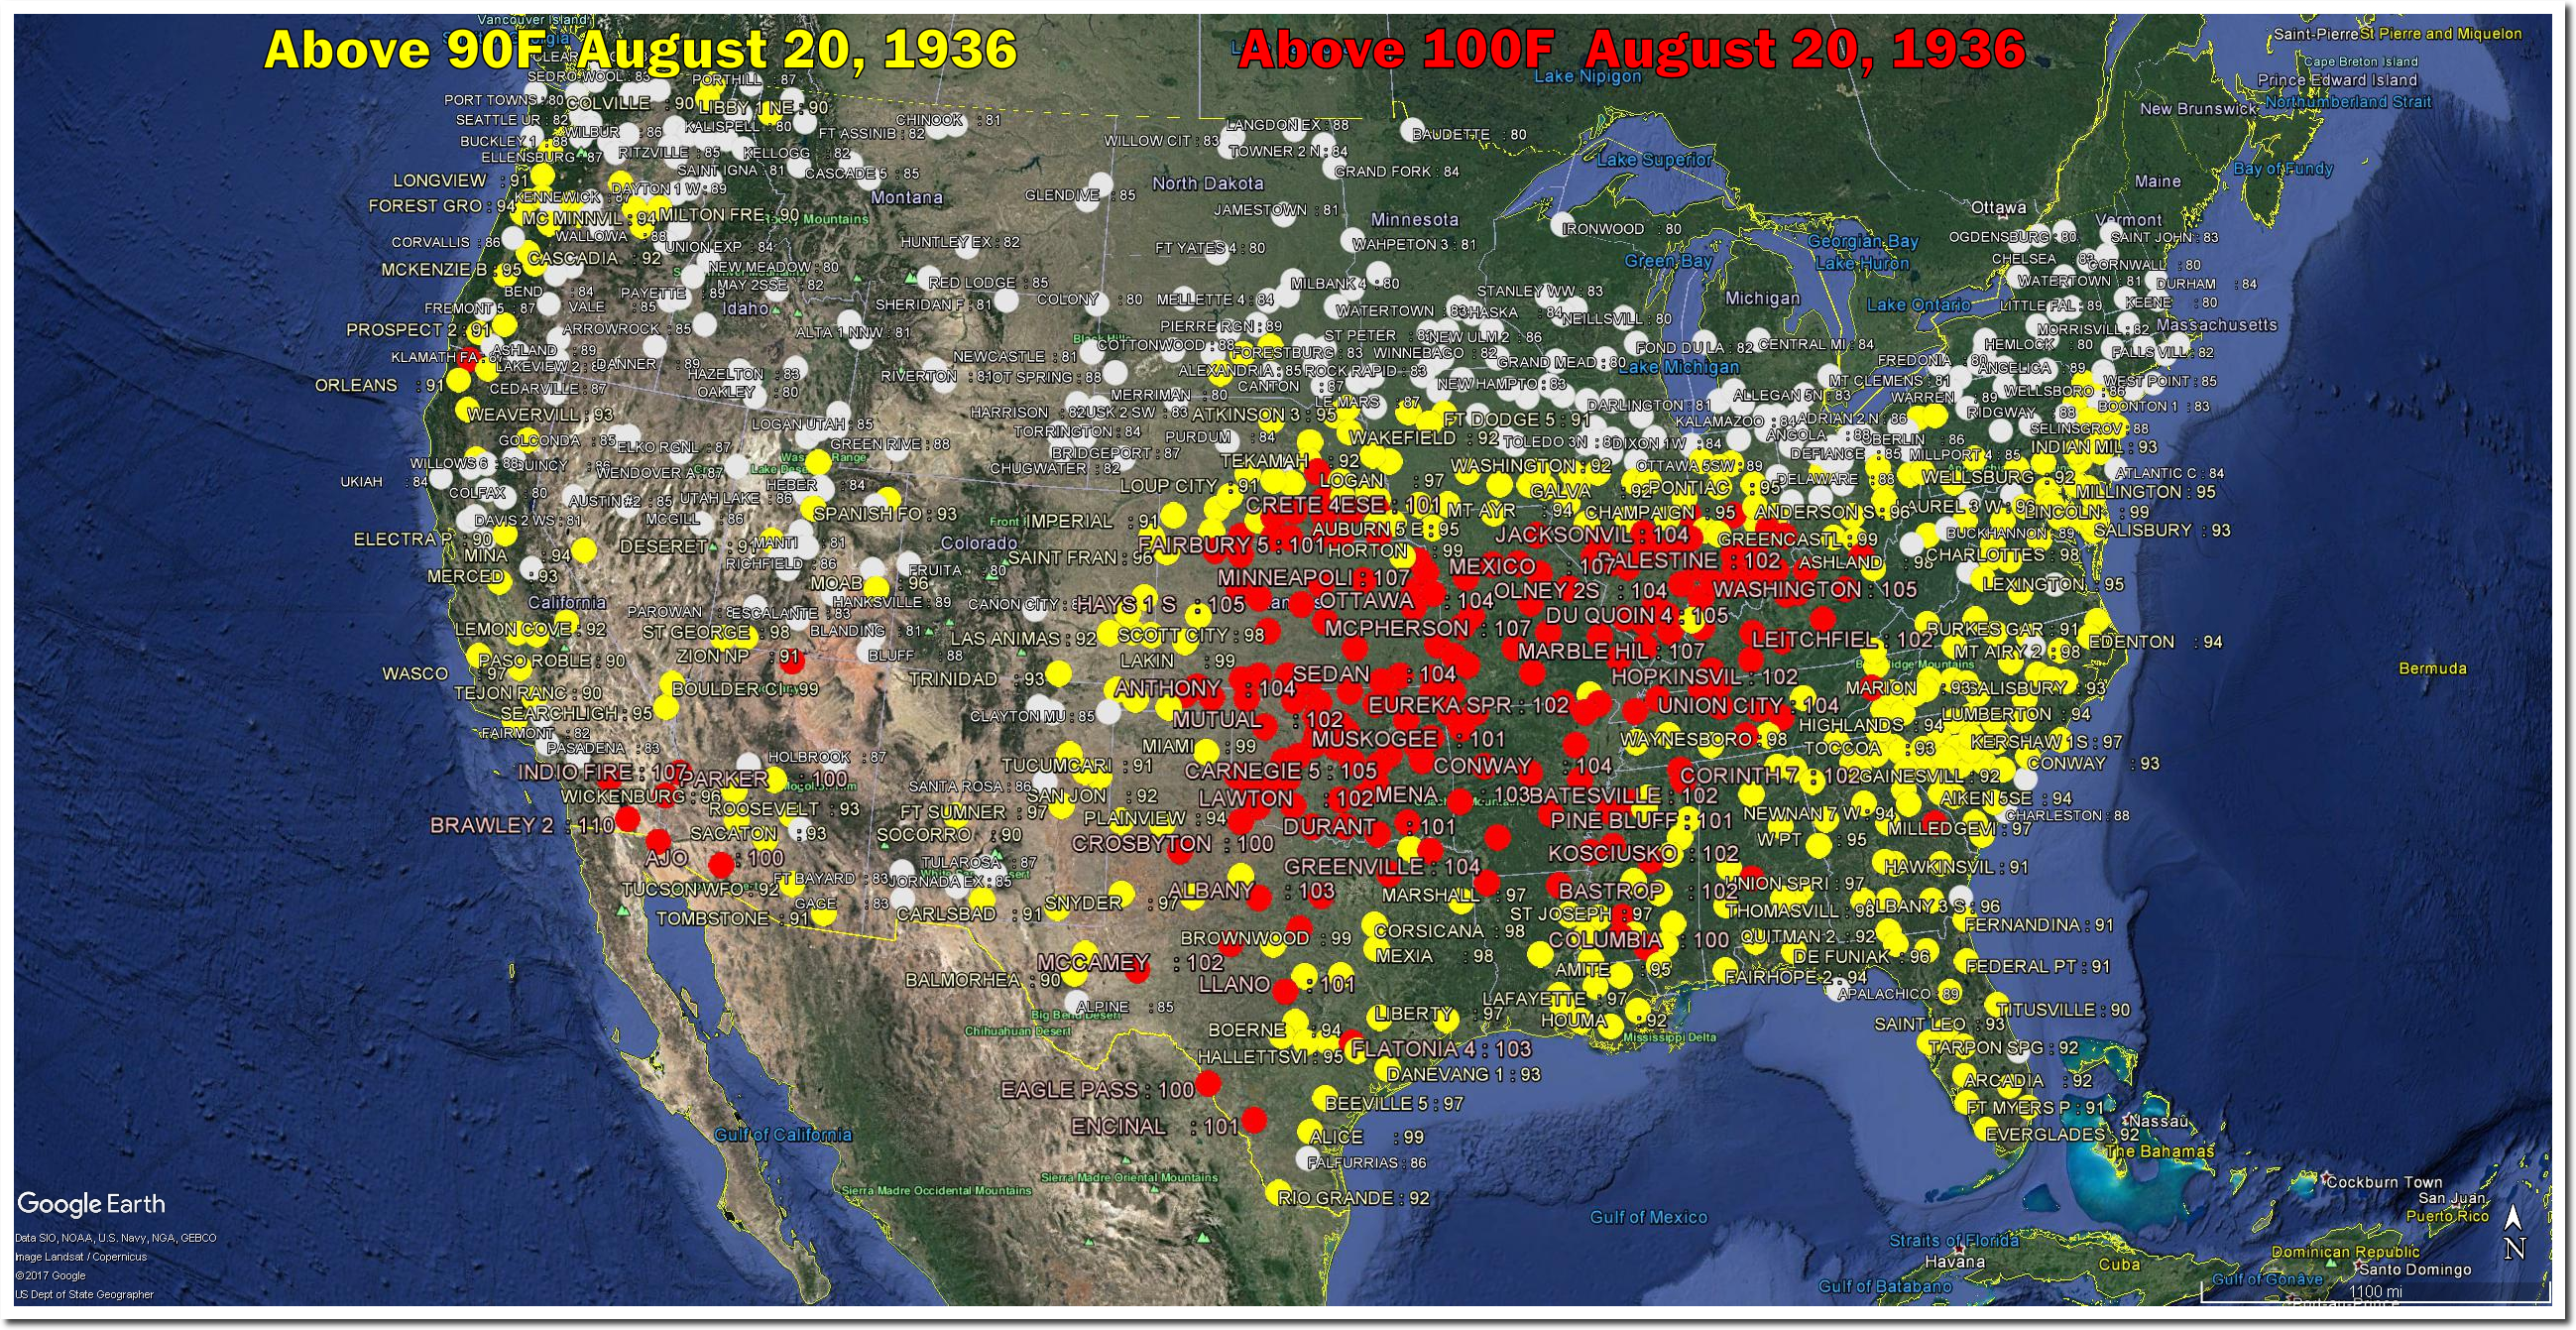
During the summer of 1936, one maximum temperature measurement out five in the Midwest was over 100F, compared to one out of 800 this summer. One hundred degree days have become very rare in the Midwest since CO2 hit 350 PPM.
During the summer of 1936, one maximum temperature measurement out five in the Midwest was over 100F, compared to one out of 800 this summer. One hundred degree days have become very rare in the Midwest since CO2 hit 350 PPM.
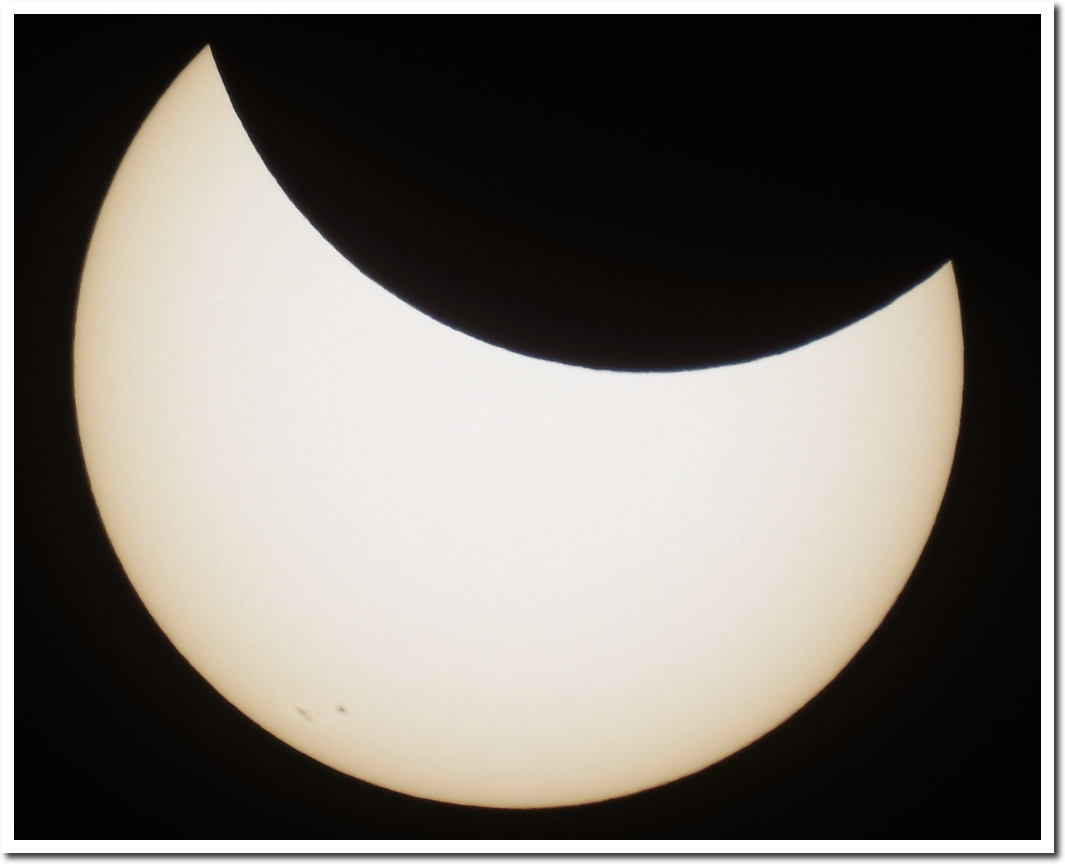
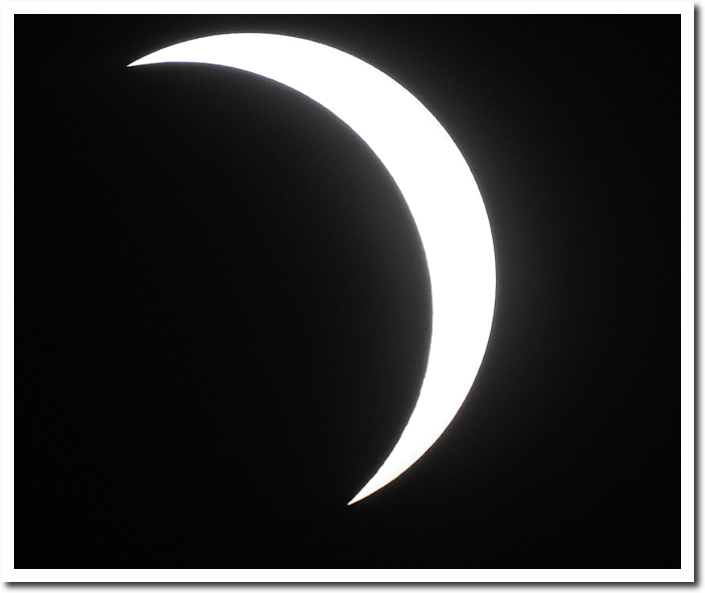
Make sure and watch before Google decides it is hate speech. I practiced for days to learning how to do this. Filming the Sun isn’t easy.
It didn’t get very dark here, but the sun felt much less intense during the eclipse.
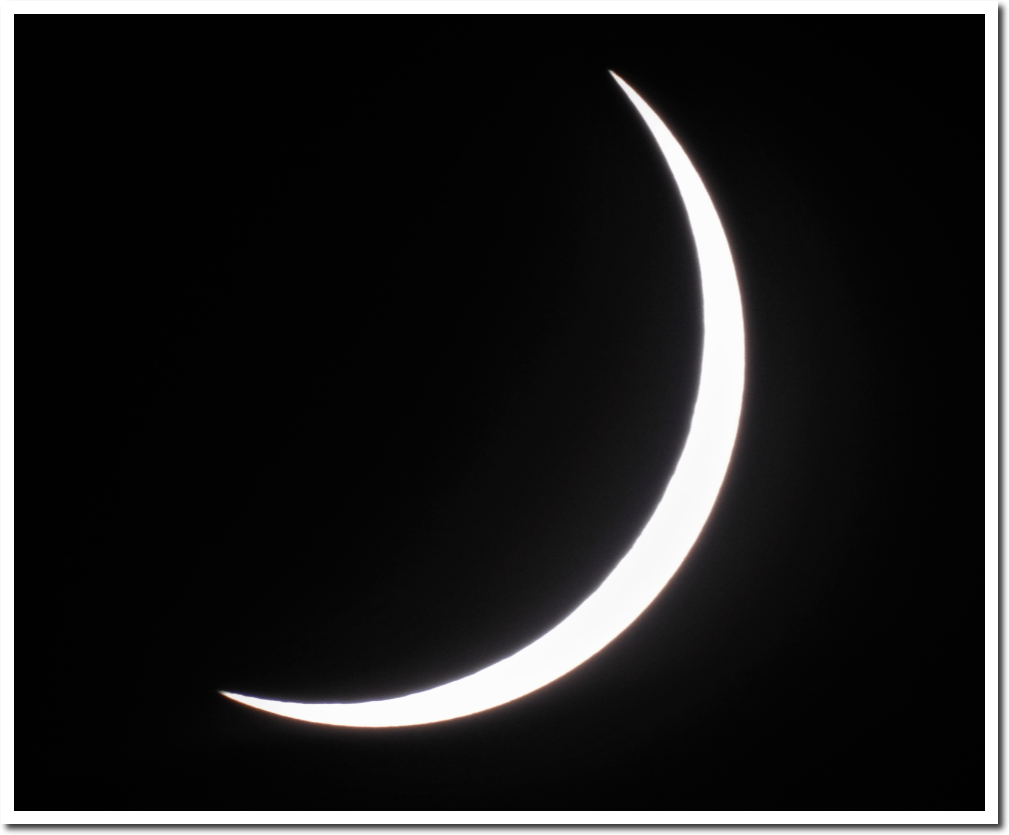

Don’t try this without eclipse glasses!

Looks like I can get about three minutes of good video before I have to move the tripod azimuths. I unfortunately have to be very zoomed in to get the electronic focus to work, and my Nikon doesn’t have a real manual focus.
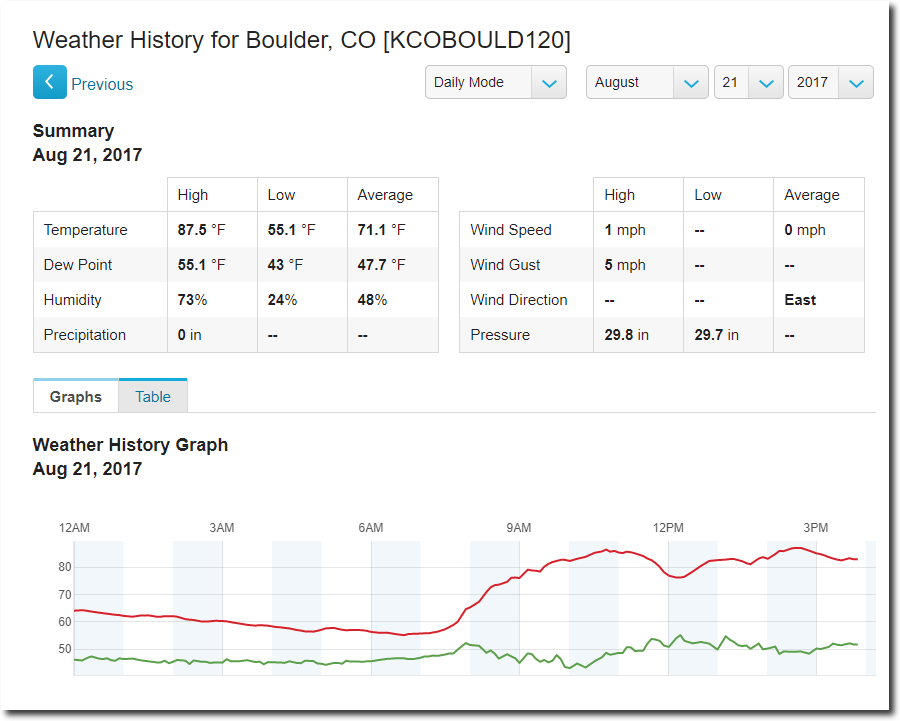
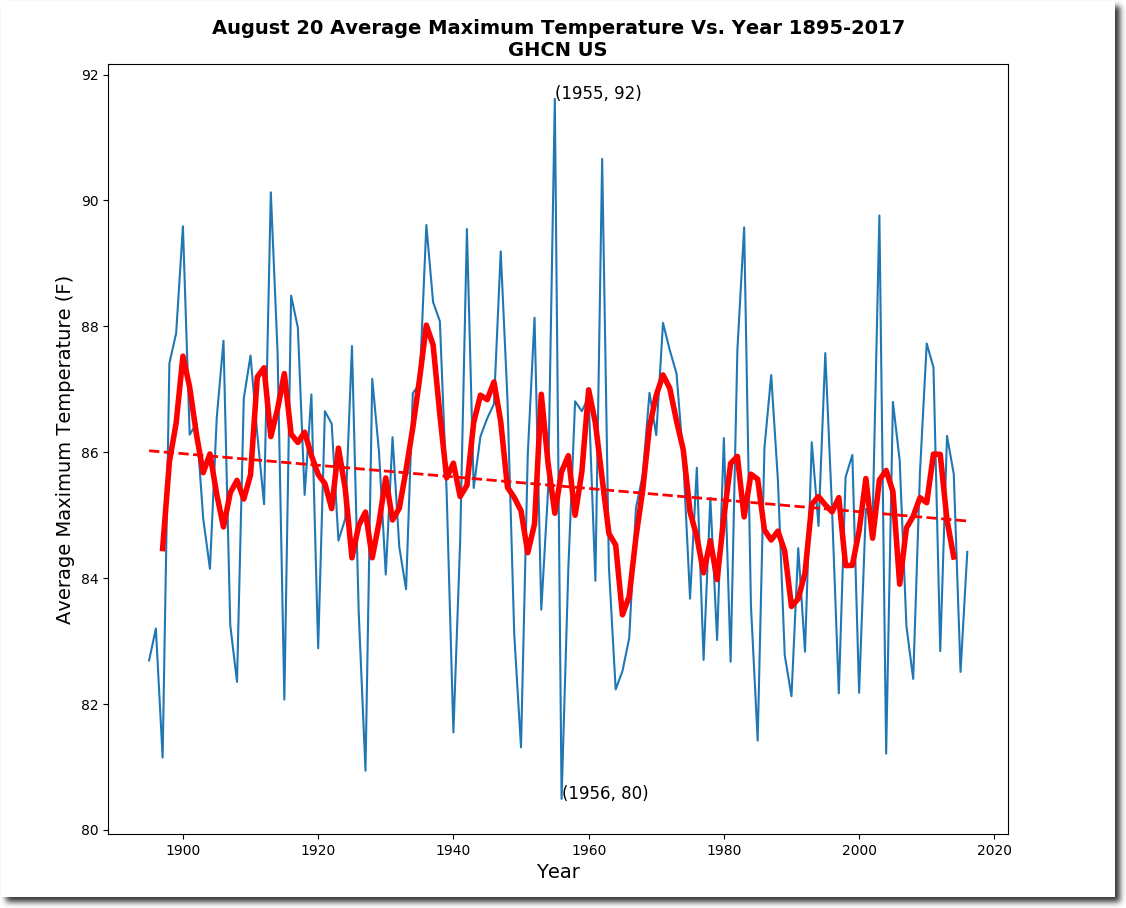
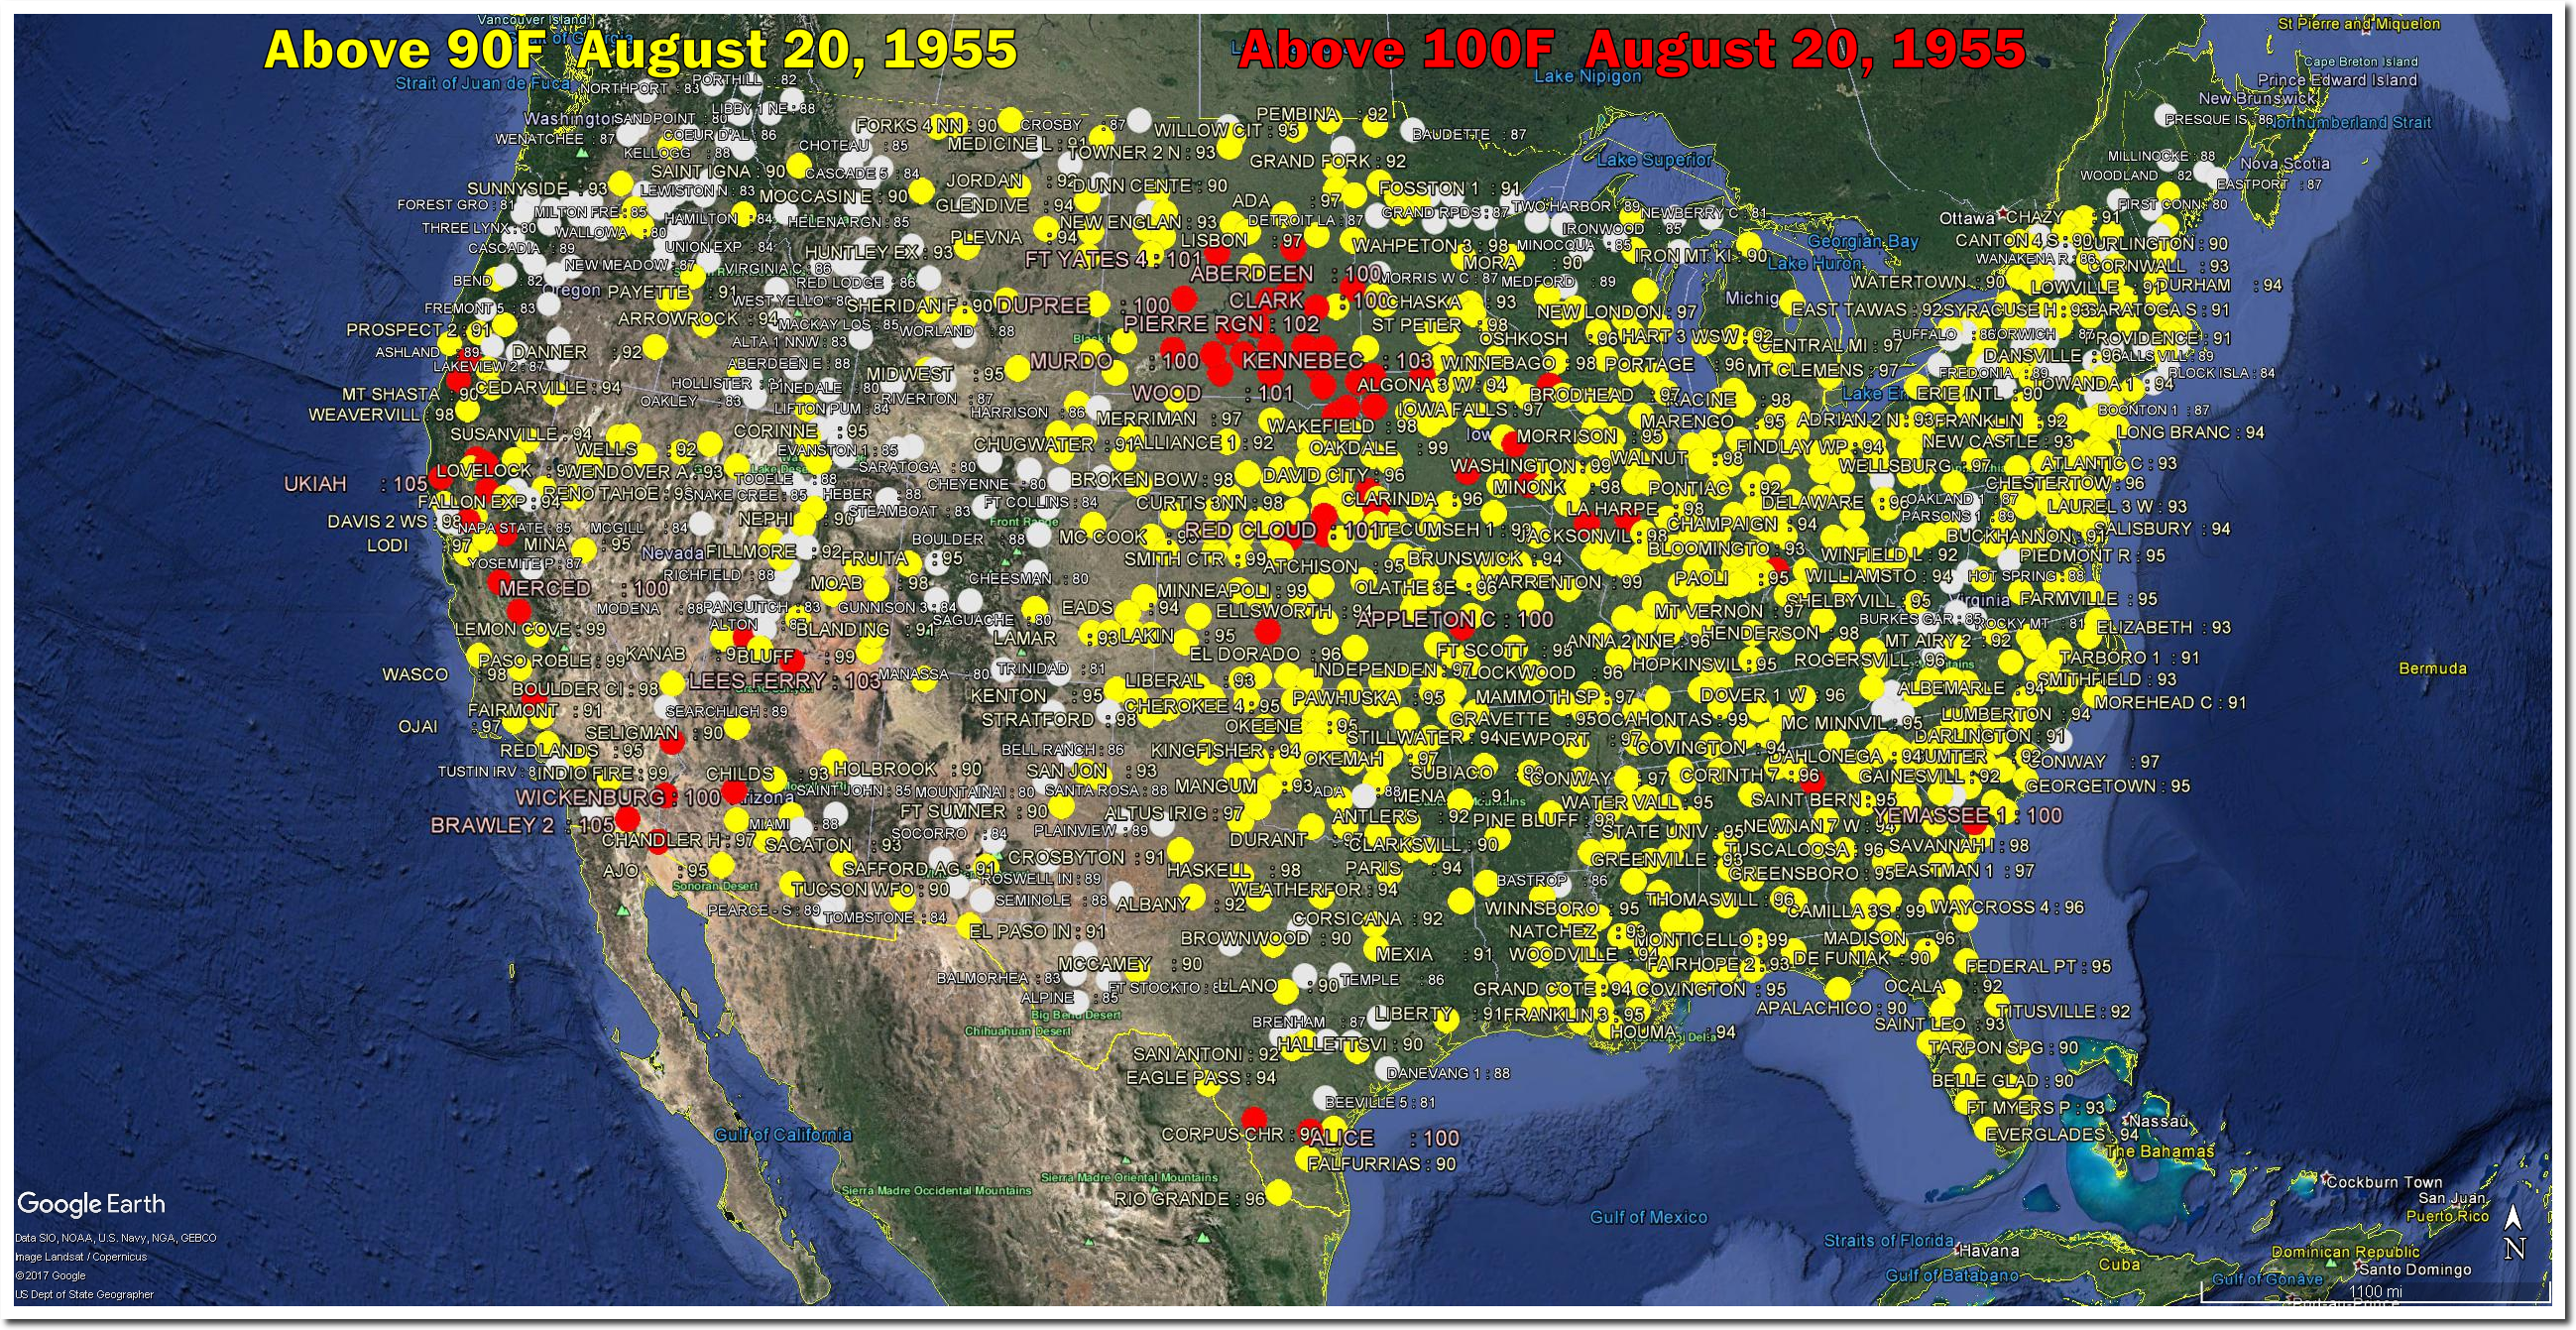
On this date in 1955, the average maximum temperature around the US was 92 degrees. That was 8 degrees warmer than last year, which was the official hottest year ever.
On August 20, 1936, twenty percent of the US was over 100 degrees, compared to three percent last year – which was close to a record low.
Climate alarm depends on people not knowing history, which is why I am providing tools to help keep climate history alive.
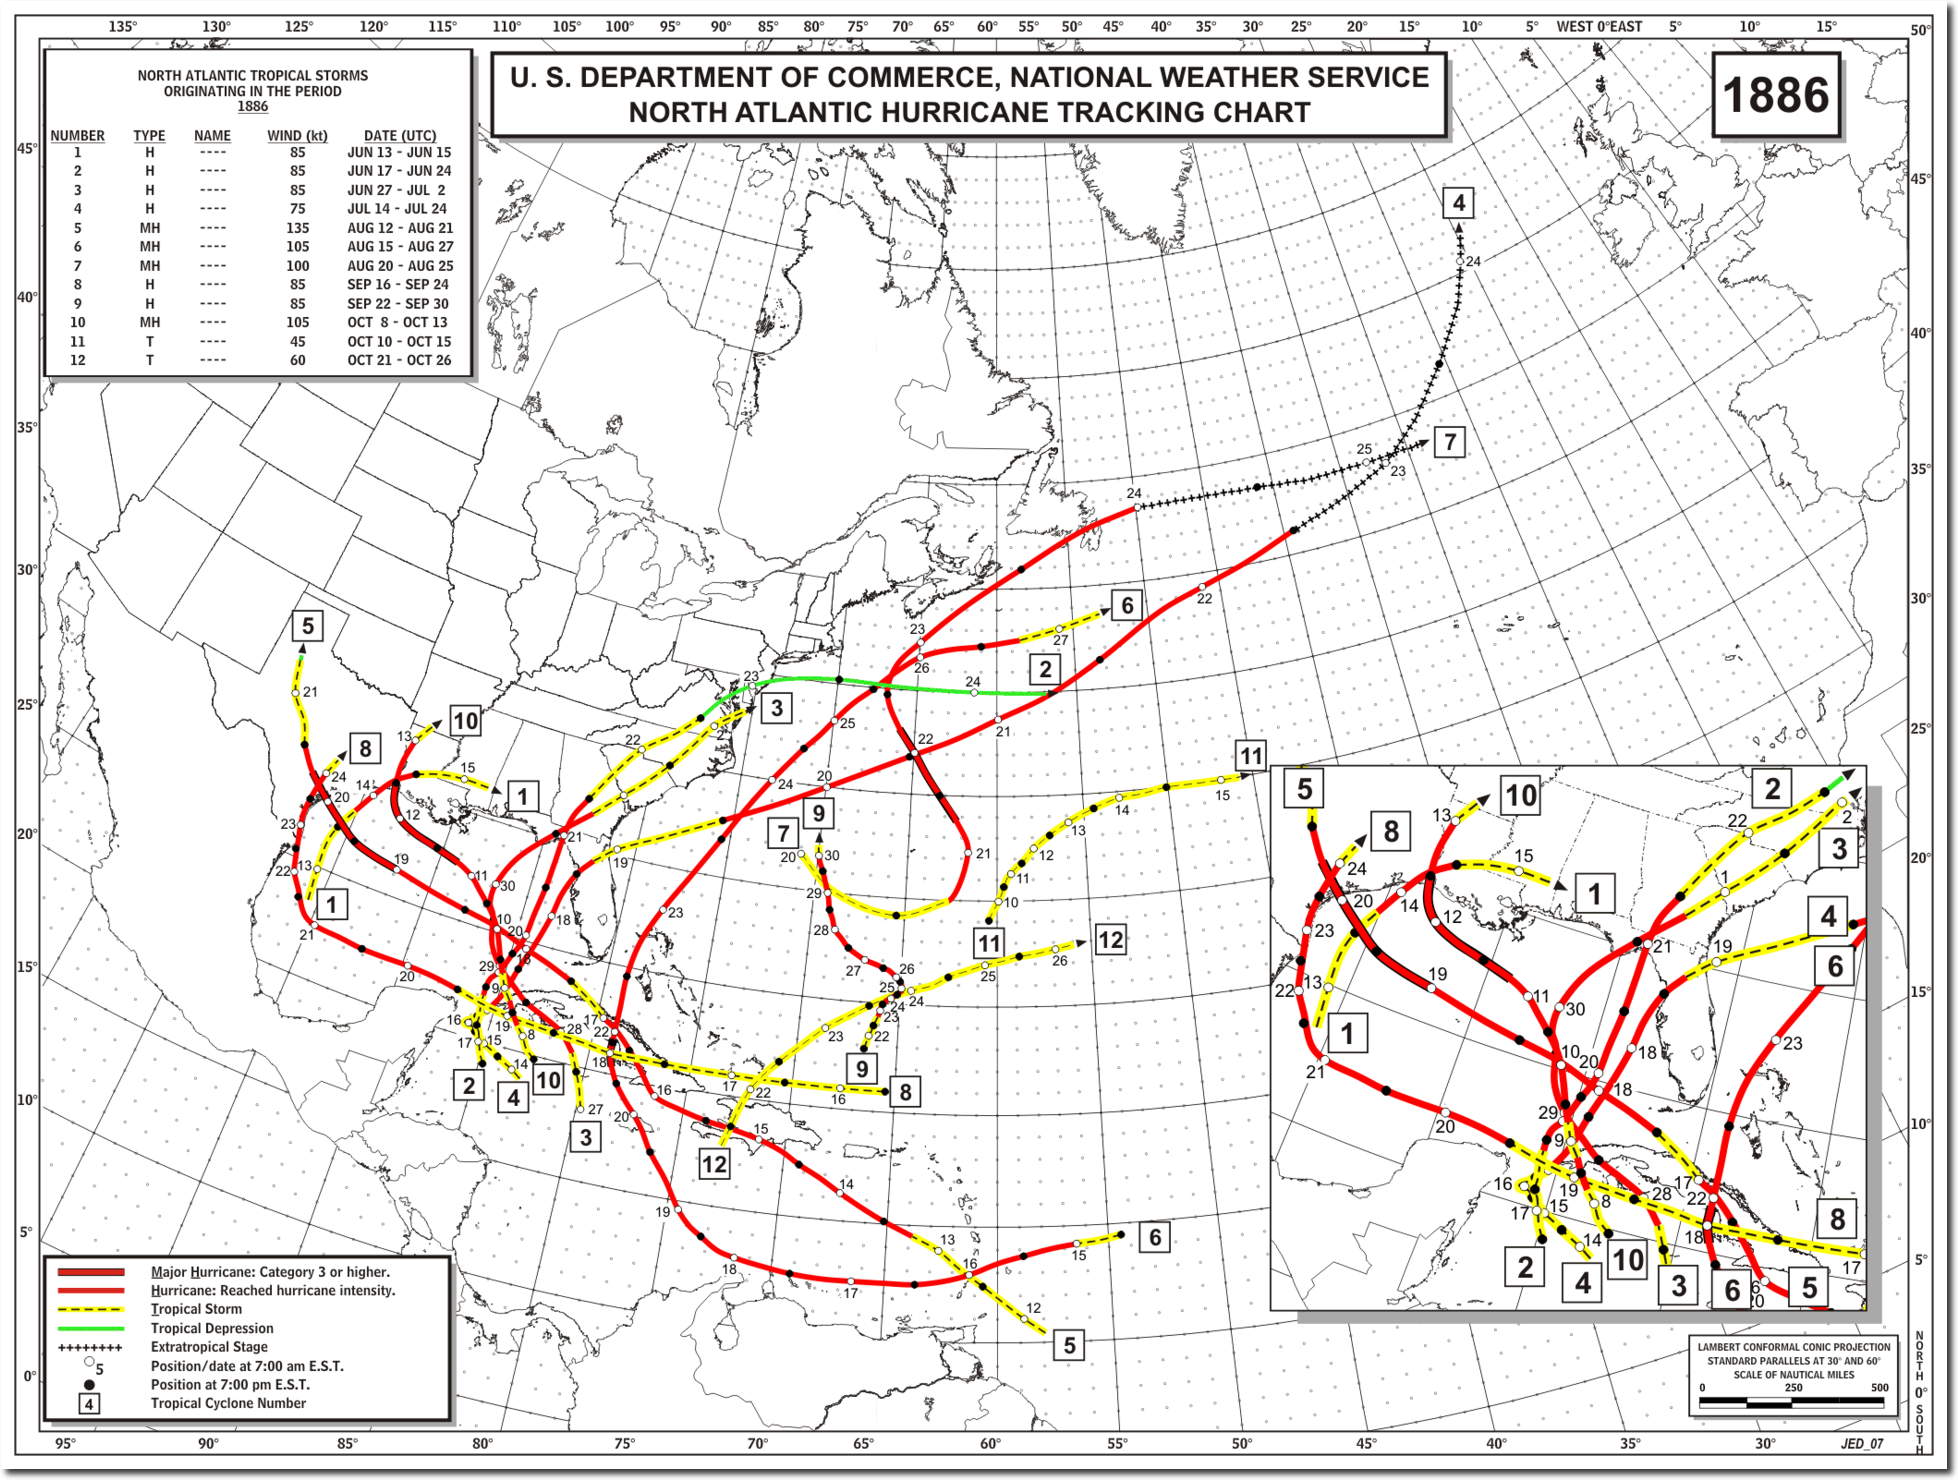
On August 20, 1886 the city of Indianola, Texas was wiped off the map by a hurricane.
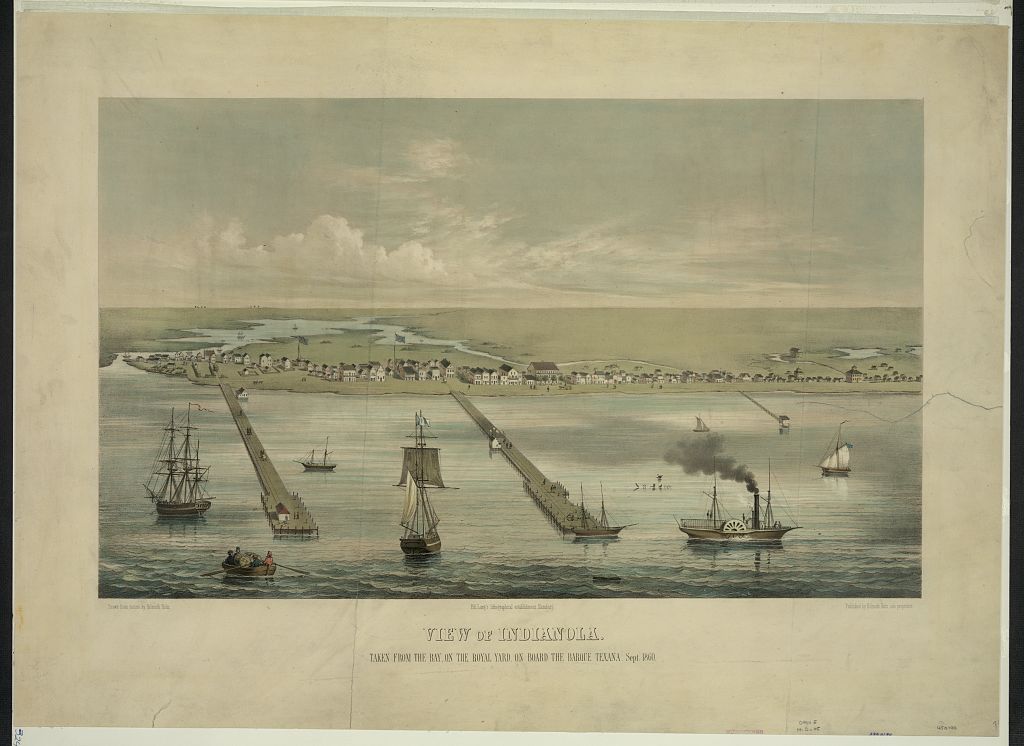
That year was the most active hurricane season in US history, with seven hurricanes making landfall.
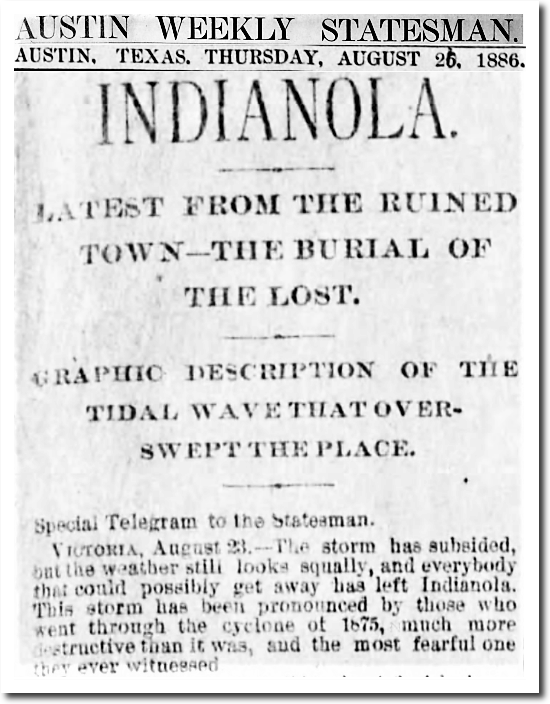
26 Aug 1886, Page 1 – The Austin Weekly Statesman at Newspapers.com
More hurricanes hit the US in 1886 than during Obama’s entire presidency.
Hurricanes are just one of many climate topics which experts have gotten wrong.
The graph below shows raw (blue) and adjusted (red) temperature trends for each USHCN station, sorted by state. NOAA adjusts tampers with the century long temperature trend at the vast majority of US stations, and turns most of the from negative trends into positive trends.

The measured thermometer data shows a sharp drop in US maximum temperatures over the past century.
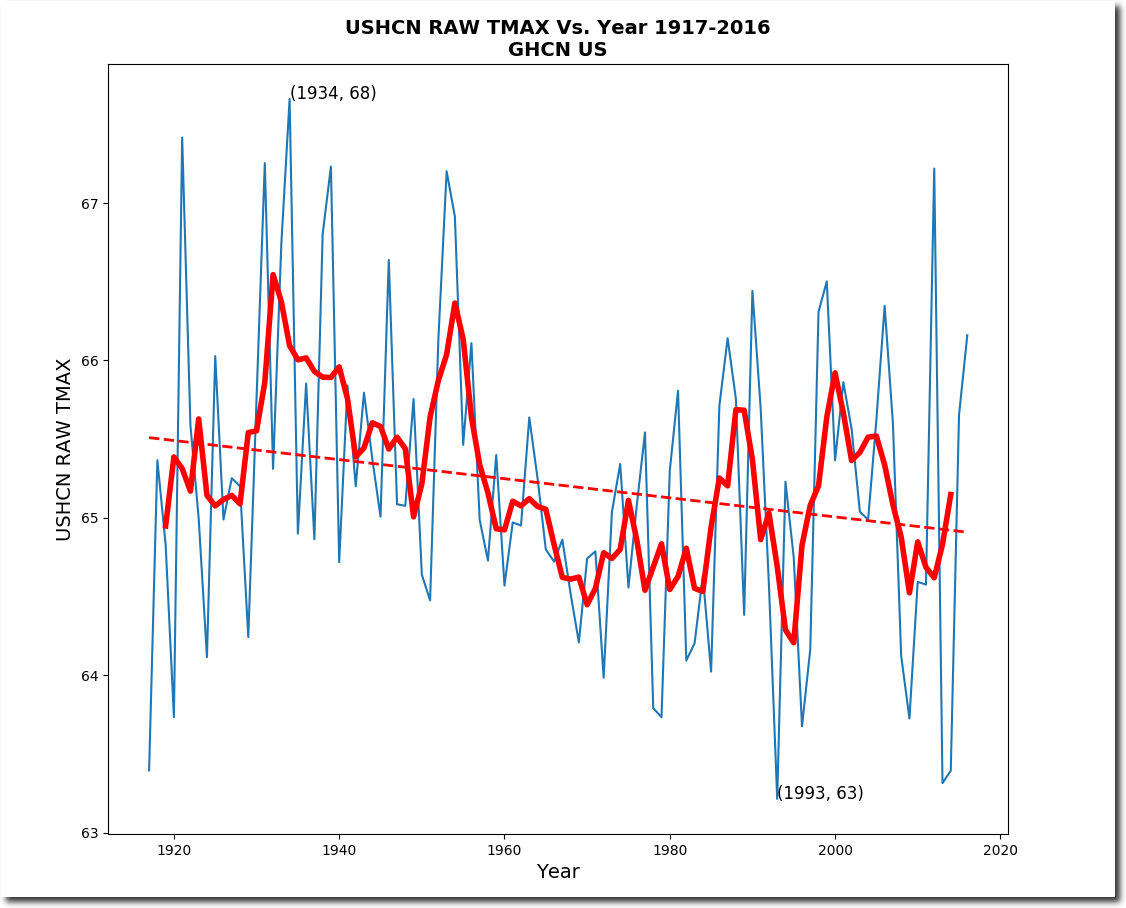
NOAA massively tampers with the data to turn a cooling trend into a warming trend.
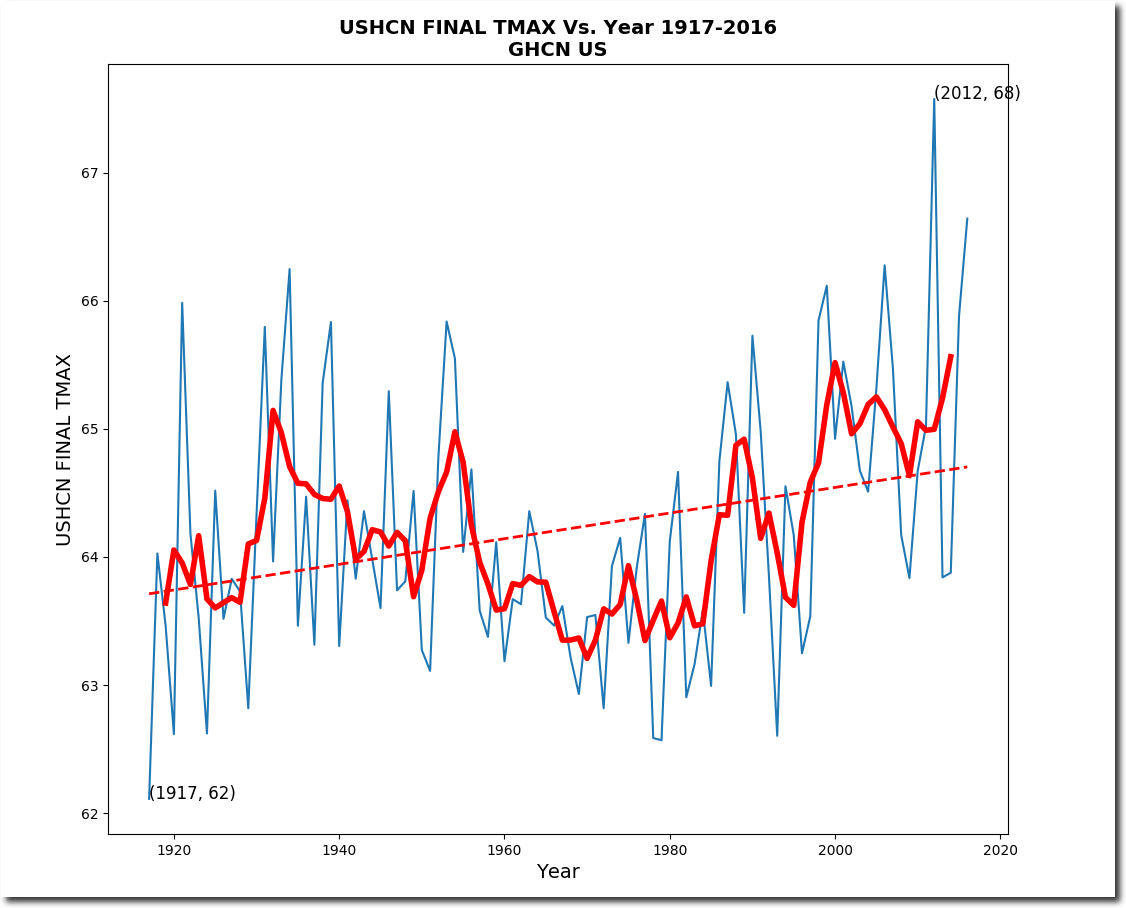
The data tampering forms a real hockey stick, unlike Mikey Mann’s fake one.
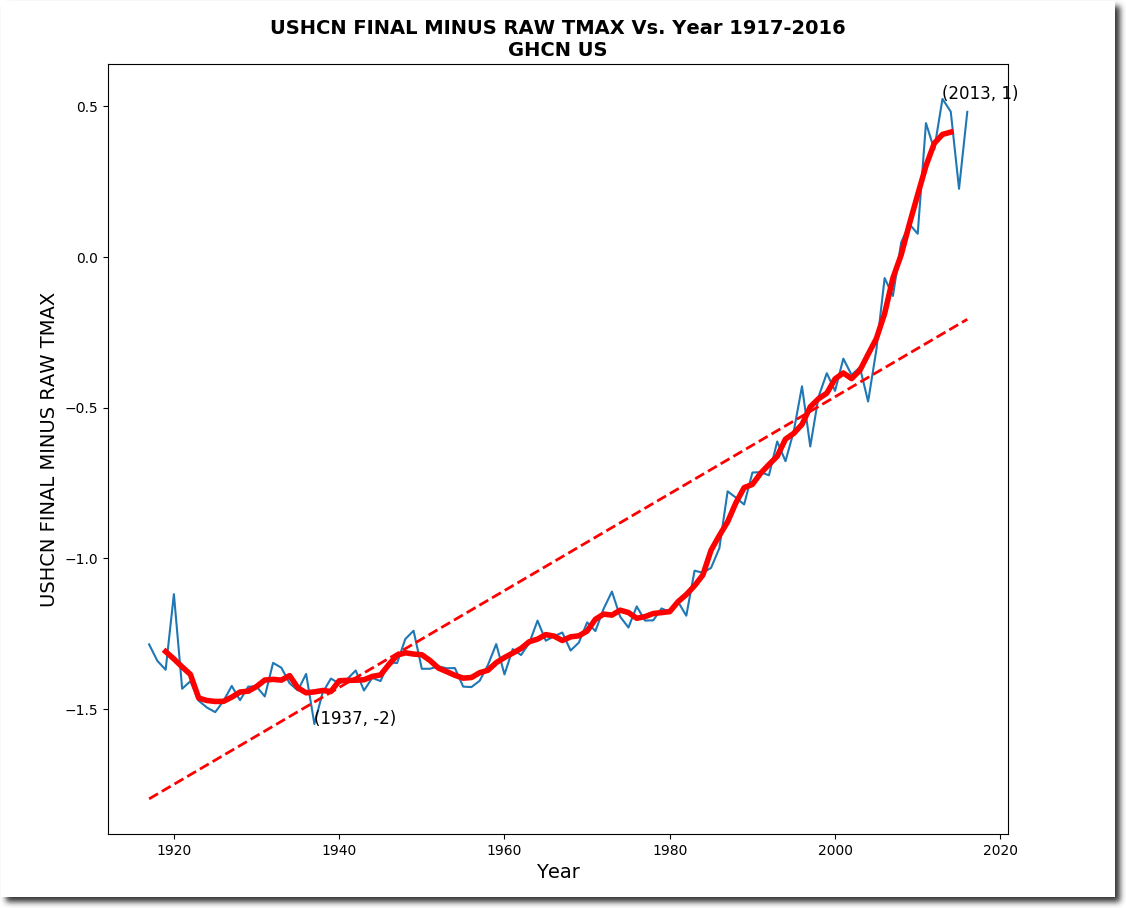
And in the ultimate science fraud, NOAA precisely tampers with data to conform with their CO2 warming theory.
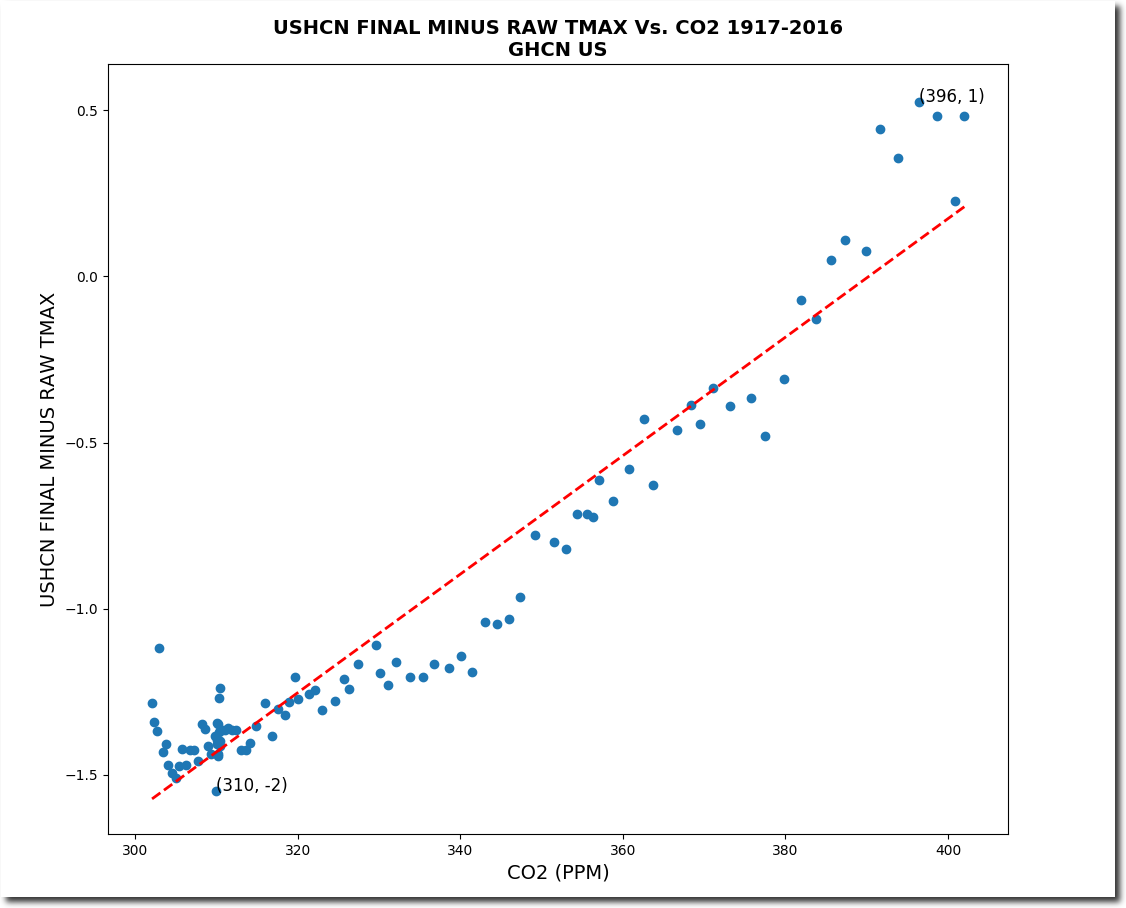
Climate scientists have a terrible reputation and forecast record, so they try to piggy back off of the good work of actual scientists. You can’t fake an eclipse, but you can fake temperature graphs.

The hits just keep coming! Nothing but cold in the Arctic forecast.
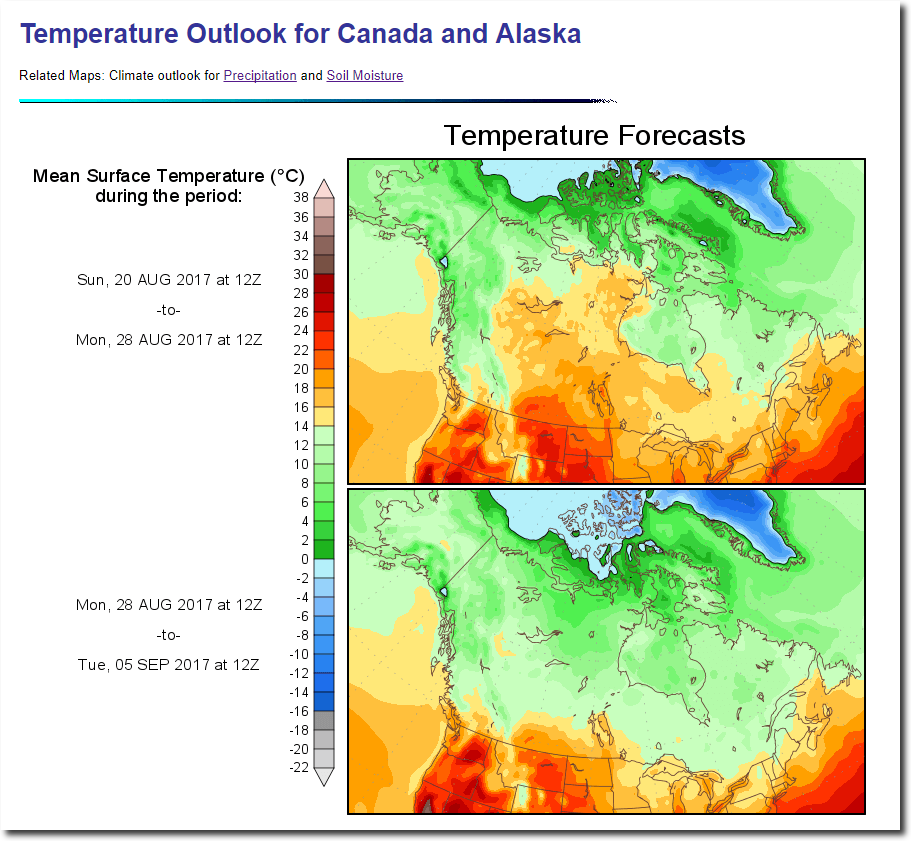
The Navy is predicting little change in ice extent over the next week.
arcticicen_nowcast_anim30d.gif (754×667)
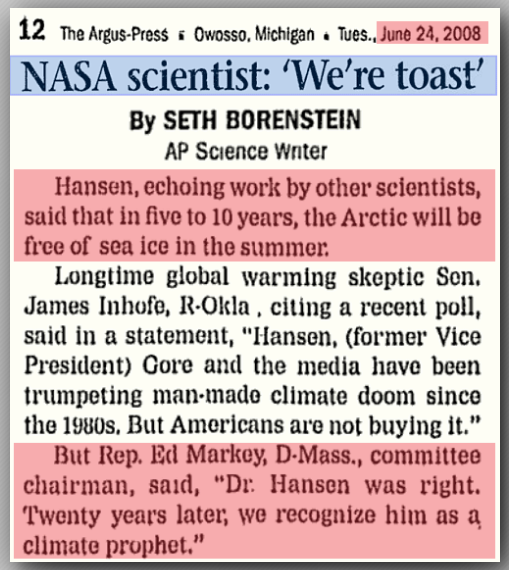
The Navy previously forecast an ice-free Arctic by 2014.
NASA’s top climate prophet agreed.
The Argus-Press – Google News Archive Search
And Nobel Laureate Al Gore spread the news to the world.
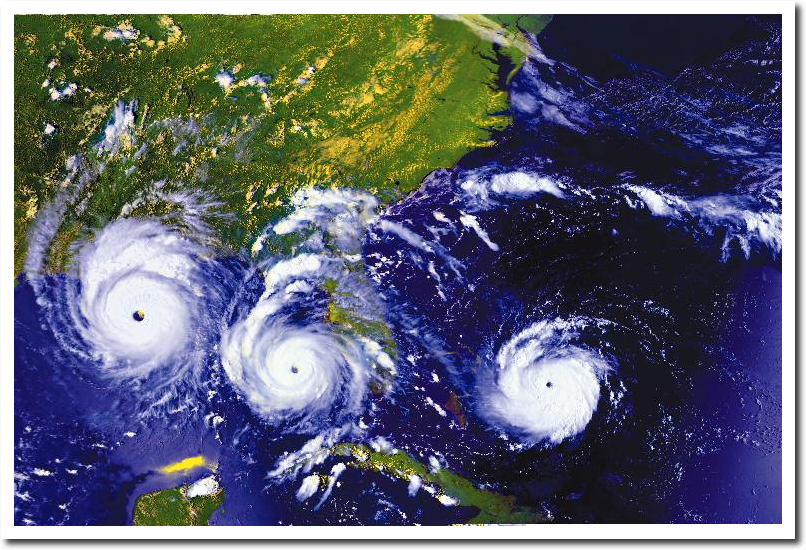
This week in 1992, Hurricane Andrew hit Florida with 146 MPH winds. It was the last category 5 hurricane to hit the US.
Andrew’s Path
CO2 was just over 350 PPM at the time. If this happened now, experts would say they were 100% certain it was due to high CO2 levels. And as always, they would be lying.
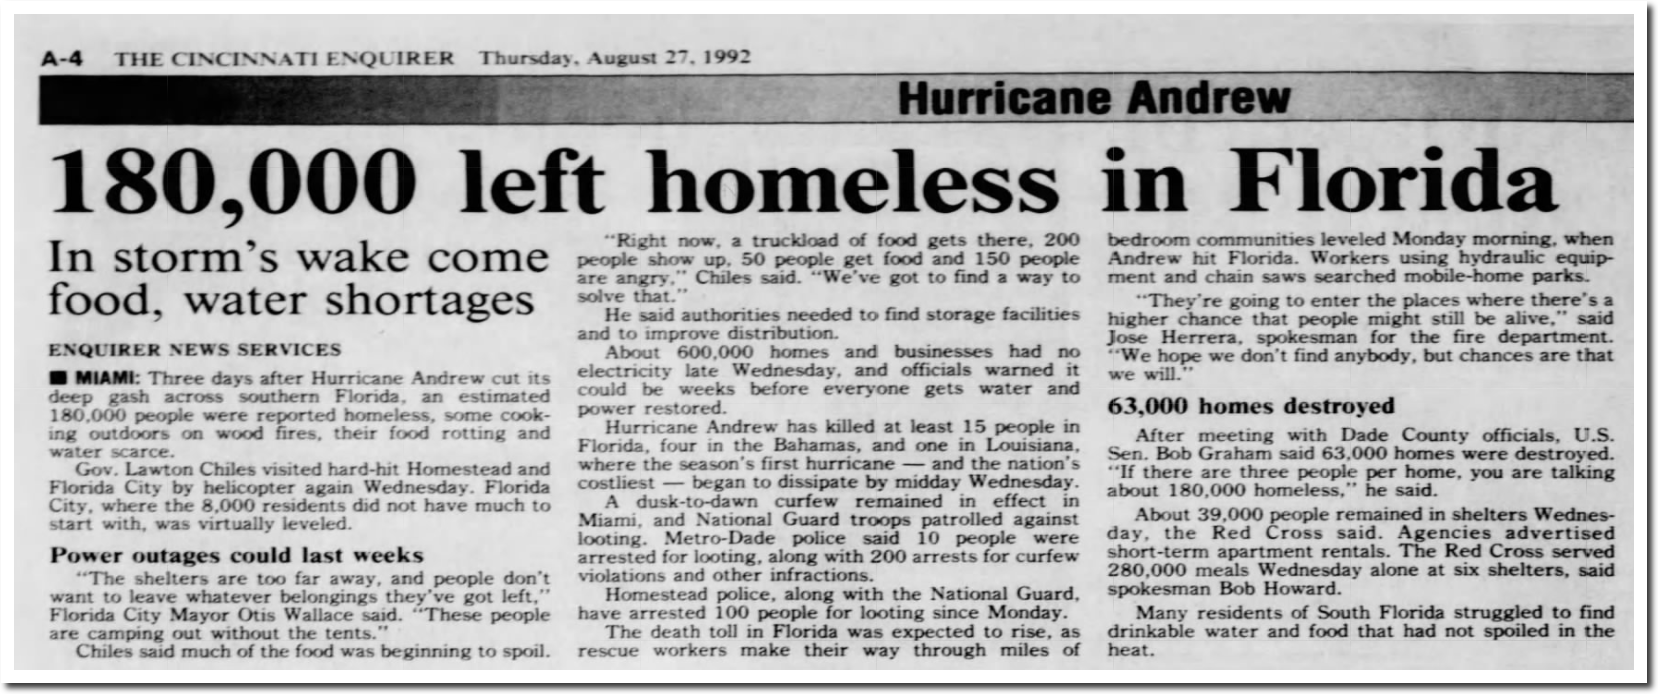
27 Aug 1992, Page 4 – The Cincinnati Enquirer at Newspapers.com
Last year, the fake news Washington Post reported that skeptic Andreas Munchow became convinced of global warming by studying the behavior of Greenland’s Petermann Glacier since 2012.
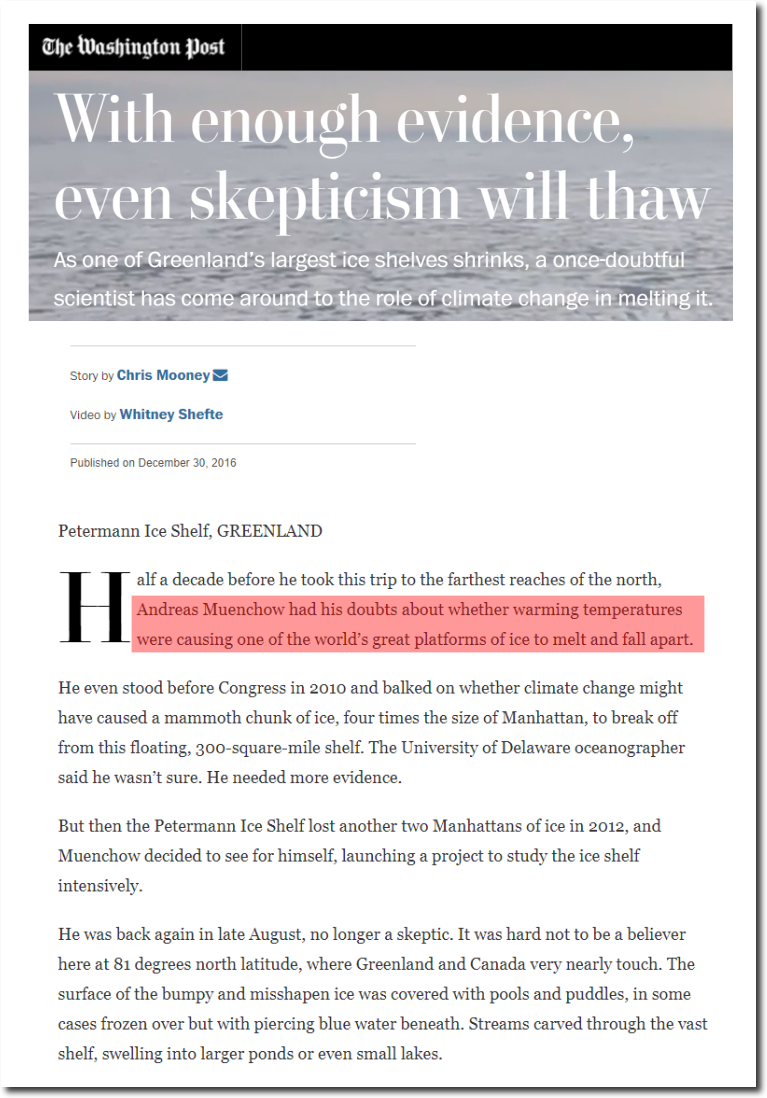
Fascinating propaganda, except for the fact that the Petermann Glacier has grown several kilometers since 2012.
And Greenland’s surface has gained ten times as much mass this year as 2012.
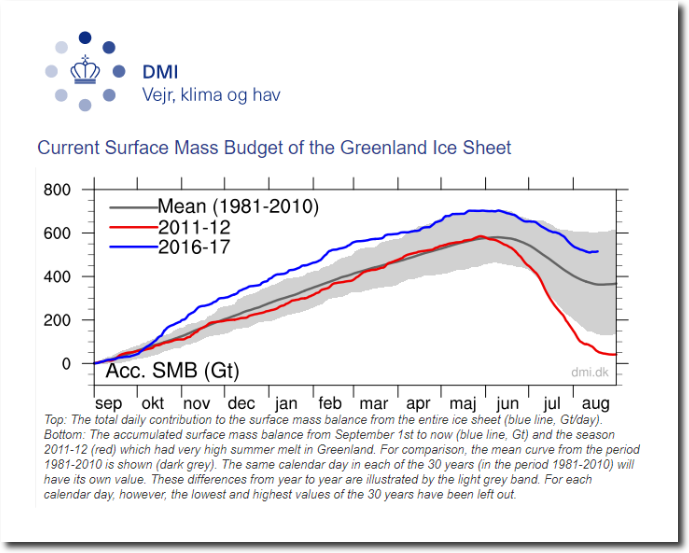
Greenland Ice Sheet Surface Mass Budget: DMI
Greenland’s glaciers are gaining both area and depth, but climate alarmists operate in the fourth dimension
