The graph below shows raw (blue) and adjusted (red) temperature trends for each USHCN station, sorted by state. NOAA adjusts tampers with the century long temperature trend at the vast majority of US stations, and turns most of the from negative trends into positive trends.

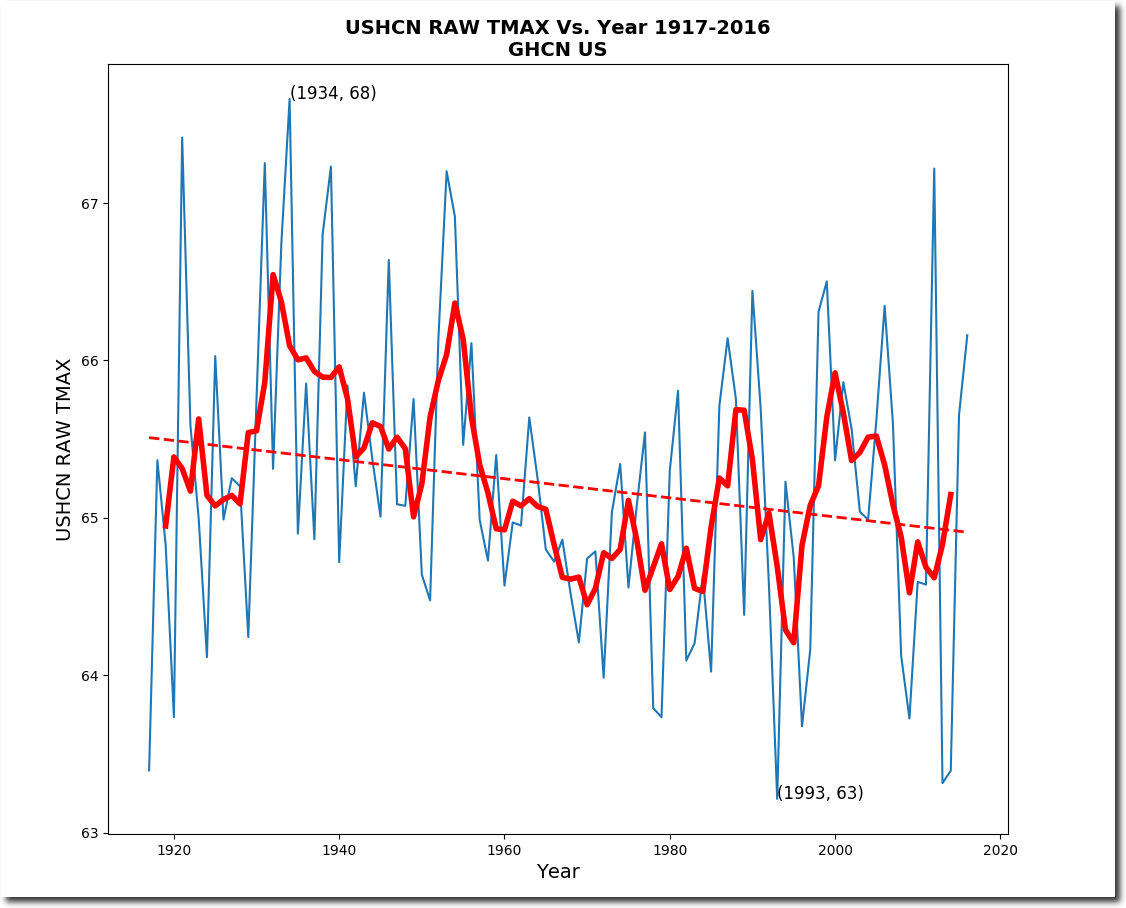
The measured thermometer data shows a sharp drop in US maximum temperatures over the past century.
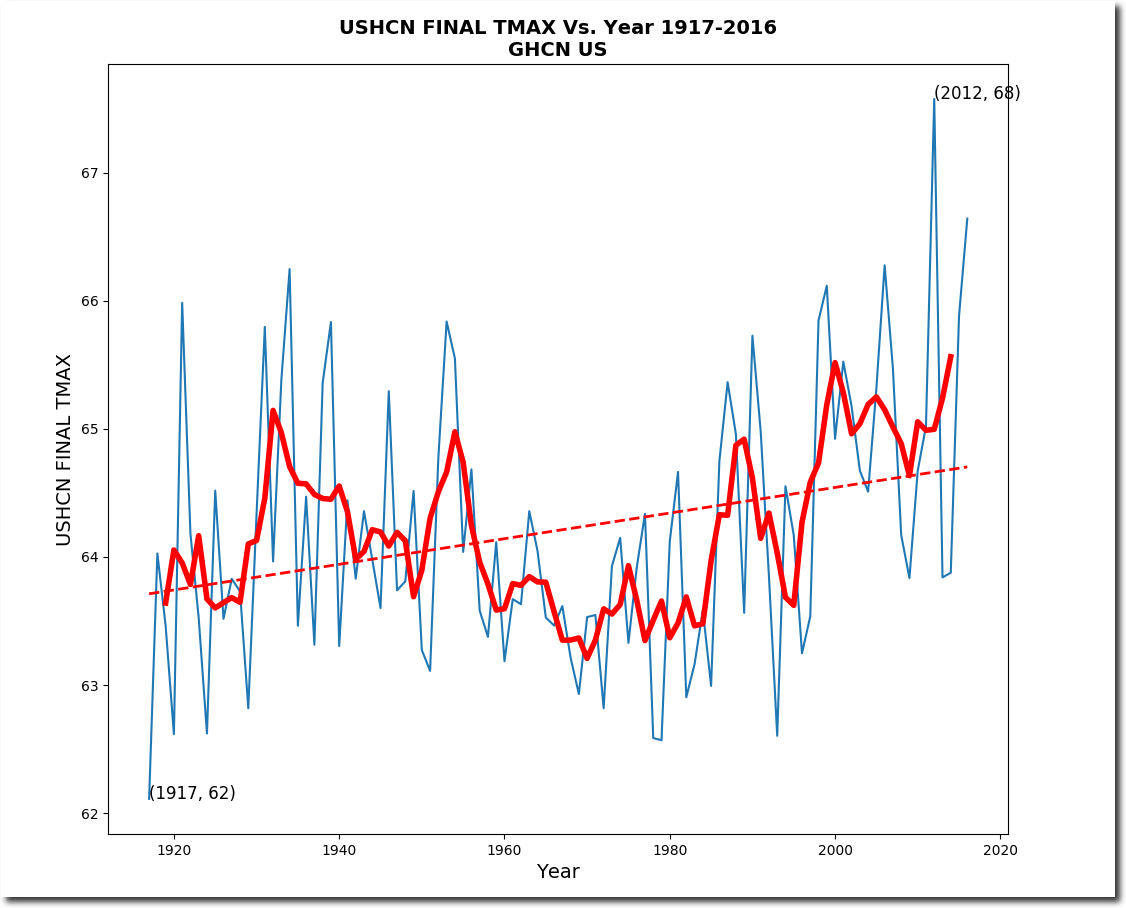
NOAA massively tampers with the data to turn a cooling trend into a warming trend.
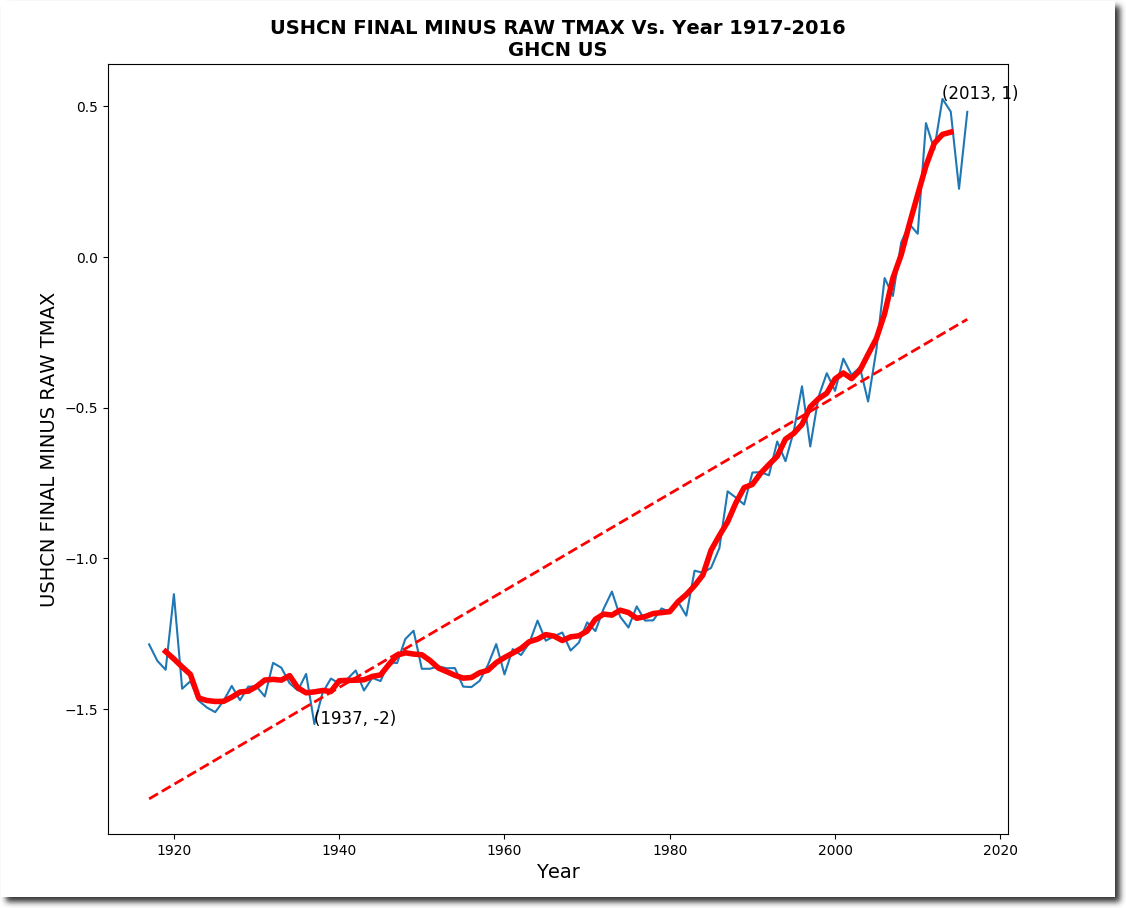
The data tampering forms a real hockey stick, unlike Mikey Mann’s fake one.
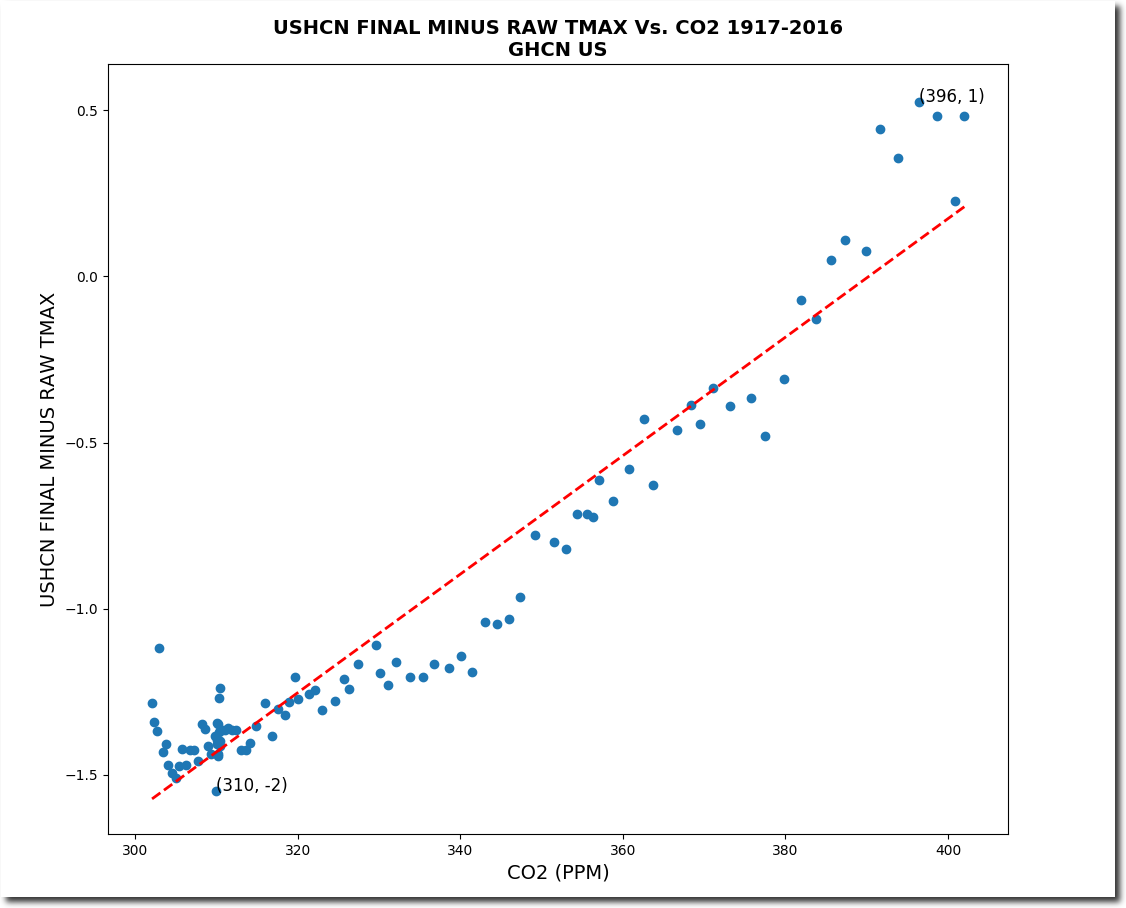
And in the ultimate science fraud, NOAA precisely tampers with data to conform with their CO2 warming theory.