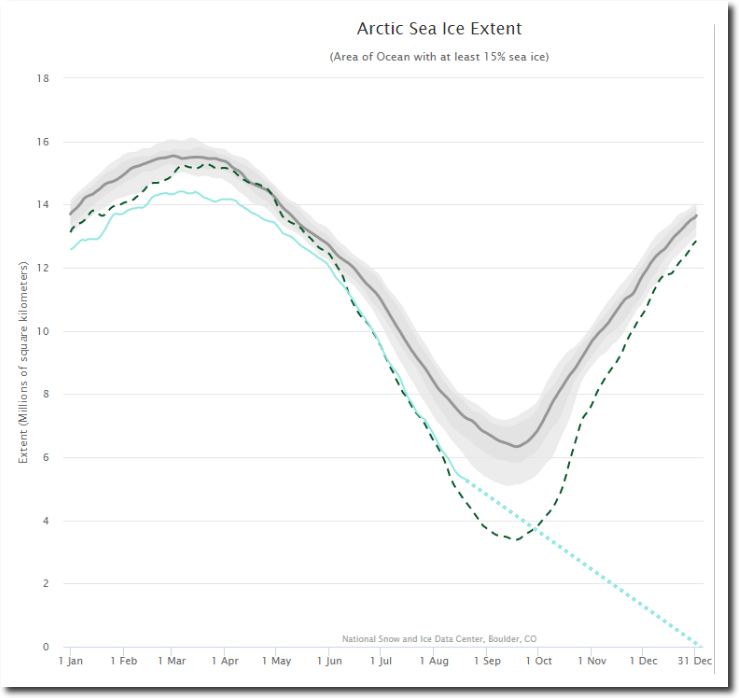
Settled science requires constant changes, and I have again updated my ice-free Arctic forecast. It now uprears the Arctic won’t be ice-free until springtime.
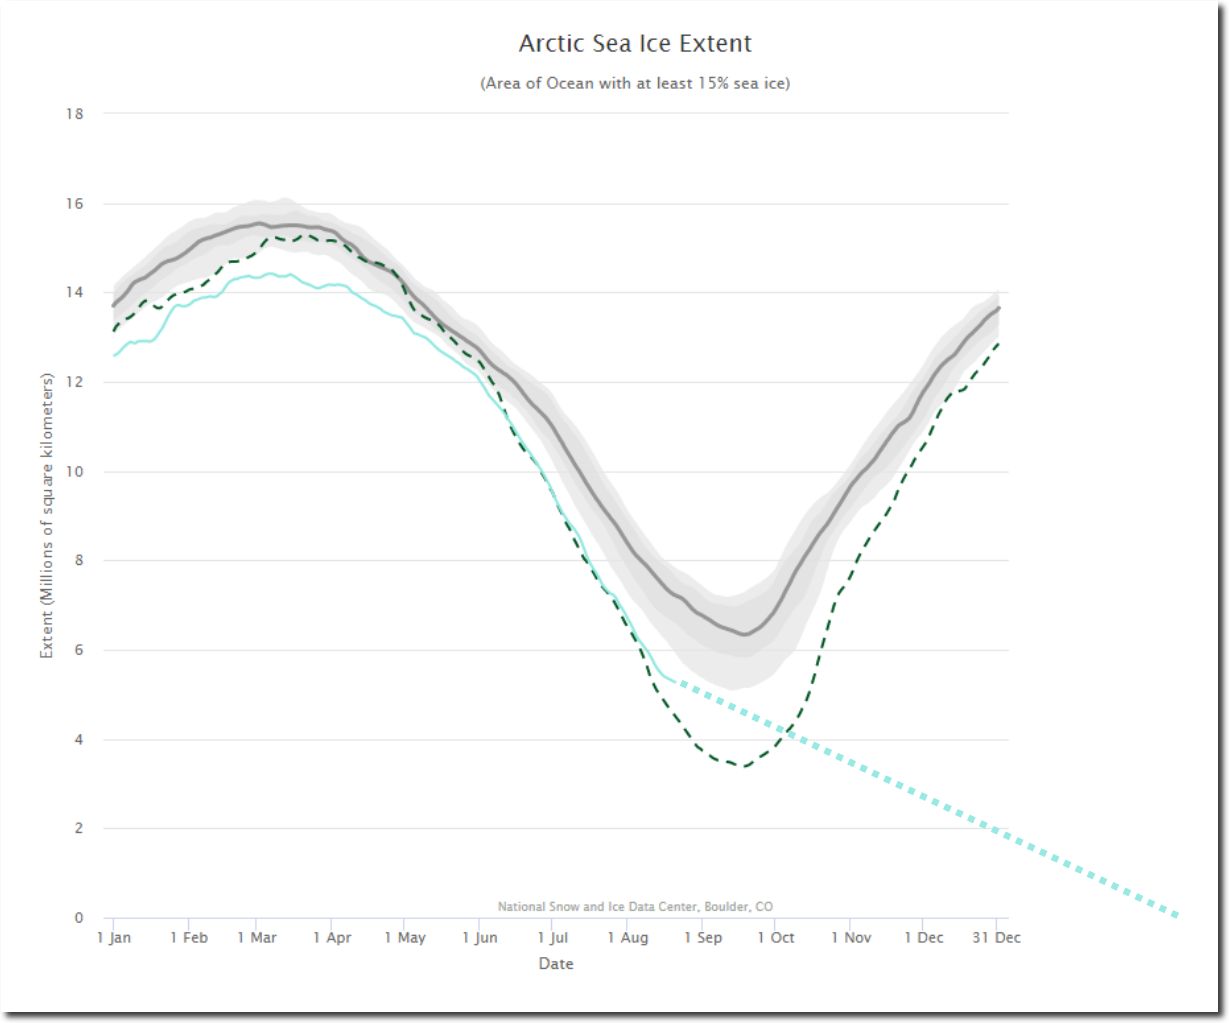
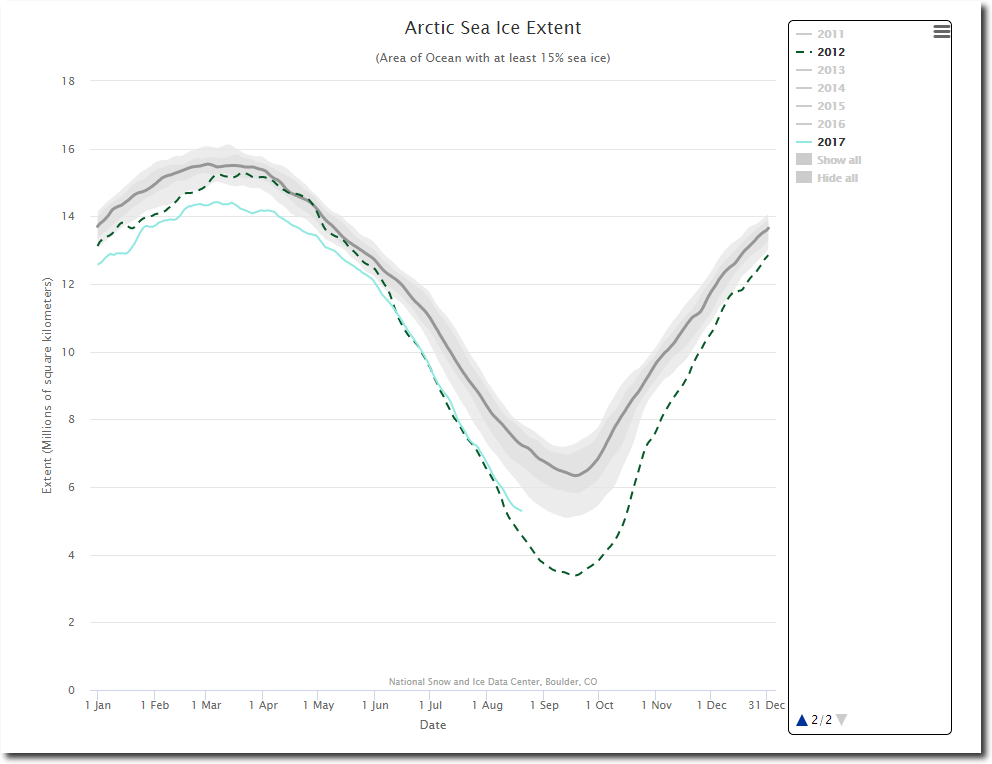
Charctic Interactive Sea Ice Graph | Arctic Sea Ice News and Analysis
Climate alarmists were placing their hopes that winter-like storms in August would break up the ice this year like they did the previous two years – thus saving them from total embarrassment. But as I have been pointing out that approach is not only deceptive – but bad science.
The last two summers, Arctic alarmists got very lucky when late summer winter-like storms broke up the ice in the Chukchi and Beaufort Seas. But the longer term impact of those storms is that they cooled the deeper waters of those two seas, making it harder to melt the ice this summer.