In 2008, Hillary correctly predicted that Obama would give the Castros and Ayatollahs what they wanted, and get nothing in return.
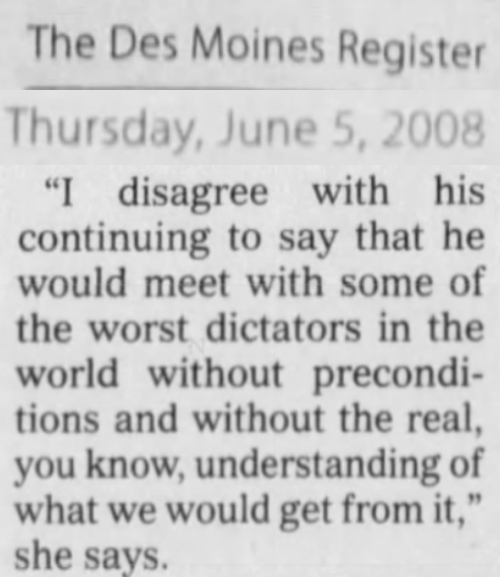
5 Jun 2008, Page 3 – The Des Moines Register at Newspapers.com
What she didn’t say was that she would help him do it.
In 2008, Hillary correctly predicted that Obama would give the Castros and Ayatollahs what they wanted, and get nothing in return.
5 Jun 2008, Page 3 – The Des Moines Register at Newspapers.com
What she didn’t say was that she would help him do it.
NOAA claims that increased CO2 will lead to a huge number of 95 degree days. For example close to one hundred 95 F (35C) days per year in Iowa and Missouri.
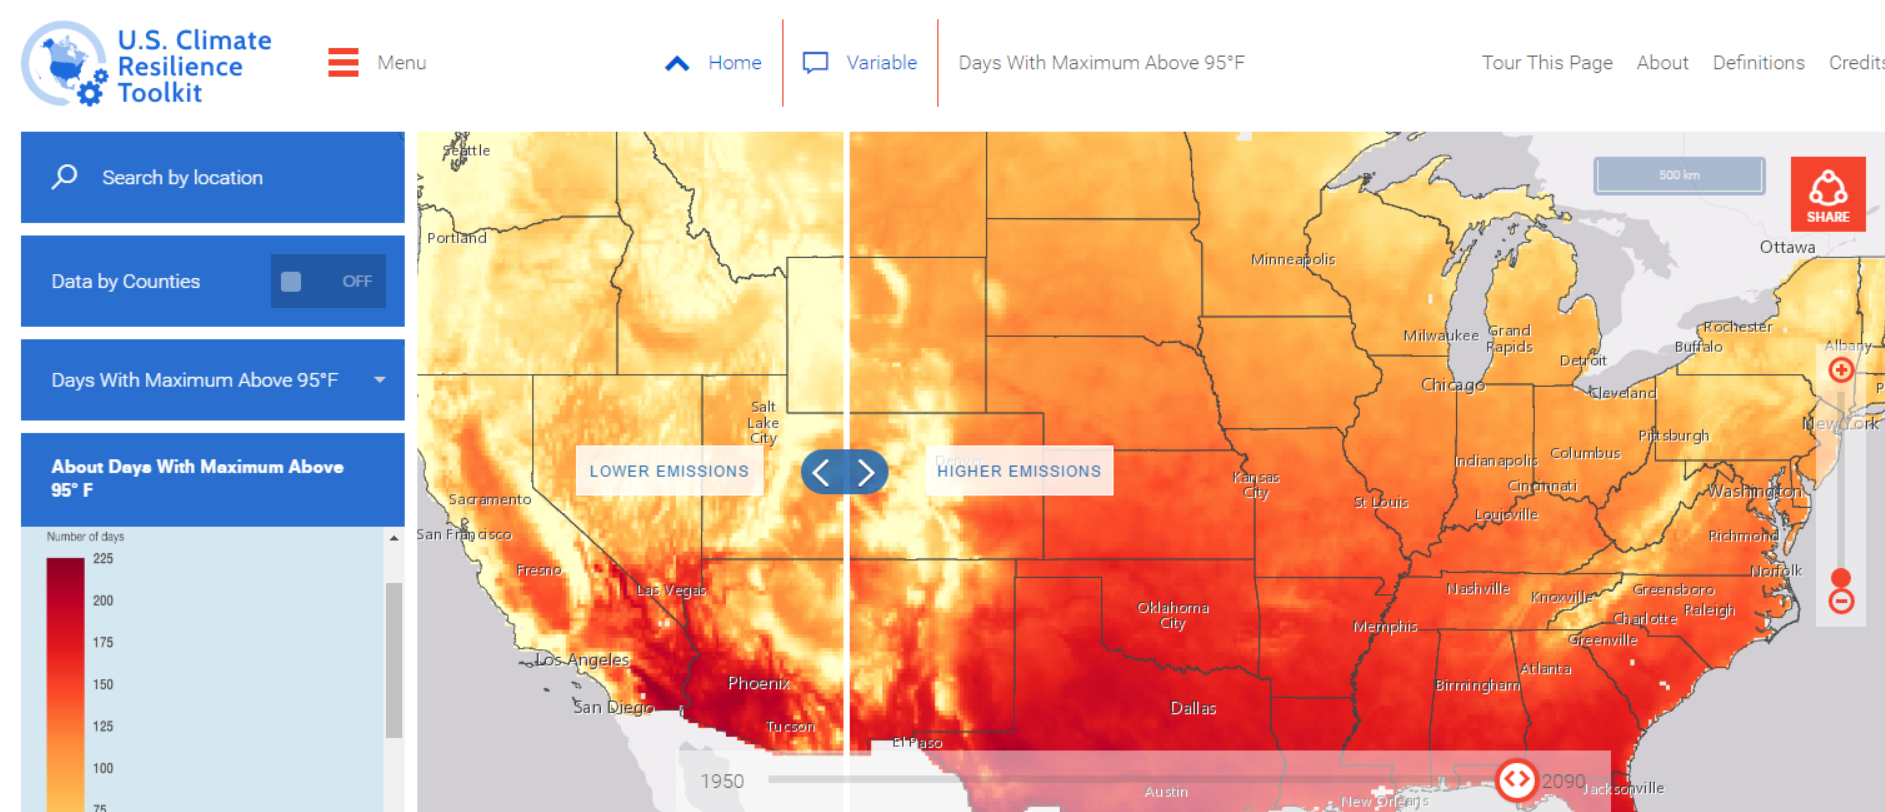
In fact, the number of 95 degree days in the midwest has plummeted over the past 50 years.
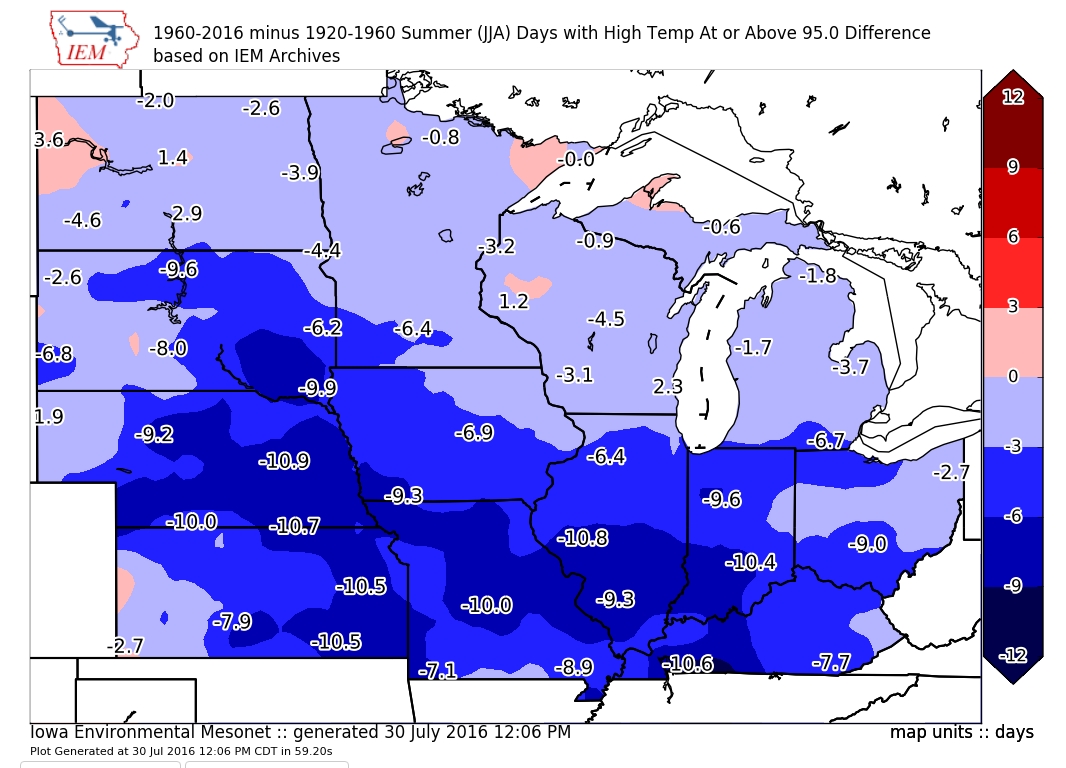
The number of 95 degree days in Missouri used to be more than 30 pear year, but now is close to zero.
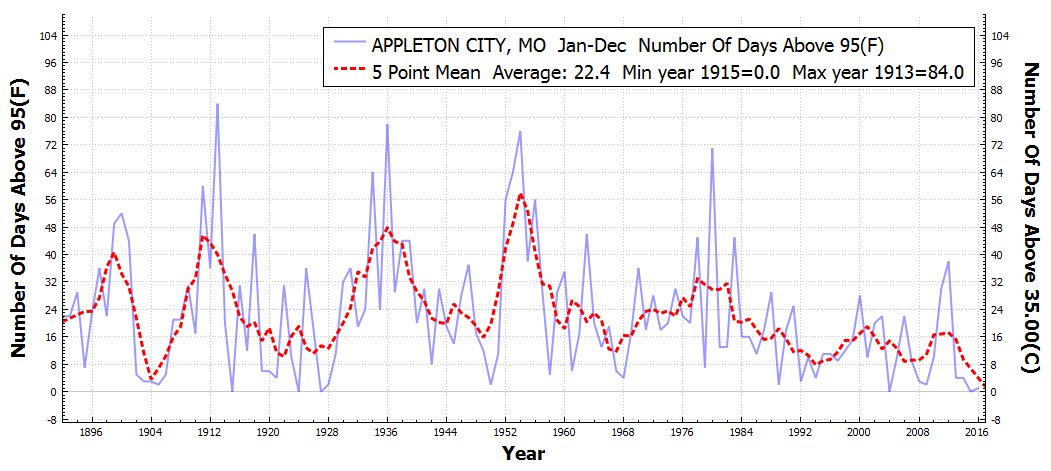
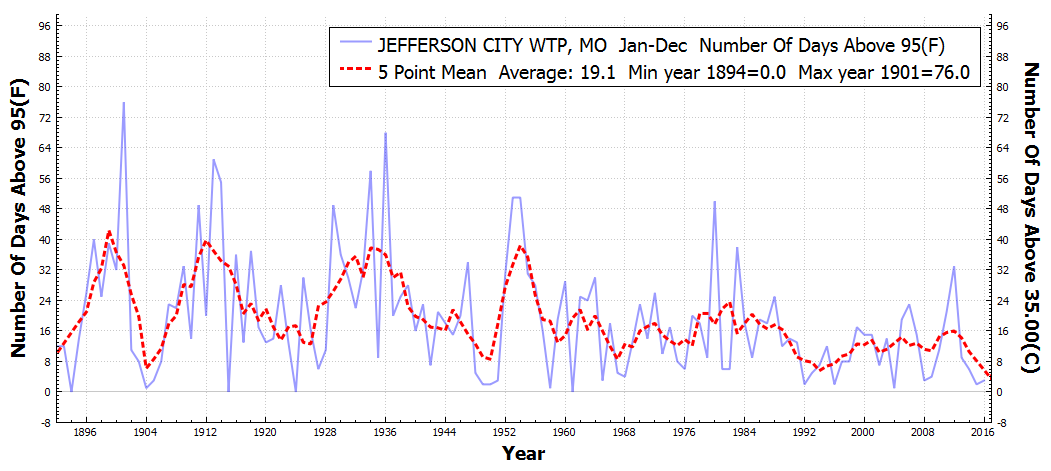
The NOAA claims have no basis in science, and are the exact opposite of what is actually happening. Your tax dollars are paying for this fraud.
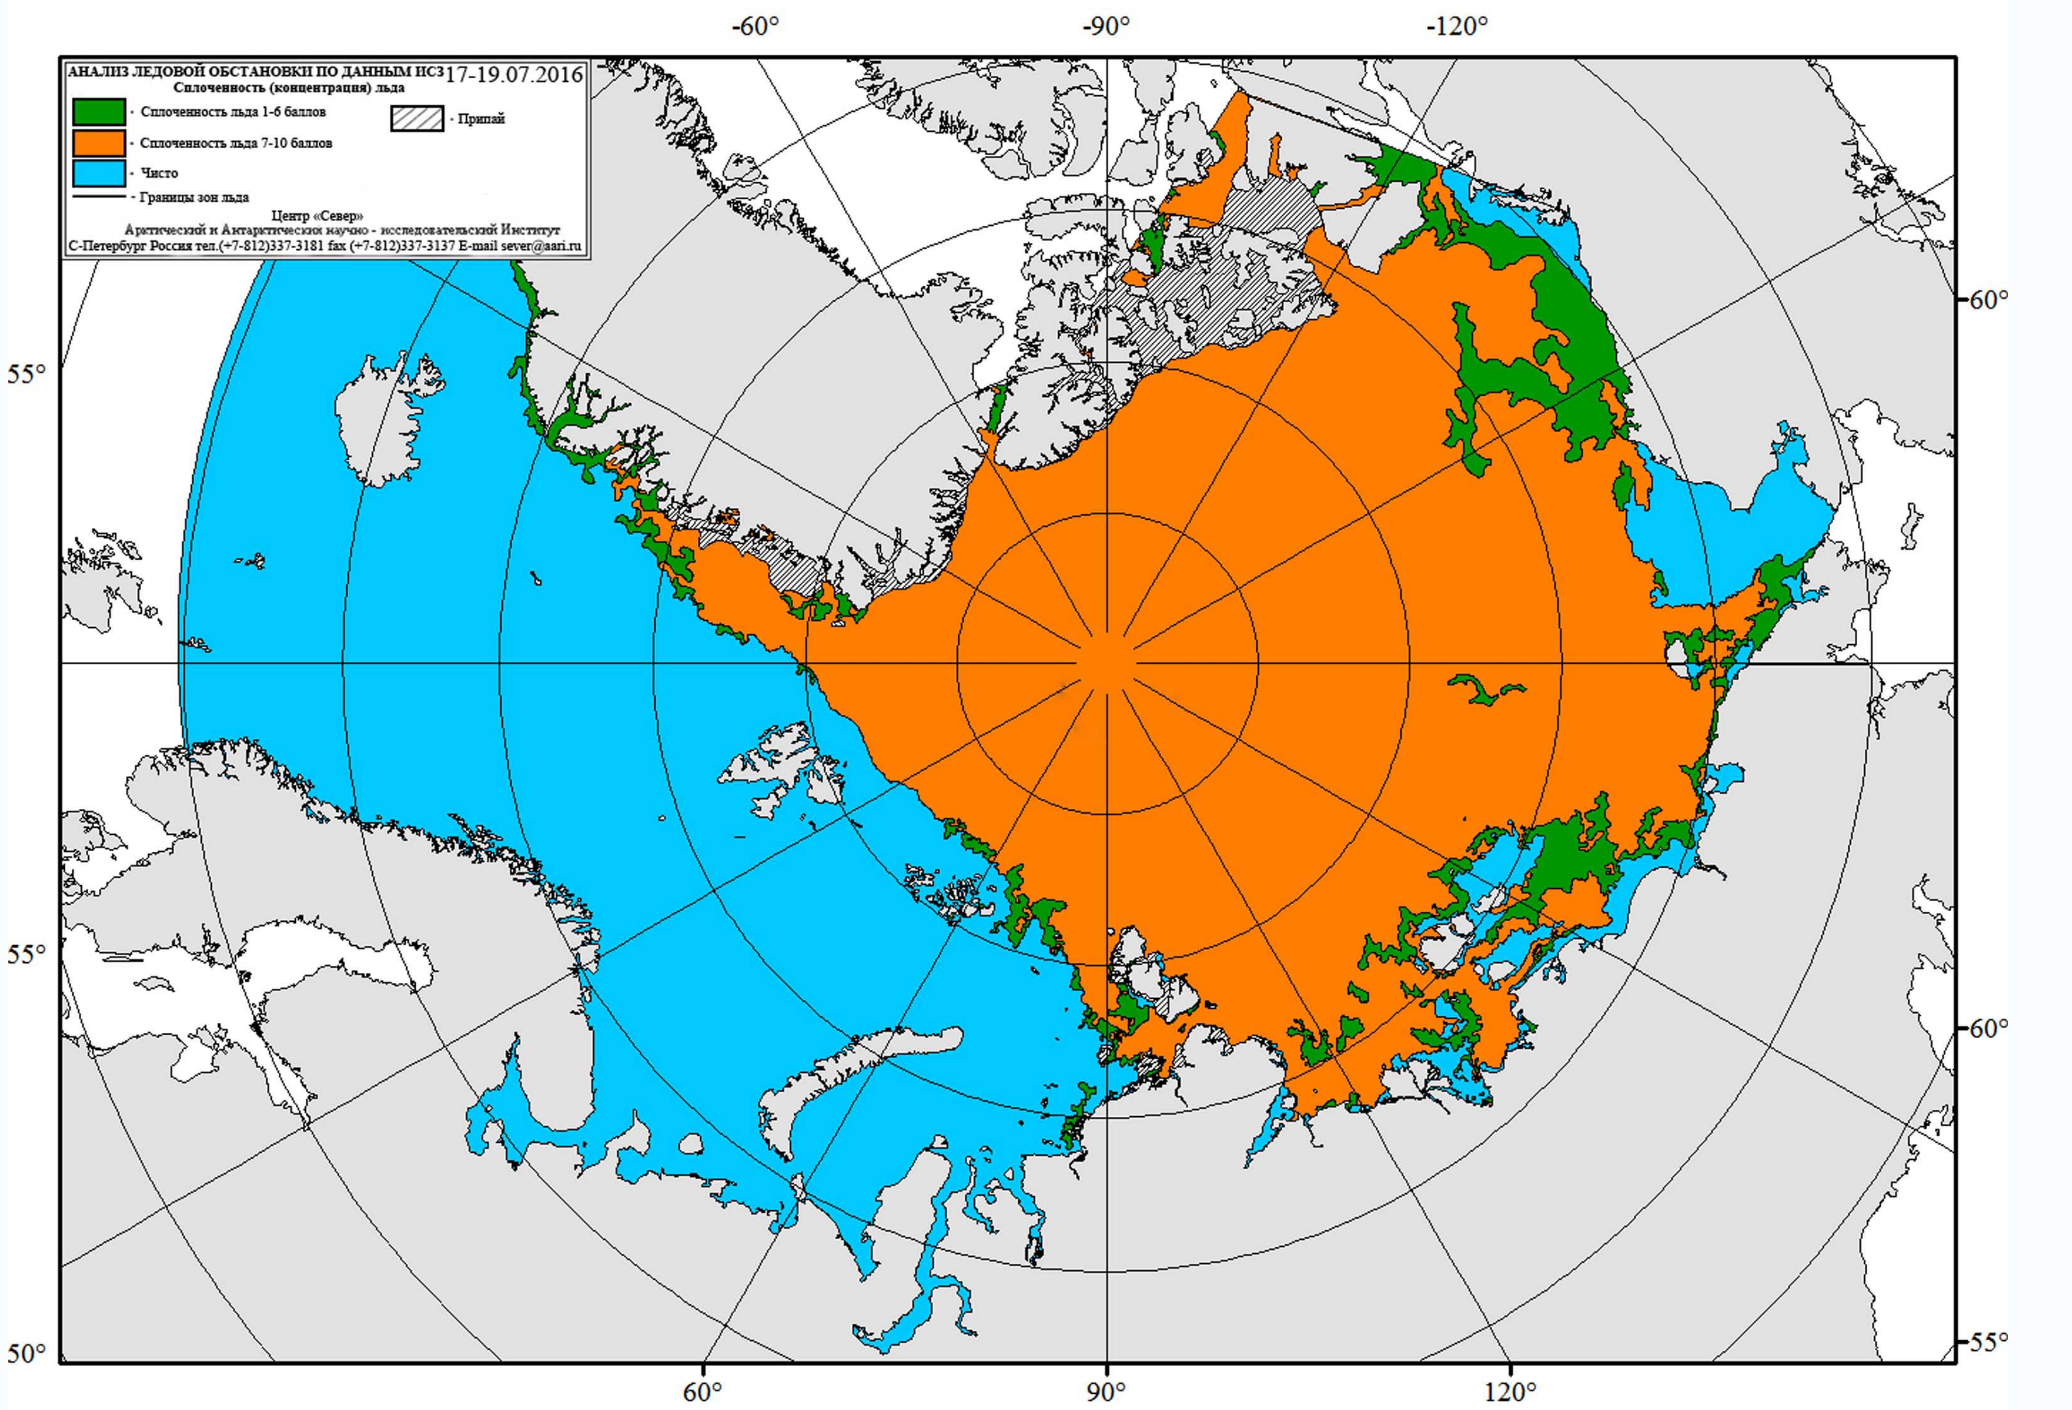
Note in the map below that South Carolina has stations which are heating rapidly (orange) right next to stations which are cooling rapidly (blue.)
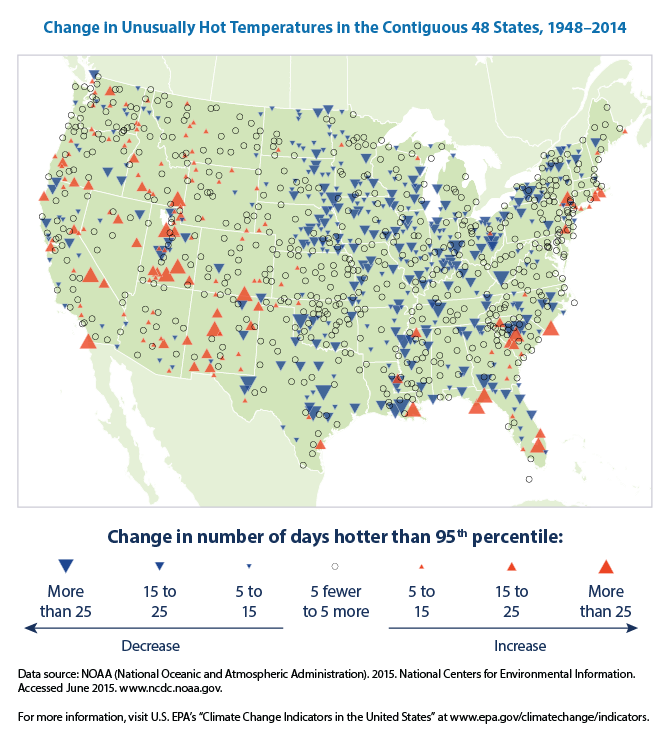
High and Low Temperatures | Climate Change | US EPA
They say the number of hot days at Blackville, SC has increased 28%, while Camden, SC has decreased by 18%. Both are rural stations near Columbia.
Look what they did! The pattern at both stations is very similar over the past 90 years (a large decline in the number of hot days) – but NOAA removed all of the hot pre-1948 temperatures from their analysis, and generated a meaningless statistic dominated by noise.
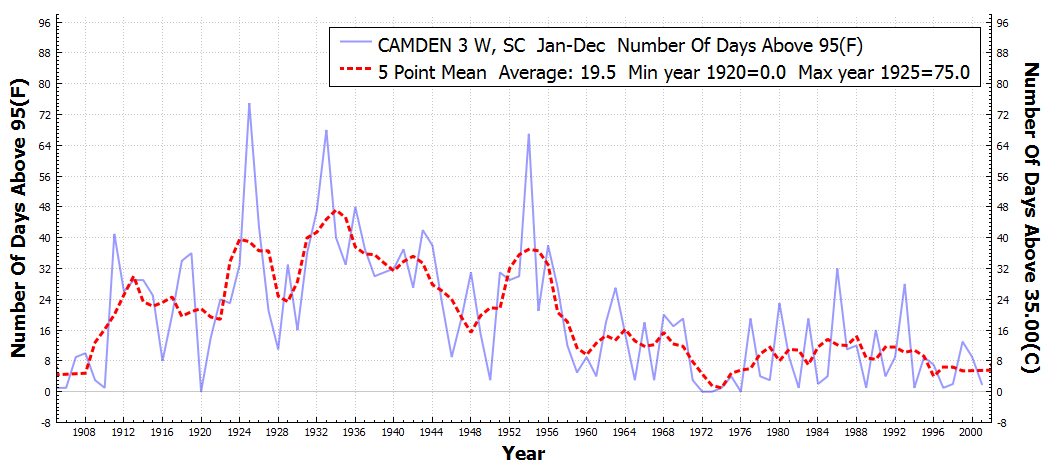
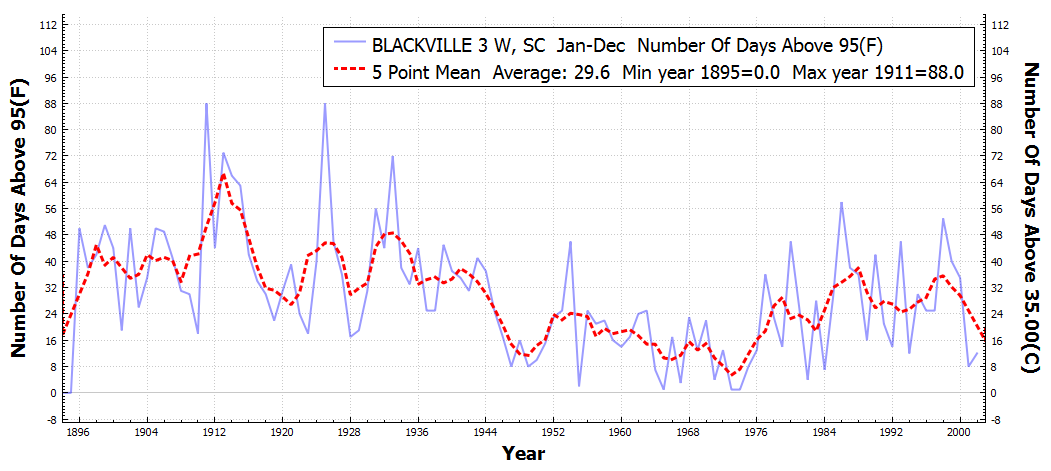
If the map at top was generated using data starting at 1920, it would be almost entirely blue. They have no reason to exclude pre-1948 data, other than the fact that it wrecks their scam.

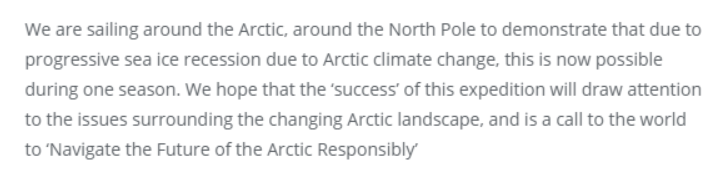
The Polar Ocean crew has learned that the Arctic is very cold and full of ice. Real geniuses.
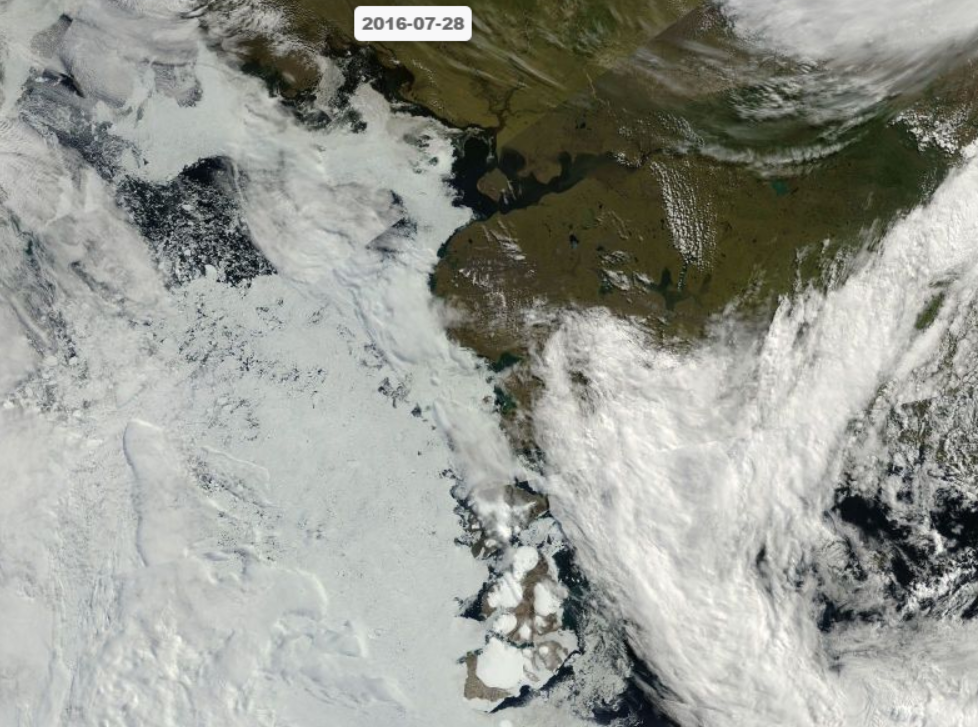
Our intrepid explorers have discovered that there is ice hundreds of miles from where it is shown on the maps. And they are worried about it.
Saw our first ICE today on my watch, just an hour ago. What is slightly worrying, it didn’t show up on the Radar. It’s probably good for the big icebergs, but not low ice in the water. I think we will see a lot more of that before the trip is out. You can’t beat that old eyeball.
They say that their mission is to prove that the ice is melting due to global warming”
However they are spending their time waiting, drinking and swearing – and now believe that success of their mission depends on “strong southerly winds.” Apparently they believe that strong southerly winds never happened before global warming.

Home – The Polar Ocean Challenge
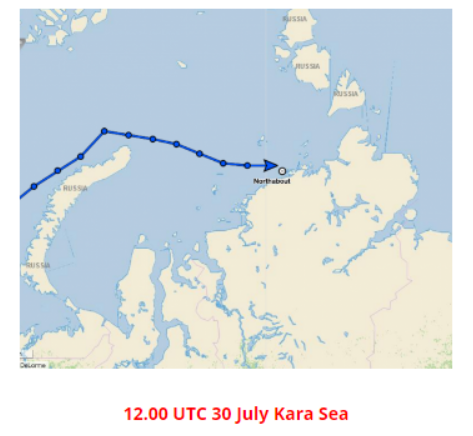
Their route is completely blocked, and the clouds which have been covering the Northeast Passage for the past month are not going anywhere. The sun is getting lower and lower every day and the Northeast Passage is not going to melt this year.
However, the Northeast Passage was navigated 140 years ago, before climate change, before the Internet, before satellites, before radar and before electric light.
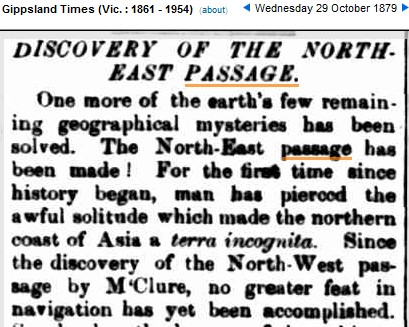
29 Oct 1879 – DISCOVERY OF THE NORTH-EAST PASSAGE.
Facts don’t matter to climate alarmists. Like all religious fanatics, they maintain their beliefs in defiance of all evidence. But this has been going on since before Professor Nordenskjold navigated the Northeast Passage,
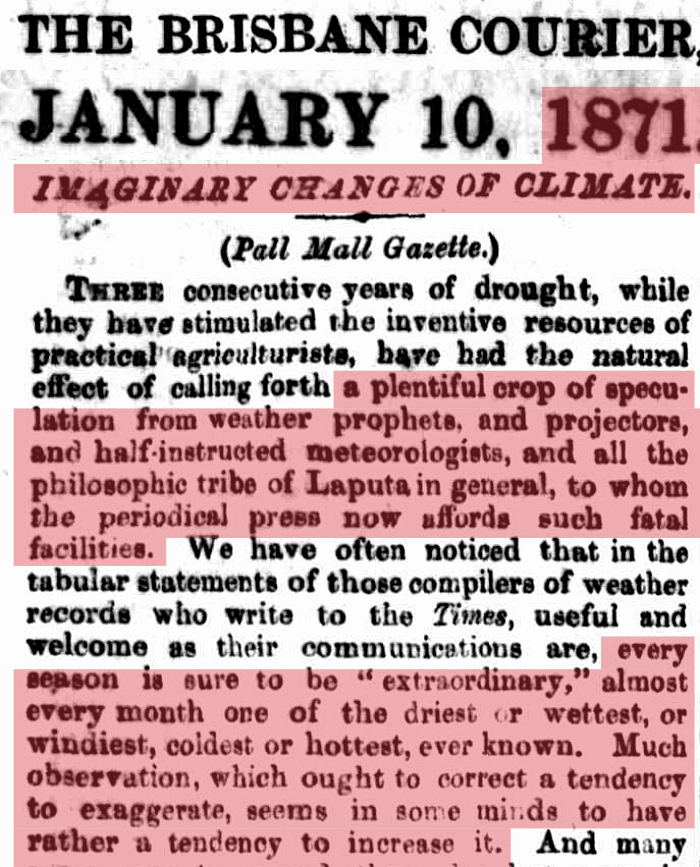
10 Jan 1871 – IMAGINARY CHANGES OF CLIMATE. (Pall Mall Gazette.)
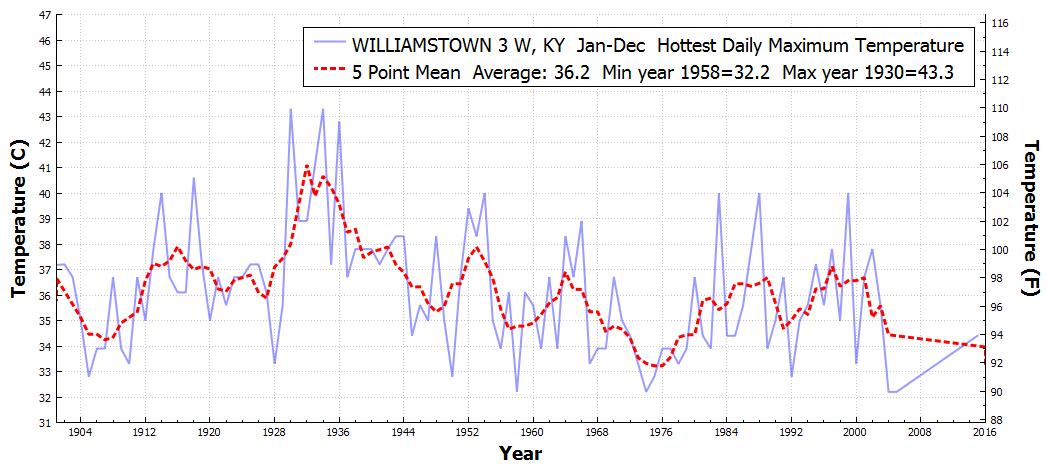
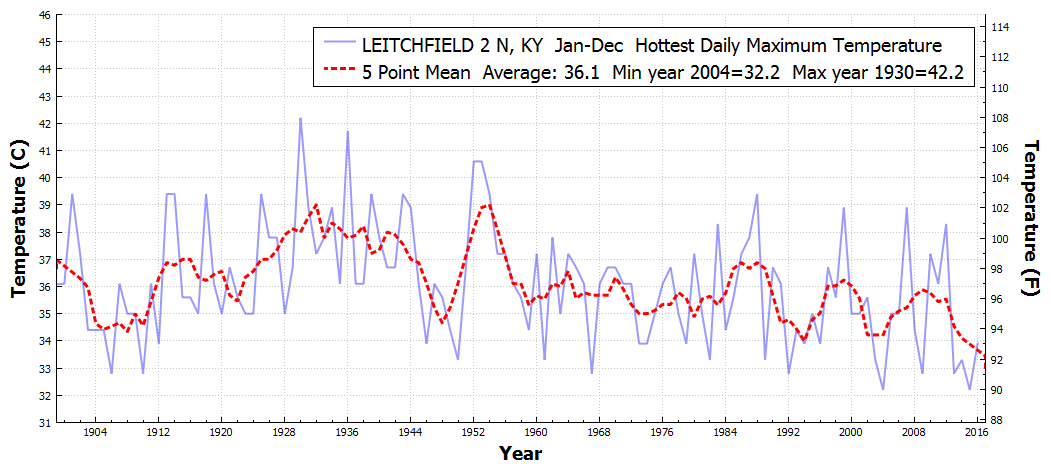
These stations in Kentucky, Indiana, Ohio and Virginia set their all-time hottest temperature record on this date in 1930.
GREENSBURG          	KY	114
WASHINGTON 1 W      	IN	113
SHELBYVILLE 1 E     	KY	112
MADISON SEWAGE PLT  	IN	110
WILLIAMSTOWN 3 W    	KY	110
BEREA COLLEGE       	KY	108
LEITCHFIELD 2 N     	KY	108
ASHLAND             	KY	107
PORTSMOUTH-SCIOTOVIL	OH	107
WAVERLY             	OH	107
ROCKY MT            	VA	103
BURKES GARDEN       	VA	97
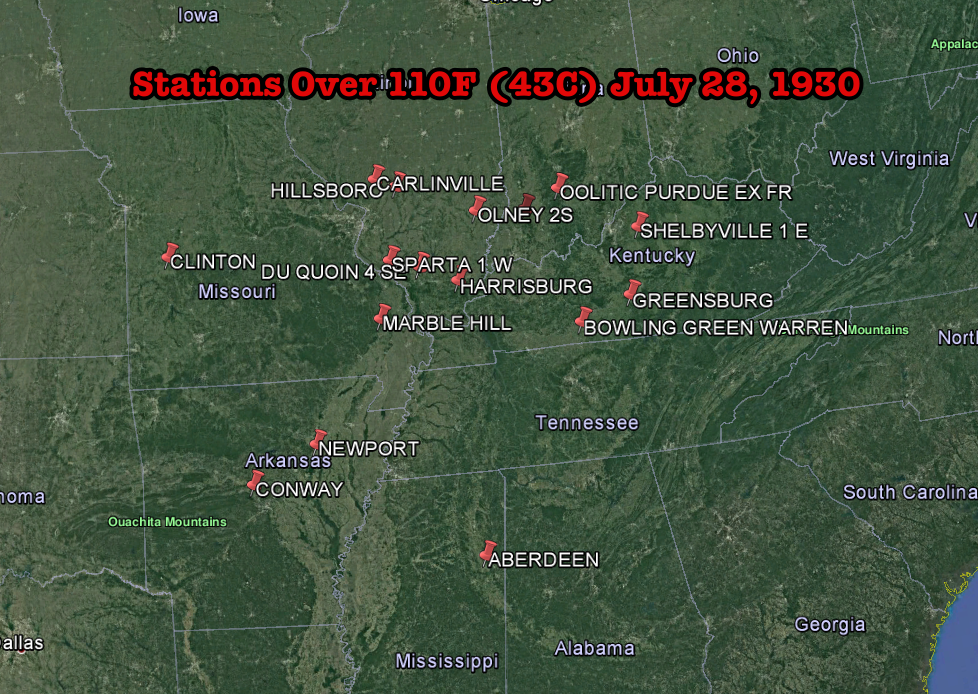
Hottest temperatures in Kentucky have plummeted since then.
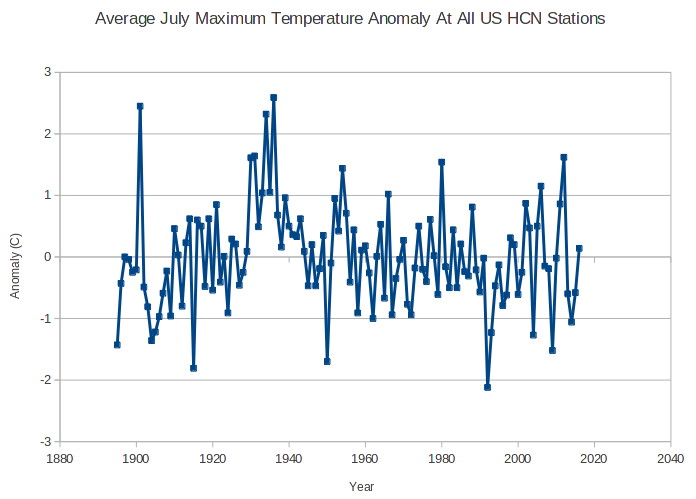
July afternoon temperature anomalies in the US (so far) are just above average since 1895, and the occurrence of 100 degree days was not far above a record low. Experts will describe this as the “hottest July ever.”
The three hottest July’s in the US were 1936, 1934, and 1901.

Bernie was born in 1941, and by the time he was nine years old he had melted several miles of Alaska’s Muir Glacier.
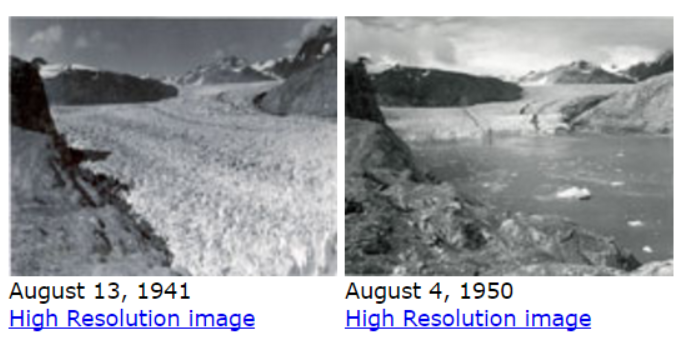
Glacier and Landscape Change in Response to Changing Climate
Bernie’s first job was mayor of Burlington at the tender age of 40, and he has accumulated nearly a million dollars as a public servant since then.

Bernie Sanders Net Worth – Salary, House, Car
Bernie continues his fight for the little guy, by endorsing Wall Street and banking stooge Hillary Clinton.
NOAA says that there has been no increase in heatwaves east of the Rockies, which covers more than two-thirds of the US.
But while the Midwest joins the overall warming trend, it has not been hit frequently by summer heat waves, according to Ken Kunkel of NOAA’s National Centers for Environmental Information
“The Midwest has not experienced any substantial summer warming and this spills over into heat waves,” he said. “The period of most heatwaves for the Midwest remains the 1930s Dust Bowl era.” In North America, there has been an increase in heatwaves west of the Rocky Mountains, but to the east, generally not, he said
This directly contradicts NOAA’s CEI (Climate Extremes Index) which shows a very large increase since 1970 in the area of the US affected by unusual summer heat.
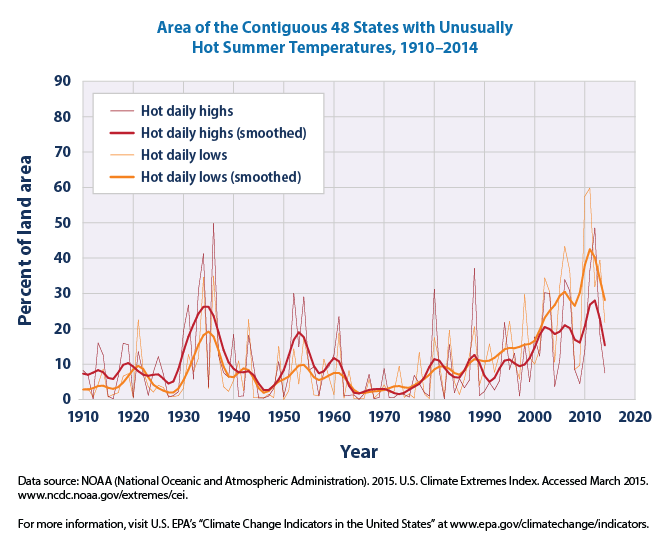
High and Low Temperatures | Climate Change | US EPA
The NOAA CEI graph above is baseless. The area of the US affected by hot summer temperatures has plummeted since the 1930’s. This is confirmed by the EPA graph below, which is also derived from NOAA (non-CEI) data.
High and Low Temperatures | Climate Change | US EPA
I’ve detailed this below.
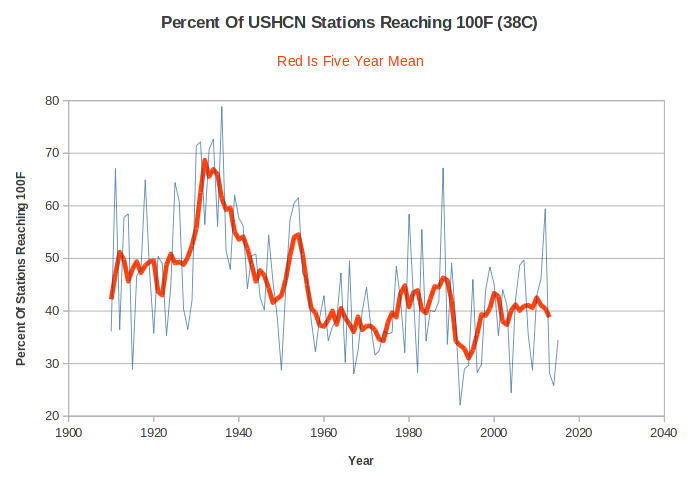
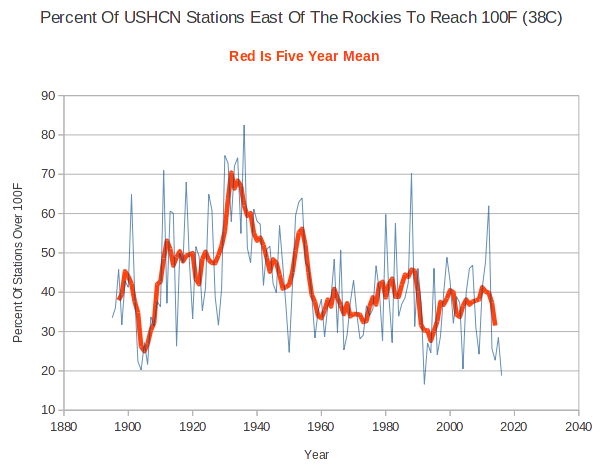
Splitting it up geographically, the area east of the Rockies (about 70% of the US) has seen a decrease of more than 50% in the area covered by 100 degree weather.
West of the Rockies has also seen no increase, and is currently near record lows.
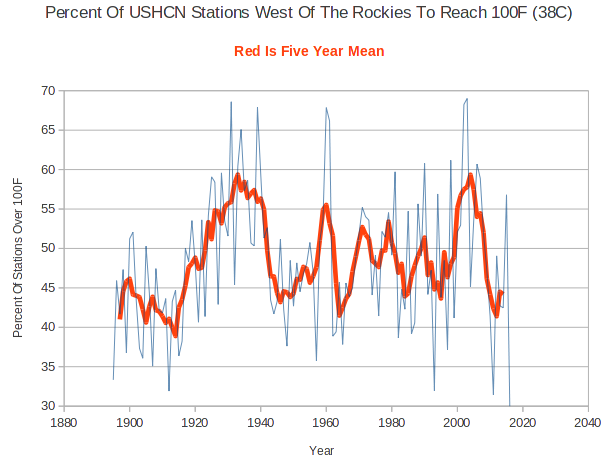
Let’s focus specifically on 2012. NOAA CEI shows 2012 almost as hot as 1936, but it wasn’t even close in either the west or the east. The NOAA CEI graph is completely fake data.
The maps below show visually just how much hotter 1936 was than 2012.
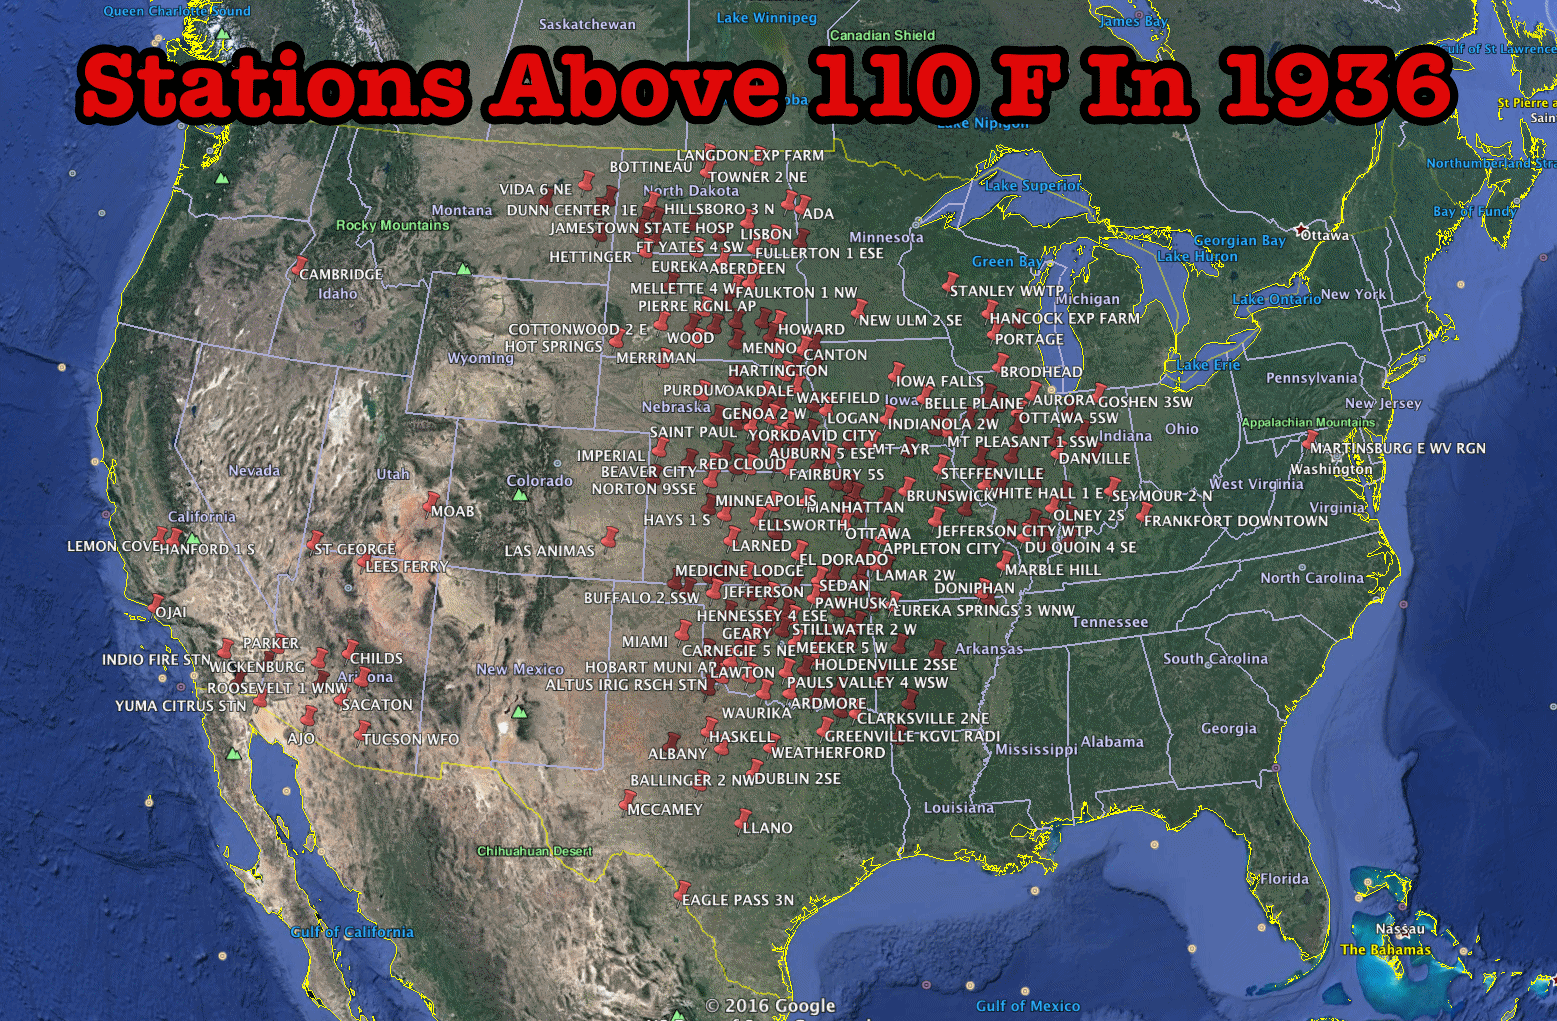
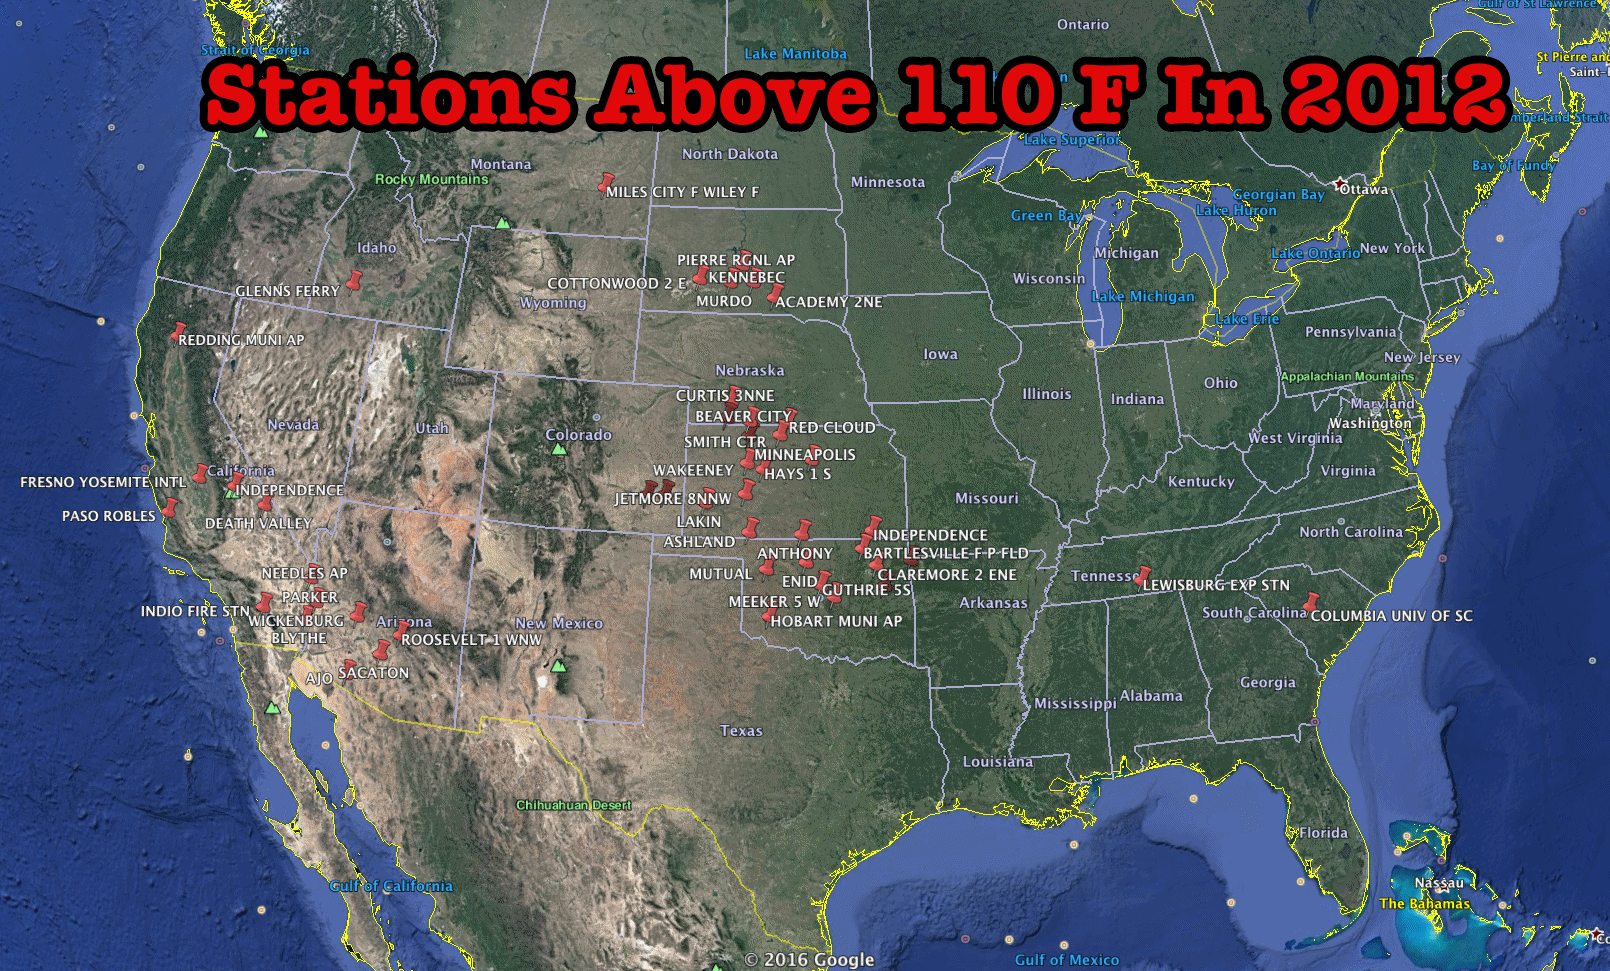
NOAA CEI is just one more example of blatant government climate fraud.
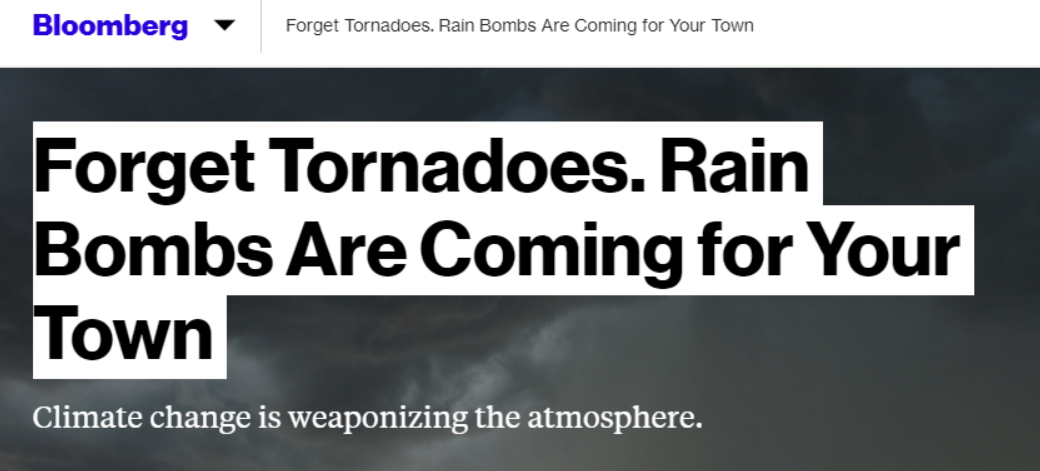
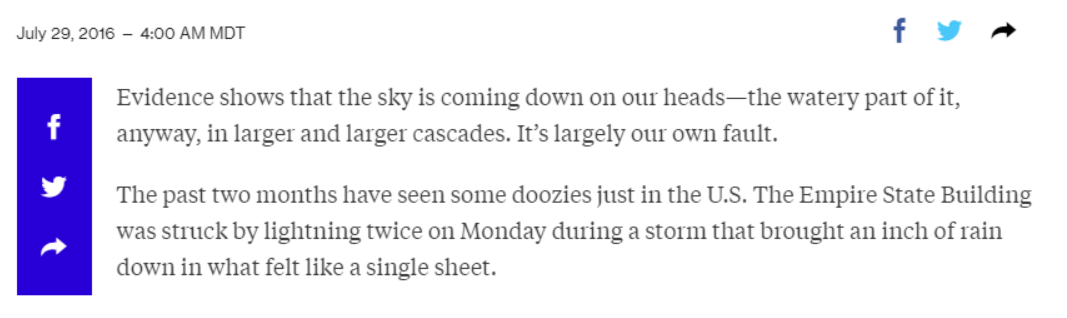
Tornado activity has been near record lows, so Bloomberg wants you to forget about them and focus on The Empire State Building being struck by lightning as evidence of “climate change.”
It’s largely our own fault.
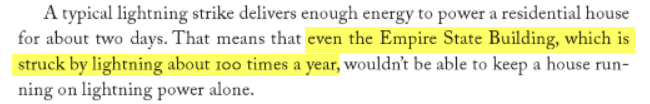
The Empire State Building actually gets struck by lightning an average of once every four days.
Serious Scientific Answers to Absurd Hypothetical Questions
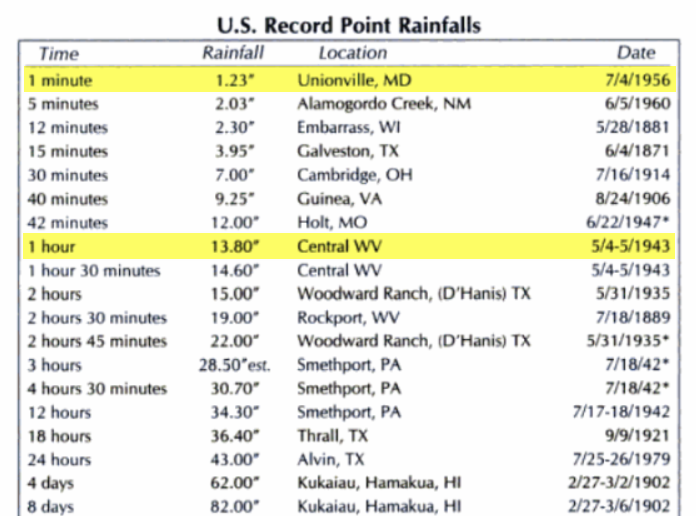
Every short term rainfall record in the US occurred before 1980. In 1956, Maryland received over an inch of rain in one minute.
Extreme Weather: A Guide & Record Book – Christopher C. Burt – Google Books
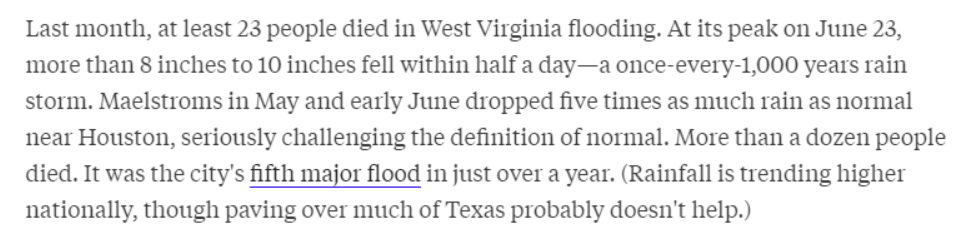
Then the geniuses at Bloomberg claim that 8-10 inches of rain in 12 hours in West Virginia is a “1,000 years rain.”
Forget Tornadoes. Rain Bombs Are Coming for Your Town – Bloomberg
In 1943, West Virginia had almost 14 inches of rain in one hour. Apparently that must have been more than 1,000 years ago. Pennsylvania had 34 inches of rain in 12 hours in 1942.
Climate alarmists are no different from 16th century Europeans who burned 15,000 witches for “cooking the weather.” They observe ordinary events, and convince themselves that it is unprecedented and somebody’s fault.