Alterations To Surface Temperatures Since 1974

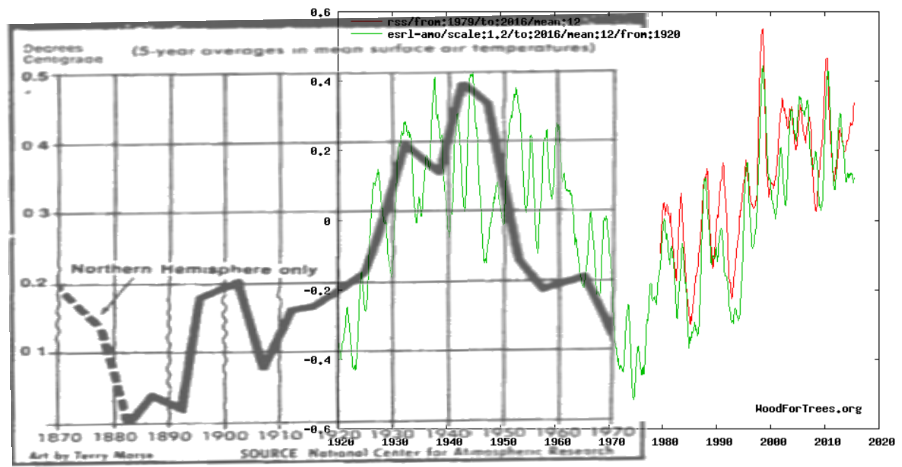
The graph below shows how NASA has been steadily erasing the 1940’s blip, and subsequent 1940 to 1970 global cooling.

2016-05-09050642

1981: 1981_Hansen_etal_1.pdf    2001: Fig.A.ps     Current: Fig.A.gif

Just since 2001, NASA has increased 1880 to 2000 warming by 0.5 degrees by altering the data.

2016-05-09052912

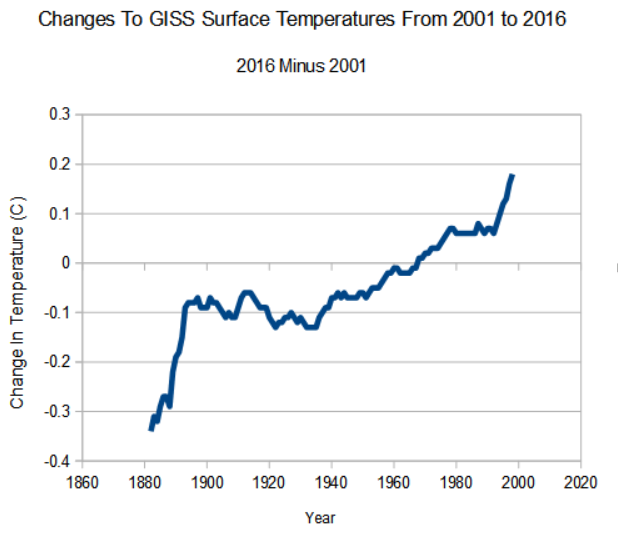
2001: FigA.txt Current: Fig.A.txt

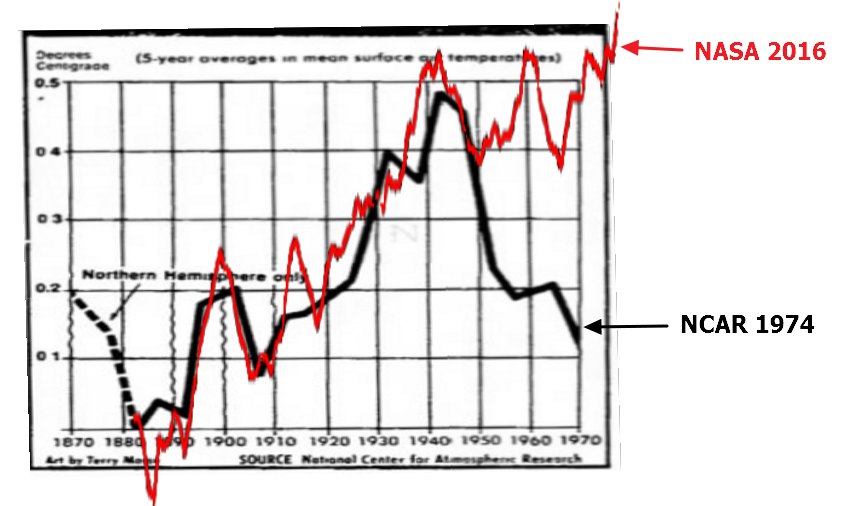
The next graph superimposes NCAR 1974 at the same scale, and shows how Hansen was already erasing the 19140-1970 cooling in his 1981 version.

2016-05-09054903

NCAR 1974

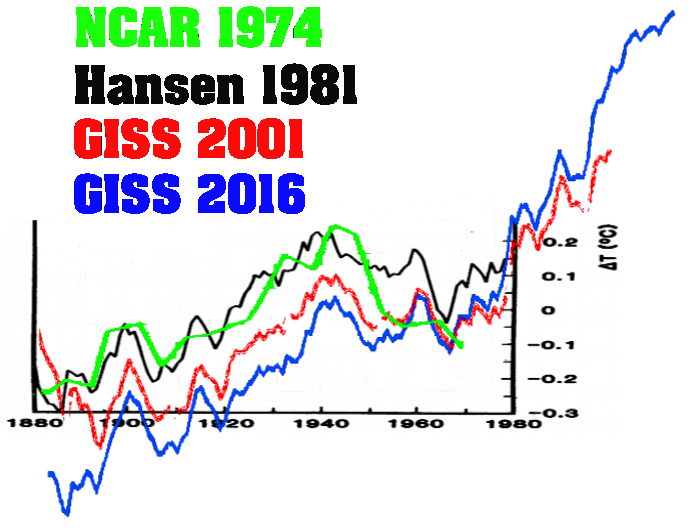
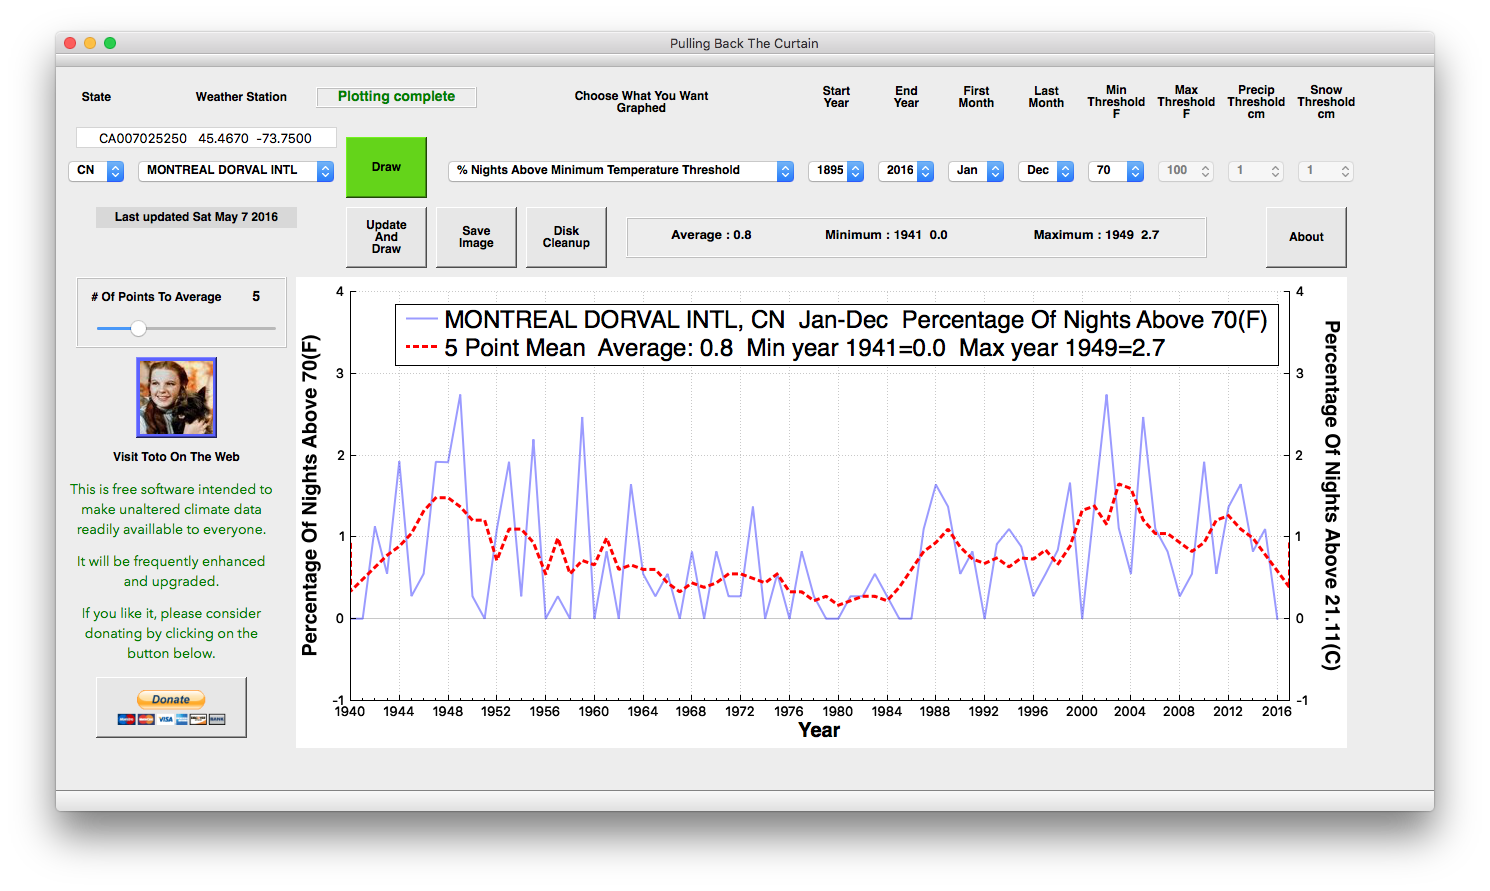
Note above how all of the NASA graphs show renewed warming starting around 1967, yet that warming does not appear in the NCAR graph. Similarly, in 1978 NOAA did not show any surface or troposphere warming through 1977.

2016-05-09063602

2016-05-09062919

Angell NOAA 1978

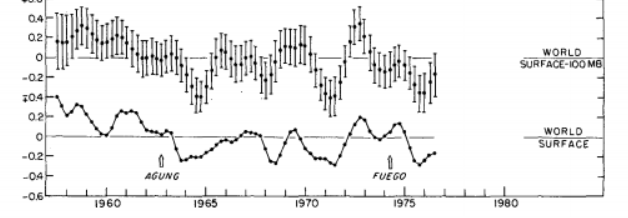
In 1978, it was reported by an international team of specialists that there is “no end in sight to the cooling trend of the last 30 years” They also reported southern hemisphere data was too meager to be reliable, and that the Arctic ice cap was growing. They blamed the expanded polar vortex on global cooling.

2016-05-09065312-down

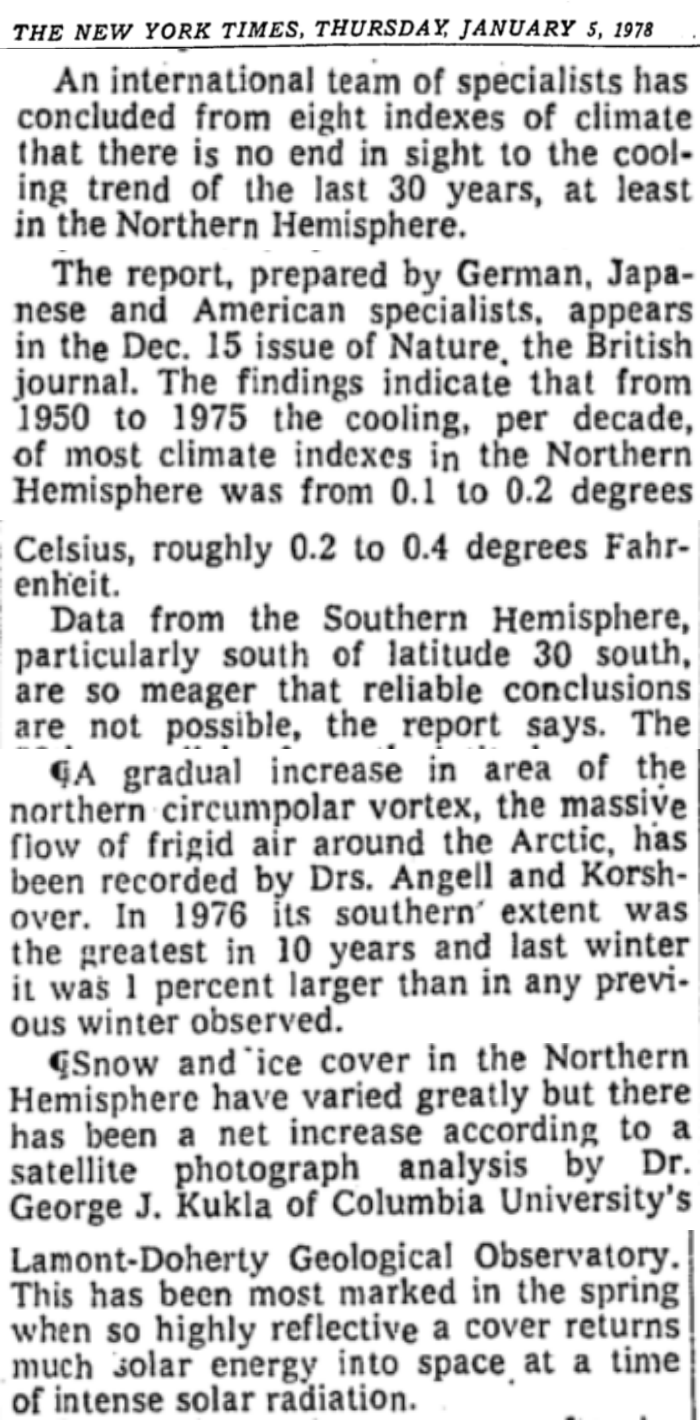
TimesMachine: January 5, 1978 – NYTimes.com

In Climategate E-mails, the team made clear their desire to manipulate the temperature record and remove the post-1940 cooling.

From: Tom Wigley <[email protected]>
To: Phil Jones <[email protected]>
Subject: 1940s
Date: Sun, 27 Sep 2009 23:25:38 -0600
Cc: Ben Santer <[email protected]>

So, if we could reduce the ocean blip by, say, 0.15 degC,
then this would be significant for the global mean — but
we’d still have to explain the land blip.

It would be good to remove at least part of the 1940s blip, but we are still left with “why the blip”.

di2.nu/foia/1254108338.txt

In another Climategate E-mail, Phil Jones said that much of the southern hemisphere data was “mostly made up.

date: Wed Apr 15 14:29:03 2009
from: Phil Jones <[email protected]> subject: Re: Fwd: Re: contribution to RealClimate.org
to: Thomas Crowley <[email protected]>

Tom,

The issue Ray alludes to is that in addition to the issue
of many more drifters providing measurements over the last
5-10 years, the measurements are coming in from places where
we didn’t have much ship data in the past. For much of the SH between 40 and 60S the normals are mostly made up as there is very little ship data there.

Cheers
Phil

di2.nu/foia/foia2011/mail/2729.txt

It is 100% clear that the NASA temperature record is complete garbage, and that they are simply shaping curves to match the global warming agenda.

Posted in Uncategorized | Leave a comment

Real Climate Science

Troposphere temperatures are very closely tied to Atlantic Multidecadal Oscillation (AMO) ocean circulation. The correlation is almost perfect.

2016-05-08065630

Wood for Trees: Interactive Graphs

The name of this web site is realclimatescience.com, though most of the time I am discussing the mind-blowing CO2 junk science which currently pervades academia and government.

However, there are a few real scientists working on climate, and I was fortunate to have spent time with one who actually did understand how the climate worked. Dr. Bill Gray from CSU spent many hours explaining to me how ocean cycles drive the climate, and how they are driven in turn by cyclical changes in ocean salinty. Bill’s theory in a nutshell was that evaporation in the warm, sunny mid-Atlantic increases the salinity of the water there. As the salinity increases, the water becomes increasingly dense and eventually starts to dive down towards the colder sea floor – forcing colder, less saline water to the surface. This process repeats continuously, driving the AMO and other ocean currents. Bill’s success as a tropical meteorologist and hurricane forecaster was largely due to his understanding of the AMO.

The understanding that ocean circulation drives the climate goes back to 1894, when an ocean traveler wrote a book and published in Scientific American an explanation of the connections. The author did not understand the mechanisms driving the changes in circulation, but he did keenly understand that climate change was driven by changes in ocean circulation.

Screenshot 2016-05-08 at 05.57.16 AM-down

11 May 1895 – SCIENCE. – Trove

Screenshot 2016-05-08 at 06.02.51 AM

Screenshot 2016-05-08 at 06.13.47 AM
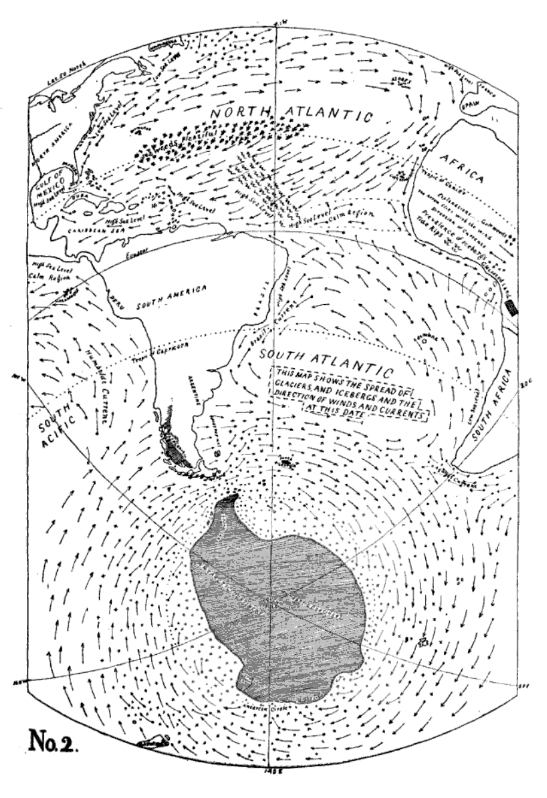
The Cause of Warm and Frigid Periods – Charles Austin Mendell Taber
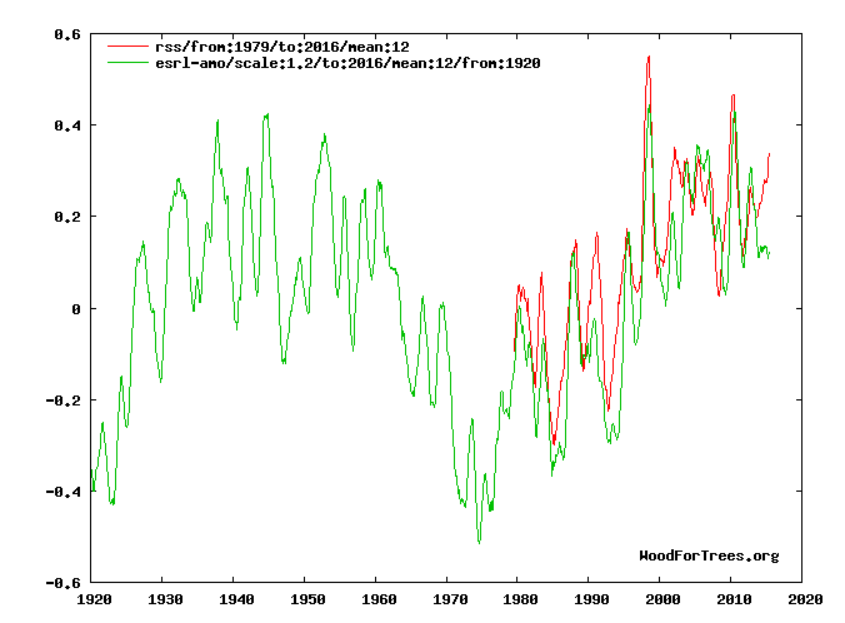
The author believed that changes in ocean circulation were the cause of ice ages, and NOAA still sees the connection.

Models of the ocean and atmosphere that interact with each other indicate that the AMO cycle involves changes in the south-to-north circulation and overturning of water and heat in the Atlantic Ocean. This is the same circulation that we think weakens during ice ages, but in the case of the AMO the changes in circulation are much more subtle than those of the ice ages. The warm Gulf Stream current off the east coast of the United States is part of the Atlantic overturning circulation. When the overturning circulation decreases, the North Atlantic temperatures become cooler.

Physical Oceanography Division –

After President Trump takes over in January, I hope we will see a restoration of science – and an end to the James Hansen/Al Gore driven junk science which has wrecked a generation.

Posted in Uncategorized | Leave a comment

Creating A Legitimate Global Temperature Record

In my previous post, I showed how the AMO (Atlantic Multidecadal Oscillation) correlates with global temperatures.

2016-05-08110456

Wood for Trees: Interactive Graphs

Satellite temperatures only go back to 1979.  It would be nice to make correlations going back further, but the fraudsters at NASA are constantly tampering with the surface temperature record and have turned it into an meaningless political document.

NASA_Fig._A_2001vs2016

2001 version : Fig.A.ps   current version: Fig.A.gif 

NASA has completely erased the 1940-1970 global cooling, which was reported by NCAR and the National Academy of Sciences at the time, and was very well documented.

2016-04-16031015

Hiding The Decline Smoking Gun | Real Science

Briffa’s trees also showed the 1940-1970’s cooling, before the climategate team hid the decline.

briffa_recon

briffa_recon.gif (420×320)

NASA temperatures are garbage, but what we can do is use the 1974 NCAR graph for the period prior to 1970. Then it becomes clear that the 1940’s were just as warm as the recent peak around ten years ago, and that there has been no warming for the past 85 years.

2016-05-08112601

The AMO is current dropping, and it seems likely that we are headed into another long cooling period.

Posted in Uncategorized | Leave a comment

Backing Away From The Sea Level Scam

In 1994, the Prime Minister of Tuvalu wanted to evacuate the island to save themselves from rising seas.

2016-05-08161048-down

07 Dec 1994 – Rising sea level: islanders fear it could mean Tuvalu – Trove

Since then, sea level has hardly changed at Tuvalu.

2016-05-08161223

Data and Station Information for FUNAFUTI B

And after decades of hysteria, even National Geographic is starting to back away from the sea level scam.

2016-05-08161822

2016-05-08161831

2016-05-08162024

Will Pacific Island Nations Disappear as Seas Rise? Maybe Not

Like everything else about the climate scam, sea level rise is just one more thing for scientists to lie about in exchange for grant dollars.

Posted in Uncategorized | Leave a comment

Off To Land Of Bernie

I’m going to be working this summer in Burlington, Vermont – where Bernie launched his war on prosperity 35 years ago.

2016-05-08072958-down

7 Apr 1981, Page 10A – Florida Today at Newspapers.com

It only took the self-proclaimed radical five months in office to get the city to turn against him. Being mayor was his “first real job in years” and he was used to living unemployed without plumbing or electricity, and not being able to pay the rent.

2016-05-08073421-down

, Page 65 – Herald and Review at Newspapers.com

Now this genius wants to take away your plumbing and electricity too, to solve an imaginary climate crisis.

Cf80Y6tVIAAeleI Cgg9j_WUIAI48Au

Bernie wants to return the climate to the low CO2 days of 80 years ago.

2016-05-08081051-down

, Page 1 – Carroll Daily Herald at Newspapers.com

Posted in Uncategorized | Leave a comment

Bernie – The Totalitarian

Bernie Sanders says he doesn’t want to “allow” people to succeed.

2016-05-07082301

If you want the government to tell you what you can do and how much money you can earn, vote for this Bolshevik terrorist. People like Bernie killed 110 million civilians over the past century, in pursuit of equality and social justice.

3546756878

Posted in Uncategorized | Leave a comment

Pulling Back The Curtain Version 1.7

An exciting new release for Windows and Mac.

Version 1.7 adds all Canadian (CN) stations, and some UK and Icelandic (IC) stations. It also has a lot of new statistics like the one below.

Screenshot 2016-05-07 at 07.55.01 AM

Mac download :

downloadMac

Windows: download the zip file by clicking here.

2016-02-16-04-38-44

Or alternatively replace these two files in your current Windows directory:

PullingBackTheCurtain.exe          us_stations.txt

As always, the software is completely free and contains nothing nefarious. Some people get warnings from their virus protection extortion software.

Posted in Uncategorized | Leave a comment

The West Antarctic Collapse Scam

Very few people are upset about the imaginary 0.7C increase in temperature over the past century. It is such a non-issue that scientists have had to resort to blaming cold and snow on global warming.

But what does scare people is the Al “Noah” Gore flood scenario – where lower and middle class carbon sins cause a sudden flood that wipes out coastal cities. (Important to note that the carbon sins of rich progressives like Gore, Obama, Soros and DiCaprio have no impact on this process.) The scamsters have settled on collapse of the West Antarctic Ice Sheet (WAIS) as the key to getting us ignorant little people to fork over their money and freedom.

Screenshot 2016-04-03 at 12.51.37 AM

Another warning on global warming: West Antarctic ice sheet could collapse, causing massive sea level rise | Christian News on Christian Today

National Geographic says that “scientists are watching in horror” as Florida sea levels rise six feet over the next 84 years..

2016-05-06040026

2016-05-060400382016-05-06040211

Scientists Are Watching in Horror as Ice Collapses

Forty years ago during the global cooling scare, scientists were studying this collapse which had been going on for 6,000 years, and saying: It has nothing to do with a warmer climate, just the dynamics of unstable ice.” It was the lead story in the Chicago Tribune on January 9, 1977. – which was one of the coldest and snowiest winters on record in the Eastern US.

2016-05-06034302

“We’re doing about the most we can do right now to study the possible collapse of the west ice sheet,” said Dr. Richard Cameron, NSF program manager for glaciology. “It has become an  area of concern because we could be on the brink of a rise in sea levels.”

“We believe that the west ice sheet is unstable, that it has been rapidly disintegrating in geological terms for the last  6000 years, and that is is possible that in 300 years the west sheet could collapse,” said Hughes.

THE STAGGERING aspect of the re- search is the discovery of a potentially catastrophic phenomenon that had been totally unexpected.

We’re seeing the West ice sheet on its way out,” said Cameron. “It seems to be doing something completely different than the east ice sheet. It has nothing to do with a warmer climate, just the dynamics of unstable ice.”

2016-05-06032359-down-down

January 9, 1977 – Flood threat from polar ice | Chicago Tribune Archive

Two years later, scientists said that this cycle had occurred 17 times, and that the WAIS had collapsed only once.

CfasFvtWAAAFkho (1)

, Page 111 – Democrat and Chronicle at Newspapers.com

But only two years after that, climate scamsters had already started blaming this on global warming. Research money had shifted from global cooling to global warming since 1977.

Screenshot 2016-04-03 at 12.58.05 AM-down

7 Jan 1981, Page 19 – at Newspapers.com

Scientists actually knew about this long before 1977. By 1932, the WAIS Ross Ice Shelf had retreated 30 miles – a process which may have been going on for centuries.

2016-05-06042120-down

21 Jul 1932 – A Warmer World. – Trove

The National Geographic claim that Florida sea level is going to rise two meters by 2100 is patently false. Sea level there has been rising steadily at 2.3 mm/year over the past century. It will take more than 800 years for sea level to rise six feet. There is no correlation indicated between sea level rise rates and CO2. Sea level was rising 2.3 mm/year when CO2 was 300 PPM, and it is still rising at the same rate.

8724580

Sea Level Trends – State Selection

There is not one shred of evidence that anything humans are doing is affecting Antarctic ice or sea level. This is the biggest fraud in science history, and I certainly hope that President Trump holds the fraudsters accountable.

Posted in Uncategorized | Leave a comment

Massive NOAA Data Tampering In Texas

Four years ago, NOAA showed Texas winters cooling slightly from 1895 to 2011.

screenhunter_177-aug-25-13-42 (1)

Now they show Texas winters warming rapidly during that same time period.

2016-05-06075533

Climate at a Glance | National Centers for Environmental Information (NCEI)

This graph shows how NOAA has linearly cooled Texas’ past since they published the 2011 graph.

2016-05-06080718

This is standard operating procedure for agencies reporting to Barack Obama. They alter data to support his agenda. It has nothing to do with science.

Posted in Uncategorized | Leave a comment

Wettest Year On Record In Oklahoma

Five years ago, experts warned of permanent drought in Texas and Oklahoma, and ridiculed Governor Rick Perry for stating the obvious – that the rains would return.

2016-05-06061203 2016-05-06061144

Leading climate fraudster Katherine Hayhoe predicted a huge increase in the number of 100 degree days.

2016-05-06062012

With No End in Sight for Texas Drought, ABC News Explains: “Every Farmer in the World Will Be Affected by Climate Change” | ThinkProgress

The only person who knew what he was talking about was Rick Perry. Rainfall has been steadily increasing in Oklahoma since 1895, and the the past 12 months have been the wettest on record.

2016-05-06061327

Climate at a Glance | National Centers for Environmental Information (NCEI)

Similar story in Texas. Rains have been steadily increasing and the past 12 months have been the second wettest on record.

2016-05-06061426

Climate at a Glance | National Centers for Environmental Information (NCEI)

The frequency of 100 degree days in Texas peaked around a century ago, and dropped off sharply after the 1950’s.

2016-05-06062901

Climate experts know nothing about the past, present or future climate, and are simply paid political hacks pushing an agenda for the White House.

Posted in Uncategorized | Leave a comment