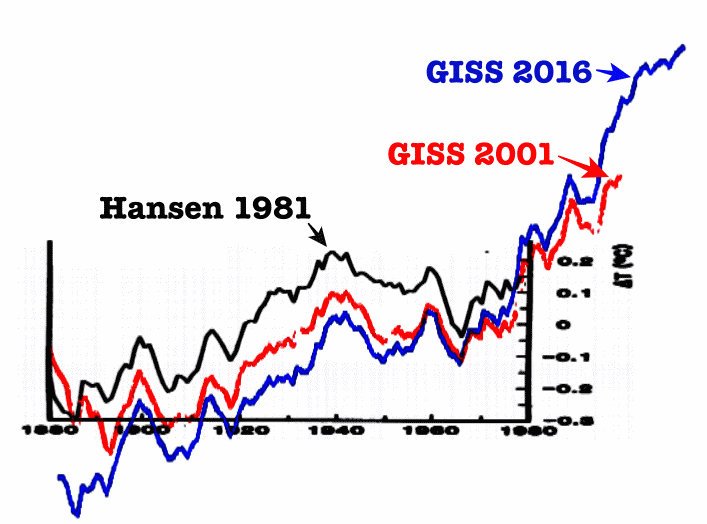
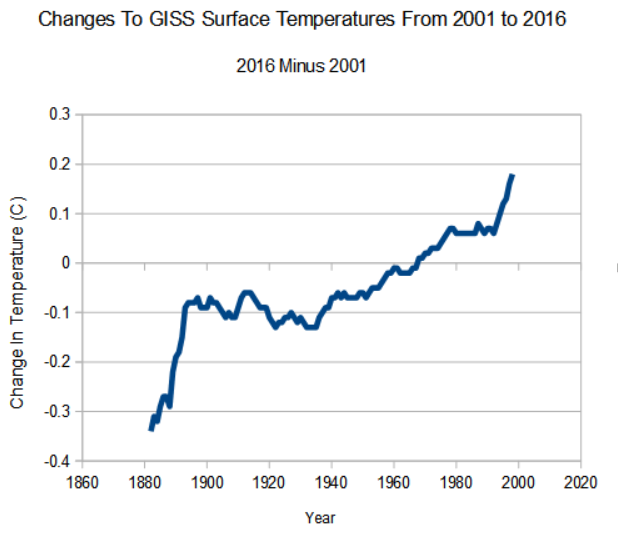
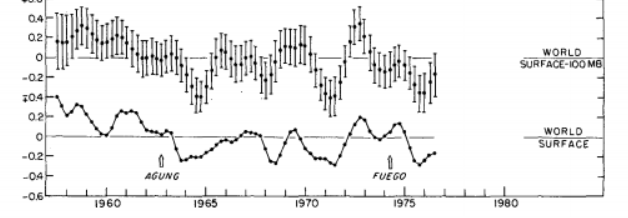
The graph below shows how NASA has been steadily erasing the 1940’s blip, and subsequent 1940 to 1970 global cooling.
1981: 1981_Hansen_etal_1.pdf 2001: Fig.A.ps Current: Fig.A.gif
Just since 2001, NASA has increased 1880 to 2000 warming by 0.5 degrees by altering the data.
2001: FigA.txt Current: Fig.A.txt
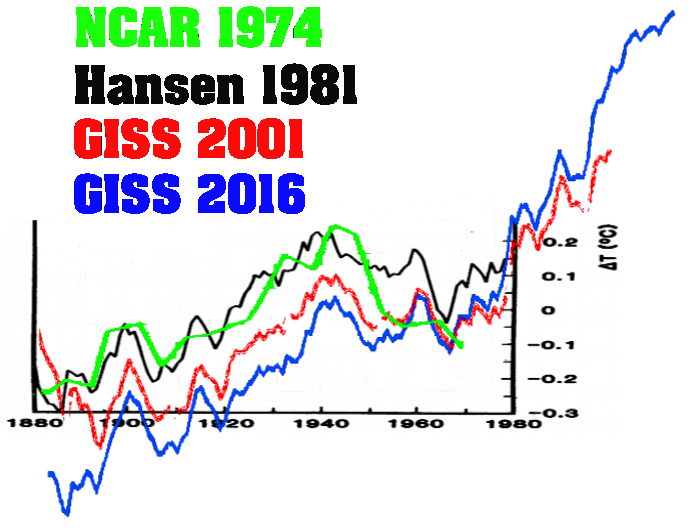
The next graph superimposes NCAR 1974 at the same scale, and shows how Hansen was already erasing the 19140-1970 cooling in his 1981 version.
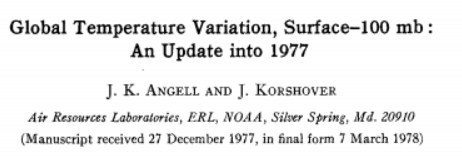
Note above how all of the NASA graphs show renewed warming starting around 1967, yet that warming does not appear in the NCAR graph. Similarly, in 1978 NOAA did not show any surface or troposphere warming through 1977.
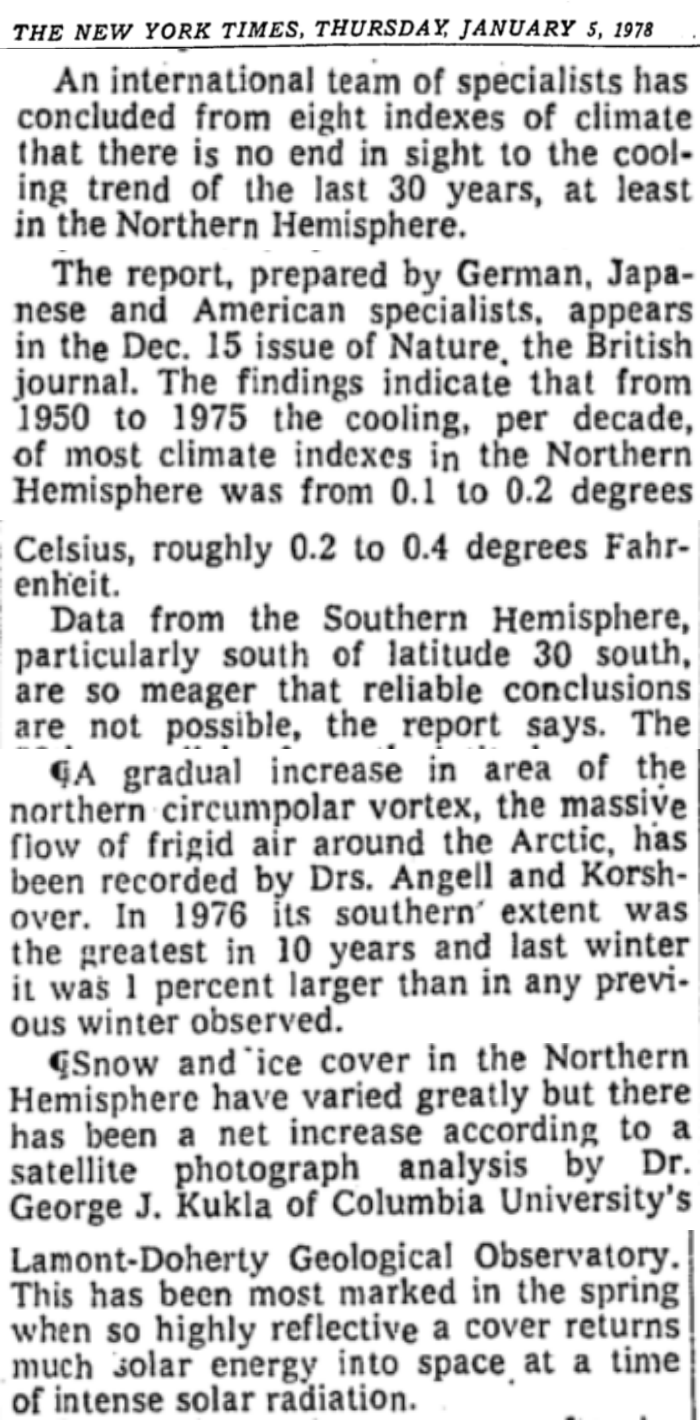
In 1978, it was reported by an international team of specialists that there is “no end in sight to the cooling trend of the last 30 years” They also reported southern hemisphere data was too meager to be reliable, and that the Arctic ice cap was growing. They blamed the expanded polar vortex on global cooling.
TimesMachine: January 5, 1978 – NYTimes.com
In Climategate E-mails, the team made clear their desire to manipulate the temperature record and remove the post-1940 cooling.
From: Tom Wigley <[email protected]>
To: Phil Jones <[email protected]>
Subject: 1940s
Date: Sun, 27 Sep 2009 23:25:38 -0600
Cc: Ben Santer <[email protected]>So, if we could reduce the ocean blip by, say, 0.15 degC,
then this would be significant for the global mean — but
we’d still have to explain the land blip.It would be good to remove at least part of the 1940s blip, but we are still left with “why the blip”.
In another Climategate E-mail, Phil Jones said that much of the southern hemisphere data was “mostly made up.”
date: Wed Apr 15 14:29:03 2009
from: Phil Jones <[email protected]> subject: Re: Fwd: Re: contribution to RealClimate.org
to: Thomas Crowley <[email protected]>Tom,
The issue Ray alludes to is that in addition to the issue
of many more drifters providing measurements over the last
5-10 years, the measurements are coming in from places where
we didn’t have much ship data in the past. For much of the SH between 40 and 60S the normals are mostly made up as there is very little ship data there.Cheers
Phil
It is 100% clear that the NASA temperature record is complete garbage, and that they are simply shaping curves to match the global warming agenda.

