NASA Goes Double Or Nothing On Their Data Tampering

Yesterday I showed how NASA has doubled their own reported global warming since 1999

ScreenHunter_10782 Oct. 11 08.56

1999 Figure 1: Global annual-mean surface air temperature change based on the meteorological station network.

2015 Versiontraditional analysis using only meteorological station data

That is pretty spectacular fraud, and they have done exactly the same thing with their sea level data since 1982. NASA currently shows 16 cm of sea level rise from 1880 to 1980, and no change in rates over time

ScreenHunter_3443 Oct. 12 11.34Climate Change: Vital Signs of the Planet: Sea Level

But in 1982, NASA only showed 8 cm of sea level rise from 1880 to 1980, and a sharp flattening to almost zero after 1950.

ScreenHunter_3441 Oct. 12 11.22

pubs.giss.nasa.gov/docs/1982/1982_Gornitz_etal_1.pdf

The next graph is an overlay of the two above, normalized to 1880.

ScreenHunter_3444 Oct. 12 11.56

NASA’s current graph looks nothing like their 1982 graph, doubling sea level rise. Exactly the same thing they have done with temperature rise.

Posted in Uncategorized | 18 Comments

Living The Green Dream In Boulder

We are having 70 MPH wind gusts and the electricity is out. Greens must be thrilled to be living like cavemen without the necessary survival skill set.

I had completely forgotten what the Milky Way looks like.

Posted in Uncategorized | 13 Comments

It Only Takes One Progressive To Destroy A Community

ScreenHunter_10787 Oct. 11 13.00

Shocking Before-And-After Photos: How Wind Parks Are Devastating Idyllic German Countryside!

Posted in Uncategorized | 16 Comments

Reader Quiz : Which Way Is My Train Moving?

Posted in Uncategorized | 19 Comments

50% Of Reported Global Warming Is Due To Post 1999 Data Tampering

In 1999, NASA reported 0.6C warming from 1882 to 1996. Now they report almost twice that much warming from 1882 to 1996. Note that the alterations have been far outside of the green error bars, indicating incompetence, fraud, or both.

ScreenHunter_10779 Oct. 11 08.37

1999 Figure 1: Global annual-mean surface air temperature change based on the meteorological station network.

2015 Versiontraditional analysis using only meteorological station data

The next graph shows the same thing, normalized to 1880’s temperatures.

ScreenHunter_10782 Oct. 11 08.56

This is the biggest fraud in science history, and needs to be investigated by Congress immediately.

Posted in Uncategorized | 6 Comments

Gavin Takes Climate Cynicism To An Entirely New Level

Gavin just bumped recent global temperatures up so much that he had to add a new Y-axis grid line at 0.8°C.

GISSFigA2Changes-March-Sept2015

Shortly after doing this, he announced that the odds of a record warm year had increased.

ScreenHunter_10775 Oct. 11 05.40

No mention from Gavin of course that satellite data shows a 0% probability of 2015 being a record warm year.

ScreenHunter_10776 Oct. 11 05.56

Wood for Trees: Interactive Graphs

If Gavin was an actual scientist, he would mention that his data is diverging from satellite data at a rate of 1.27°C per century since the beginning of this century.

ScreenHunter_10777 Oct. 11 07.06

Wood for Trees: Interactive Graphs

If Gavin was an actual scientist, he might also mention that warming has been much slower than forecast by climate models.

PaintImage467

Climate Analysis | Remote Sensing Systems

Posted in Uncategorized | 8 Comments

Saving Manhattan!

ScreenHunter_10774 Oct. 11 05.18

Sea level at Manhattan has been steadily rising about 2.84 mm/year since Abraham Lincoln was president, mainly due to land subsidence. President Obama believes that he can slow the rate of sea level rise at Manhattan, by making electricity prices skyrocket.

https://www.youtube.com/watch?v=HlTxGHn4sH4

Posted in Uncategorized | 15 Comments

Count Me In With The 97% Consensus

PaintImage19

I’m 100% in agreement with the 97% consensus. The human activities of data tampering, fraud and collusion have caused most of the warming over the past century.

GISS1982_2002_2014_2015

Posted in Uncategorized | 6 Comments

Eminent Scientists Warn Earth Is Drying Up – Martian Style Irrigation Systems Needed

In 1923, many eminent scientists warned that the earth is drying up, and that we would have to build an ingenious global irrigation system, like our neighbors on Mars did centuries ago.

PaintImage14

10 Jul 1923 – IS THE EARTH DRYING UP ? PESSIMISTIC PREDICTIONS…

Posted in Uncategorized | 7 Comments

NSIDC Demonstrates How To Construct An Arctic Ice Scam

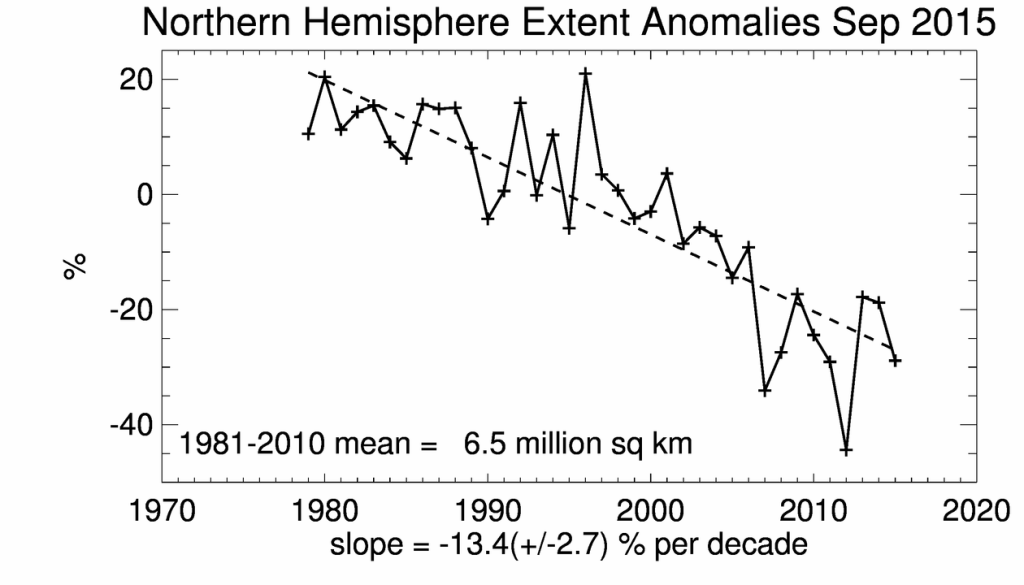
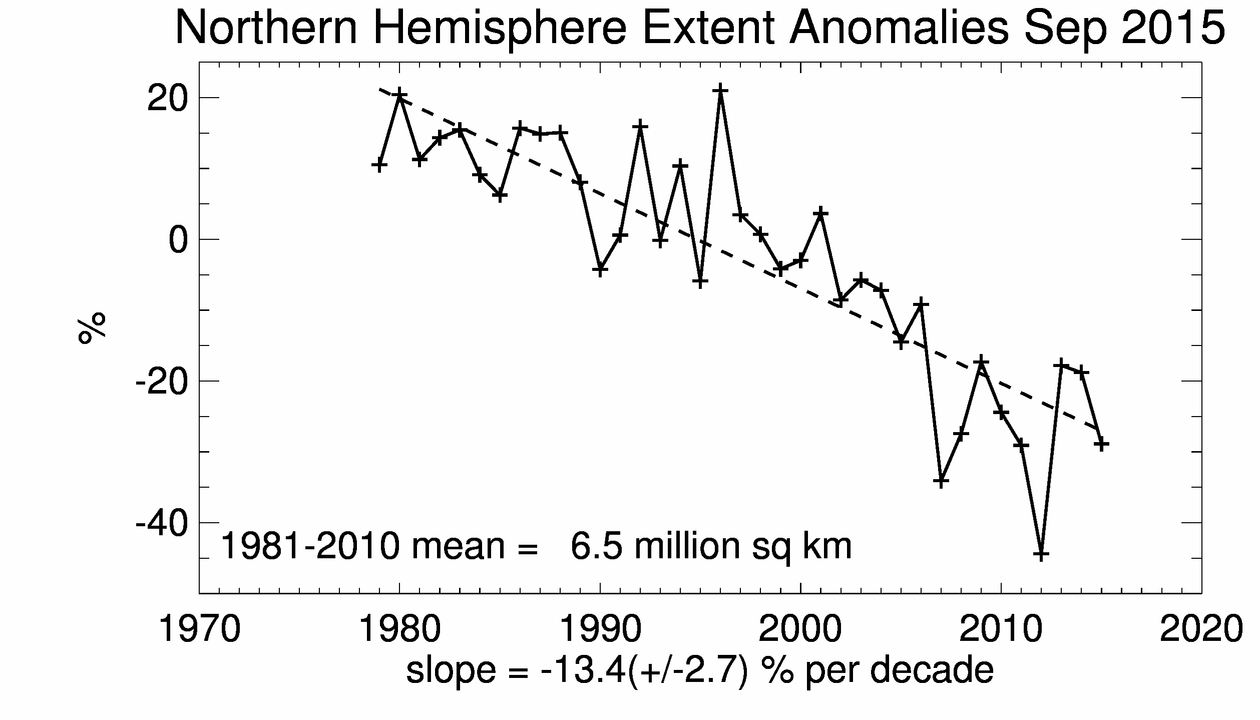
The National Snow and Ice Data Center in Boulder, Colorado has demonstrated how to construct an Arctic ice scam. The key feature of the scam is a graph like the one below, which necessarily starts in the Arctic record cold year of 1979, and appears to show a linear loss of sea ice headed towards zero.

n_plot_hires

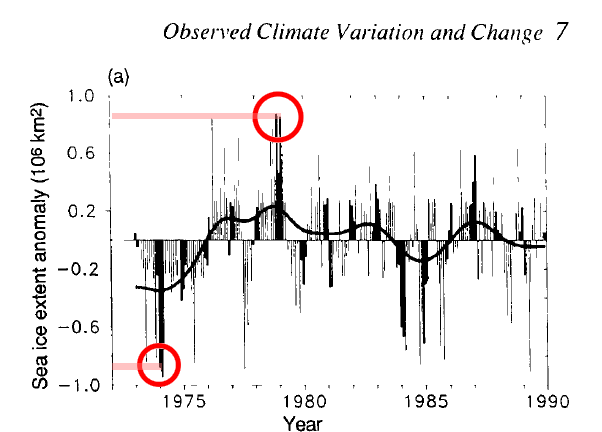
What you would not want to do is include the 1990 IPCC/NOAA Arctic sea ice data which shows that 1979 was a peak, and that 1974 had about 1.8 million km² less ice than 1979. that would wreck your linear trend scam.

PaintImage142

ScreenHunter_10756 Oct. 10 12.21

You would also not want to include this 1971 National Geographic map showing ice extent not terribly different from 2015.

ScreenHunter_10759 Oct. 10 12.35

The composite map below shows that ice extent in 1971 (brown) was much less than September, 1979 ice extent. It also shows that 1971 ice was much less than the NSIDC median (pink line.) Providing that information would completely destroy your linear trend scam and imaginary relationship with atmospheric CO2.

AnimationImage143

Another thing you most certainly not want to mention is that the low ice extent of 1971 was 1.5 million km² higher than earlier years. That would further wreck your scam.

ScreenHunter_10760 Oct. 10 12.49

TimesMachine: May 21, 1975 – NYTimes.com

If you were serious about destroying your multi-million dollar funding scam, you would mention that sea ice was no thicker in 1940 than it is now.

PaintImage10

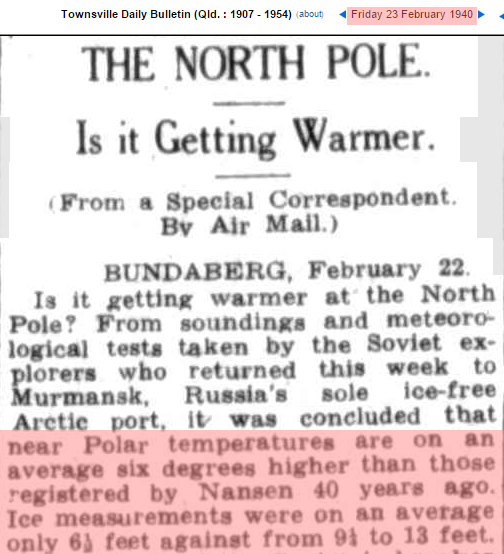
23 Feb 1940 – THE NORTH POLE. Is it Getting Warmer. | BUNDABER…

And you could bury your scam by showing that behavior of Arctic sea ice is cyclical rather than linear.

ScreenHunter_107 Feb. 17 07.17

Papers Past — Auckland Star — 14 December 1940 — WARMER ARCTIC

Keeping millions of dollars of climate scam money coming in requires lots of hard work cherry picking and ignoring reality.

Posted in Uncategorized | 15 Comments