
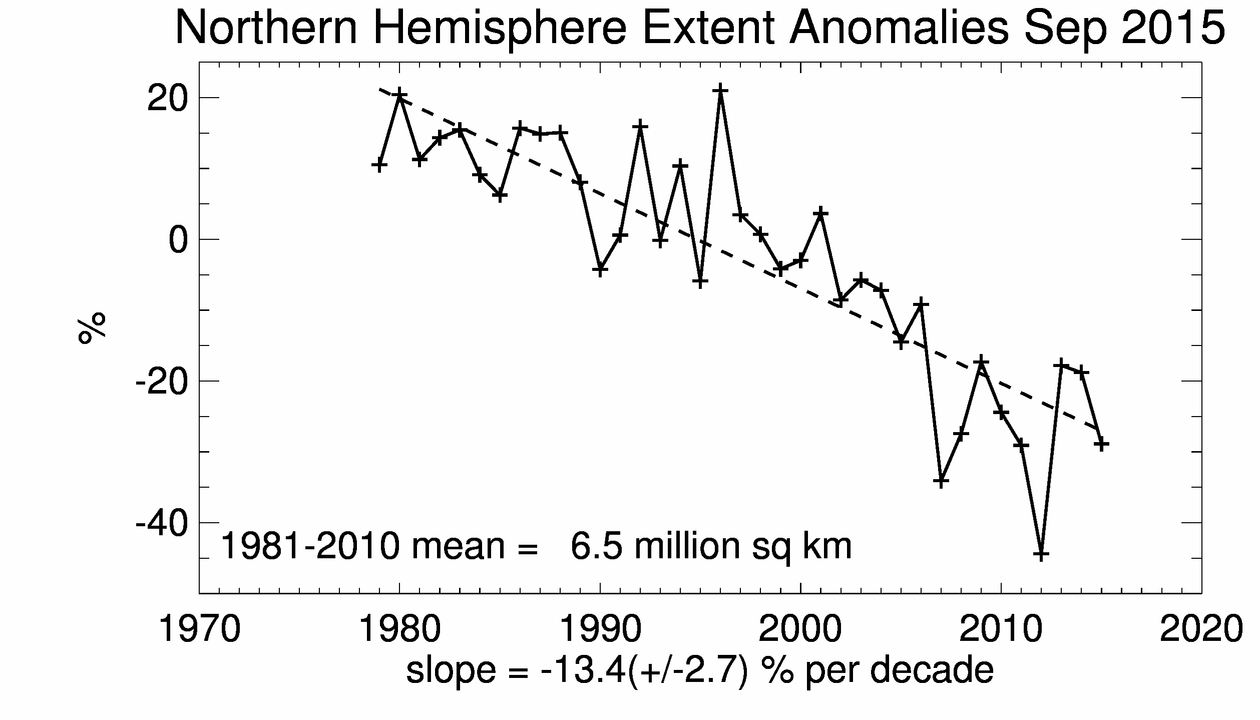
The National Snow and Ice Data Center in Boulder, Colorado has demonstrated how to construct an Arctic ice scam. The key feature of the scam is a graph like the one below, which necessarily starts in the Arctic record cold year of 1979, and appears to show a linear loss of sea ice headed towards zero.
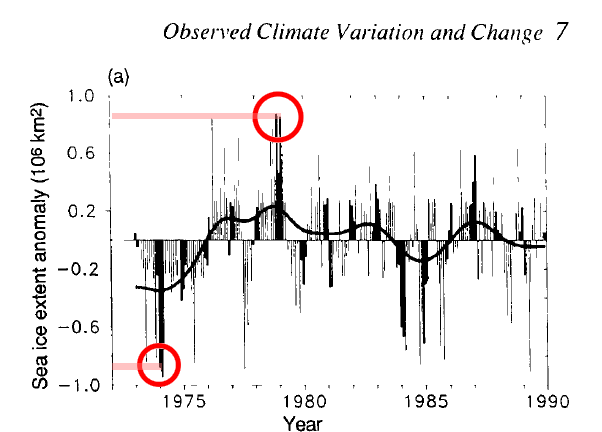
What you would not want to do is include the 1990 IPCC/NOAA Arctic sea ice data which shows that 1979 was a peak, and that 1974 had about 1.8 million km² less ice than 1979. that would wreck your linear trend scam.
You would also not want to include this 1971 National Geographic map showing ice extent not terribly different from 2015.
The composite map below shows that ice extent in 1971 (brown) was much less than September, 1979 ice extent. It also shows that 1971 ice was much less than the NSIDC median (pink line.) Providing that information would completely destroy your linear trend scam and imaginary relationship with atmospheric CO2.

Another thing you most certainly not want to mention is that the low ice extent of 1971 was 1.5 million km² higher than earlier years. That would further wreck your scam.

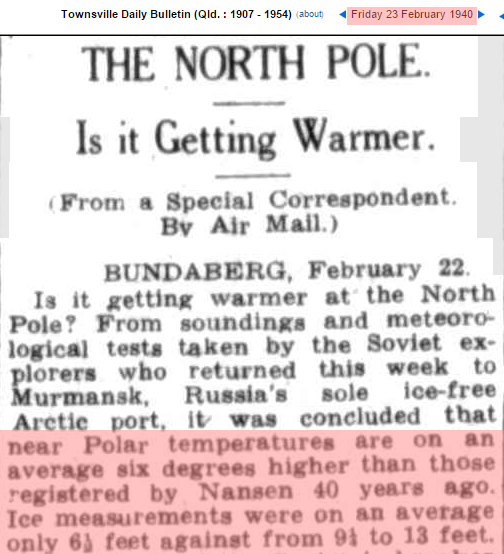
If you were serious about destroying your multi-million dollar funding scam, you would mention that sea ice was no thicker in 1940 than it is now.
23 Feb 1940 – THE NORTH POLE. Is it Getting Warmer. | BUNDABER…
And you could bury your scam by showing that behavior of Arctic sea ice is cyclical rather than linear.
Papers Past — Auckland Star — 14 December 1940 — WARMER ARCTIC
Keeping millions of dollars of climate scam money coming in requires lots of hard work cherry picking and ignoring reality.

This year’s Arctic sea ice extent is climbing rapidly.
https://sunshinehours.files.wordpress.com/2015/10/arctic_sea_ice_extent_zoomed_2015_day_282_1981-2010.png
Its 1.5 million sq km higher than for the same day in 2012
And the AMO has topped out and is on its way back down.
http://www.woodfortrees.org/graph/esrl-amo/normalise
It isn’t like we were naked savages in 1975, or 1940 for that matter. It should not be that difficult to reconstruct Arctic ice charts going much father back into the past, to give a much more comprehensive picture.
It is a fabulous cherry pick for alarmists to start any climate data chart in 1979 (coldest year on record) thus purging those dirty 1930’s and filthy 1940’s from the record books. That, by their own admission. is their excuse for “adjusting” (scrubbing) those warm decades out of existence.
They have made fake charts that go back much further in time, no doubt based on other cherry picked proxies.
Reblogged this on Climatism.
“Another thing you most certainly not want to mention is that the low ice extent of 1971 was 1.5 million km² higher than earlier years.”
Your NYT clipping says 1.5 million square MILES.
1.5 million square miles = 3.8 million square km
That’s a massive increase in 4 years.
Probably about what will get in the next few years as we climb back up out of the recent minimum of the cycle.
Wow. Imagine if just one single major news outlet reported on something like this.
Wouldn’t it be nice if scientists were held to the same standards of disclosure as advertisers and banks.
In many fields, science and researchers ARE held to standards, It’s actually insane how climate science appears at present.
Yes, some scientists are held to standards, but not all like advertisers and banks. If cereal ads and checking accounts are dangerous to John Q Public, what about wild eyed climate scientologists messing with entire economies and ecosystems?
I guess some animals are more equal than others.
“I have no data yet. It is a capital mistake to theorize before one has data. Insensibly one begins to twist facts to suit theories, instead of theories to suit facts.”
The bipolar Professor Rockström of planetary boundaries’ fame says that the Arctic and Antarctic are deteriorating rapidly and could tip over. He feels a little better after being depressed for 20 years but there is a danger of relapse. It seems the whole world could tip over:
The most pessimistic climate change scientist has had a sudden change of heart
Reblogged this on Canadian Climate Guy and commented:
Ice ice baby!