
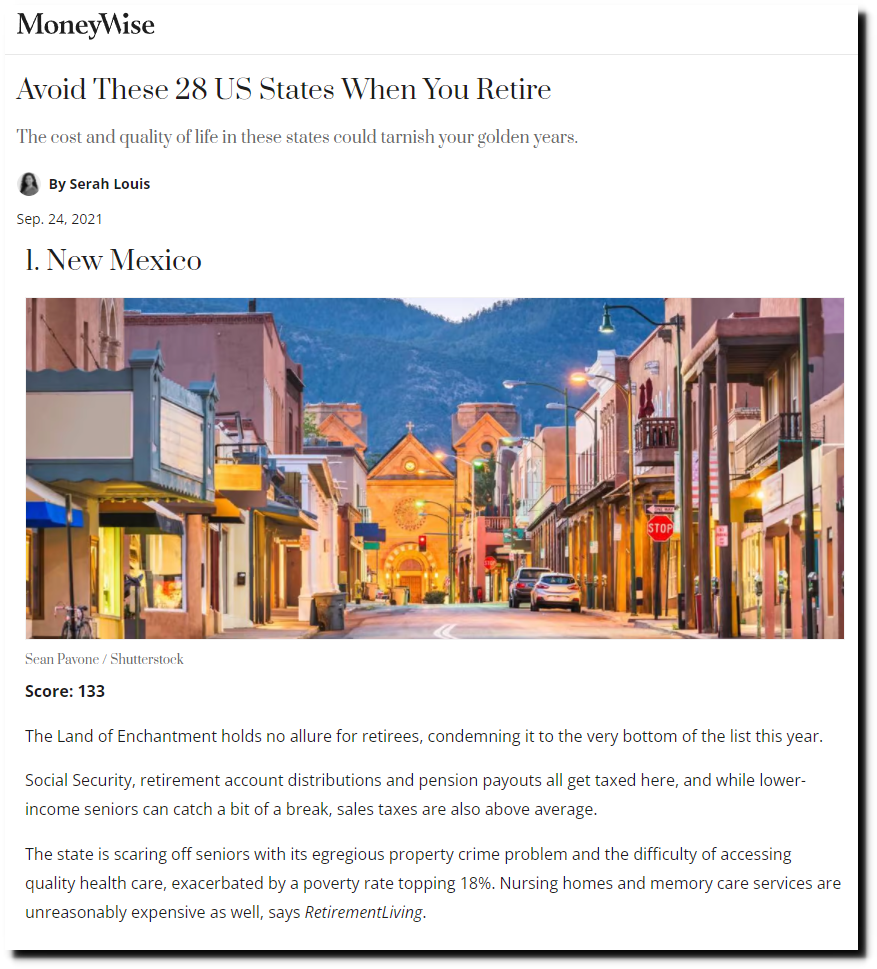
My home state of New Mexico has become an insufferable mess under Democratic Party leadership, and is now ranked the worst state to retire to.
My home state of New Mexico has become an insufferable mess under Democratic Party leadership, and is now ranked the worst state to retire to.
“A New Zealand man has been labeled “unbelievably selfish” after he received up to 10 COVID-19 vaccines in one day.”
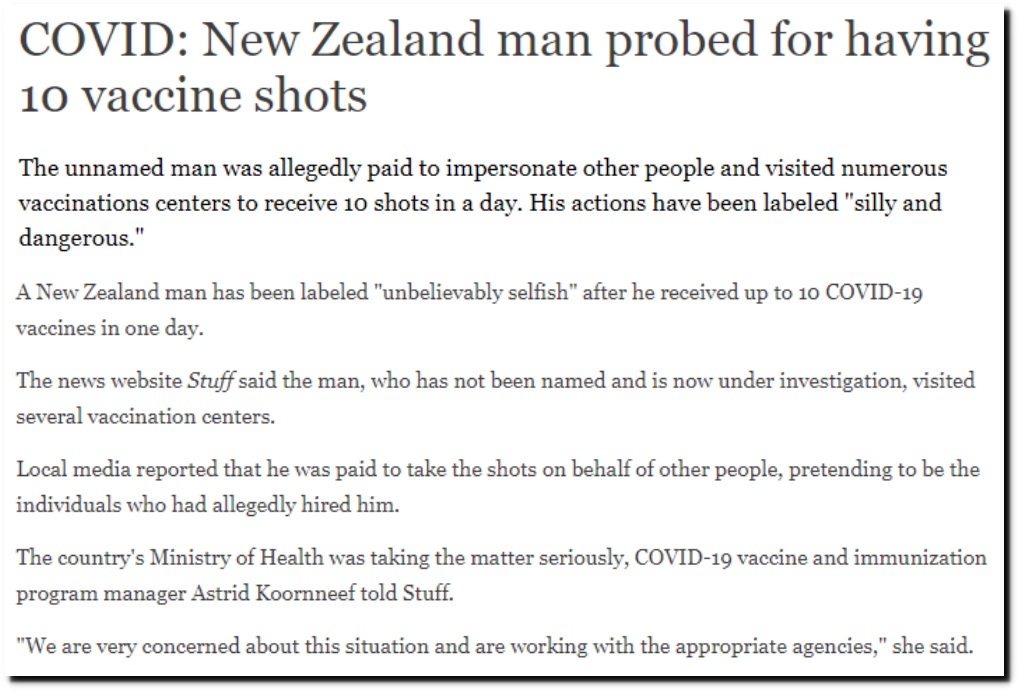
COVID: New Zealand man probed for having 10 vaccine shots | News | DW | 11.12.2021
After being locked out of my Twitter and YouTube accounts for a week, and then permanently banned from by, YouTube contaminates my family hike video with UN propaganda.
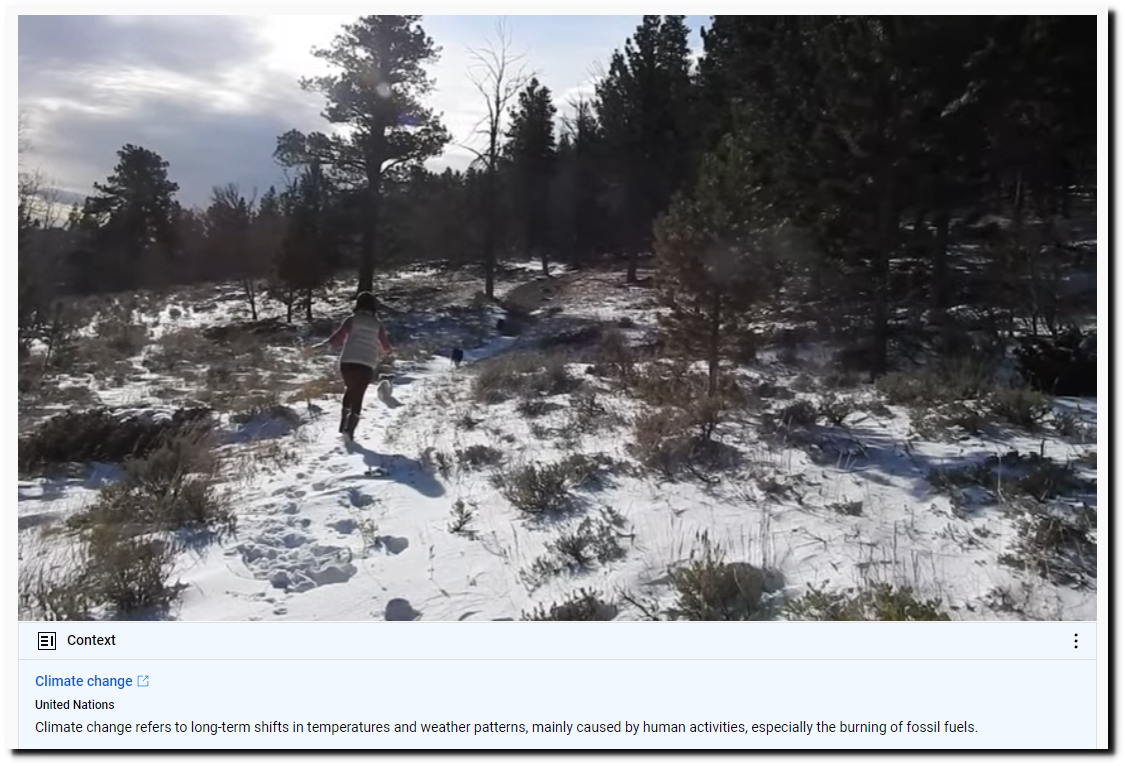
The video is banned completely in New Zealand.
“The Arklatex into mid-South NWS offices are often the busiest when it comes to tornado formation in December. You can almost envision low pressures passing near the Gulf coast and sending warm fronts through these areas looking at the map.”
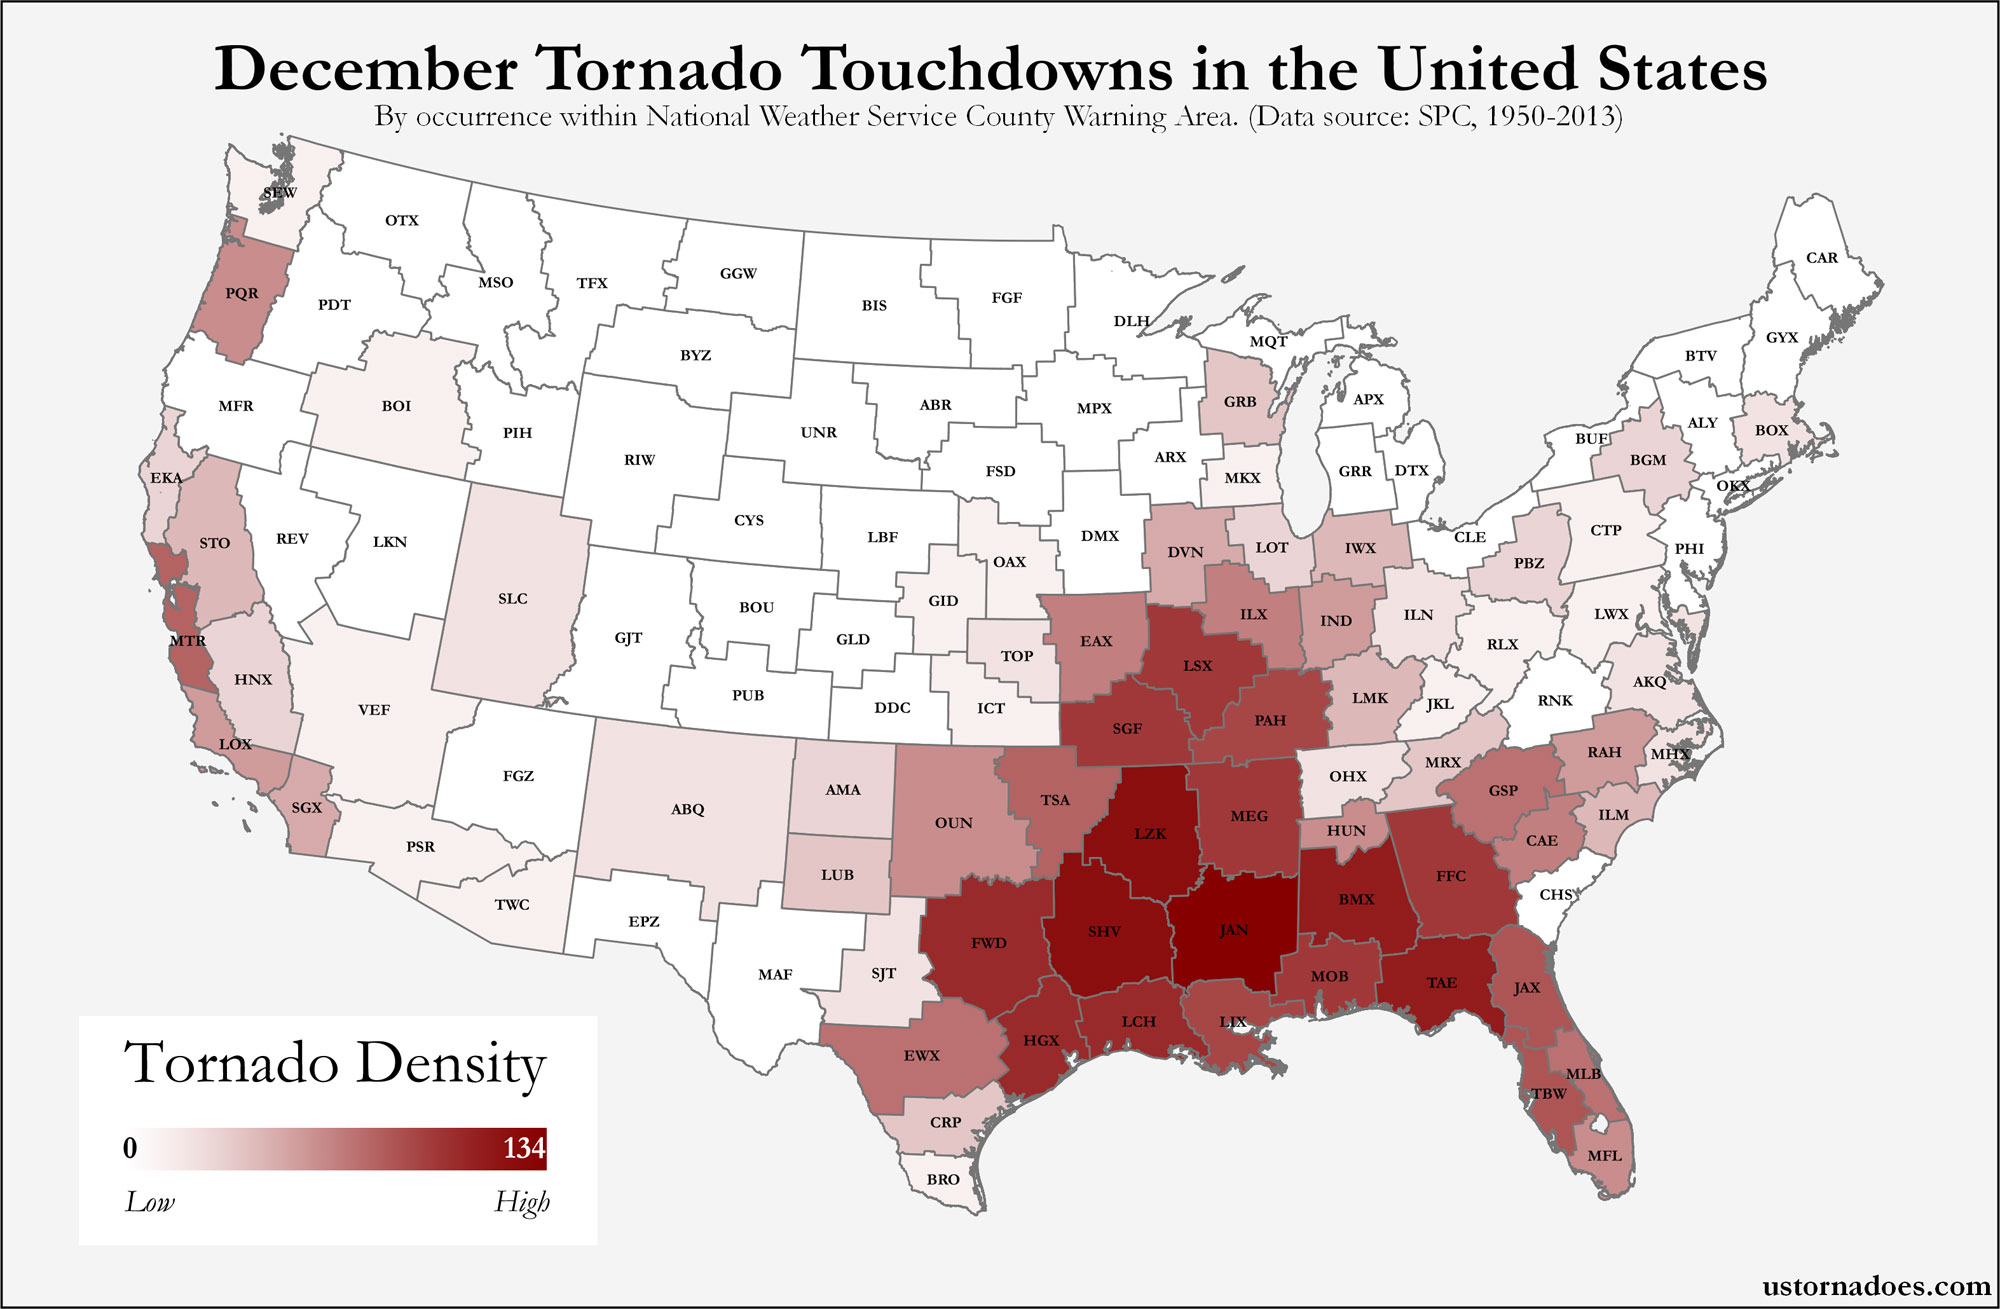
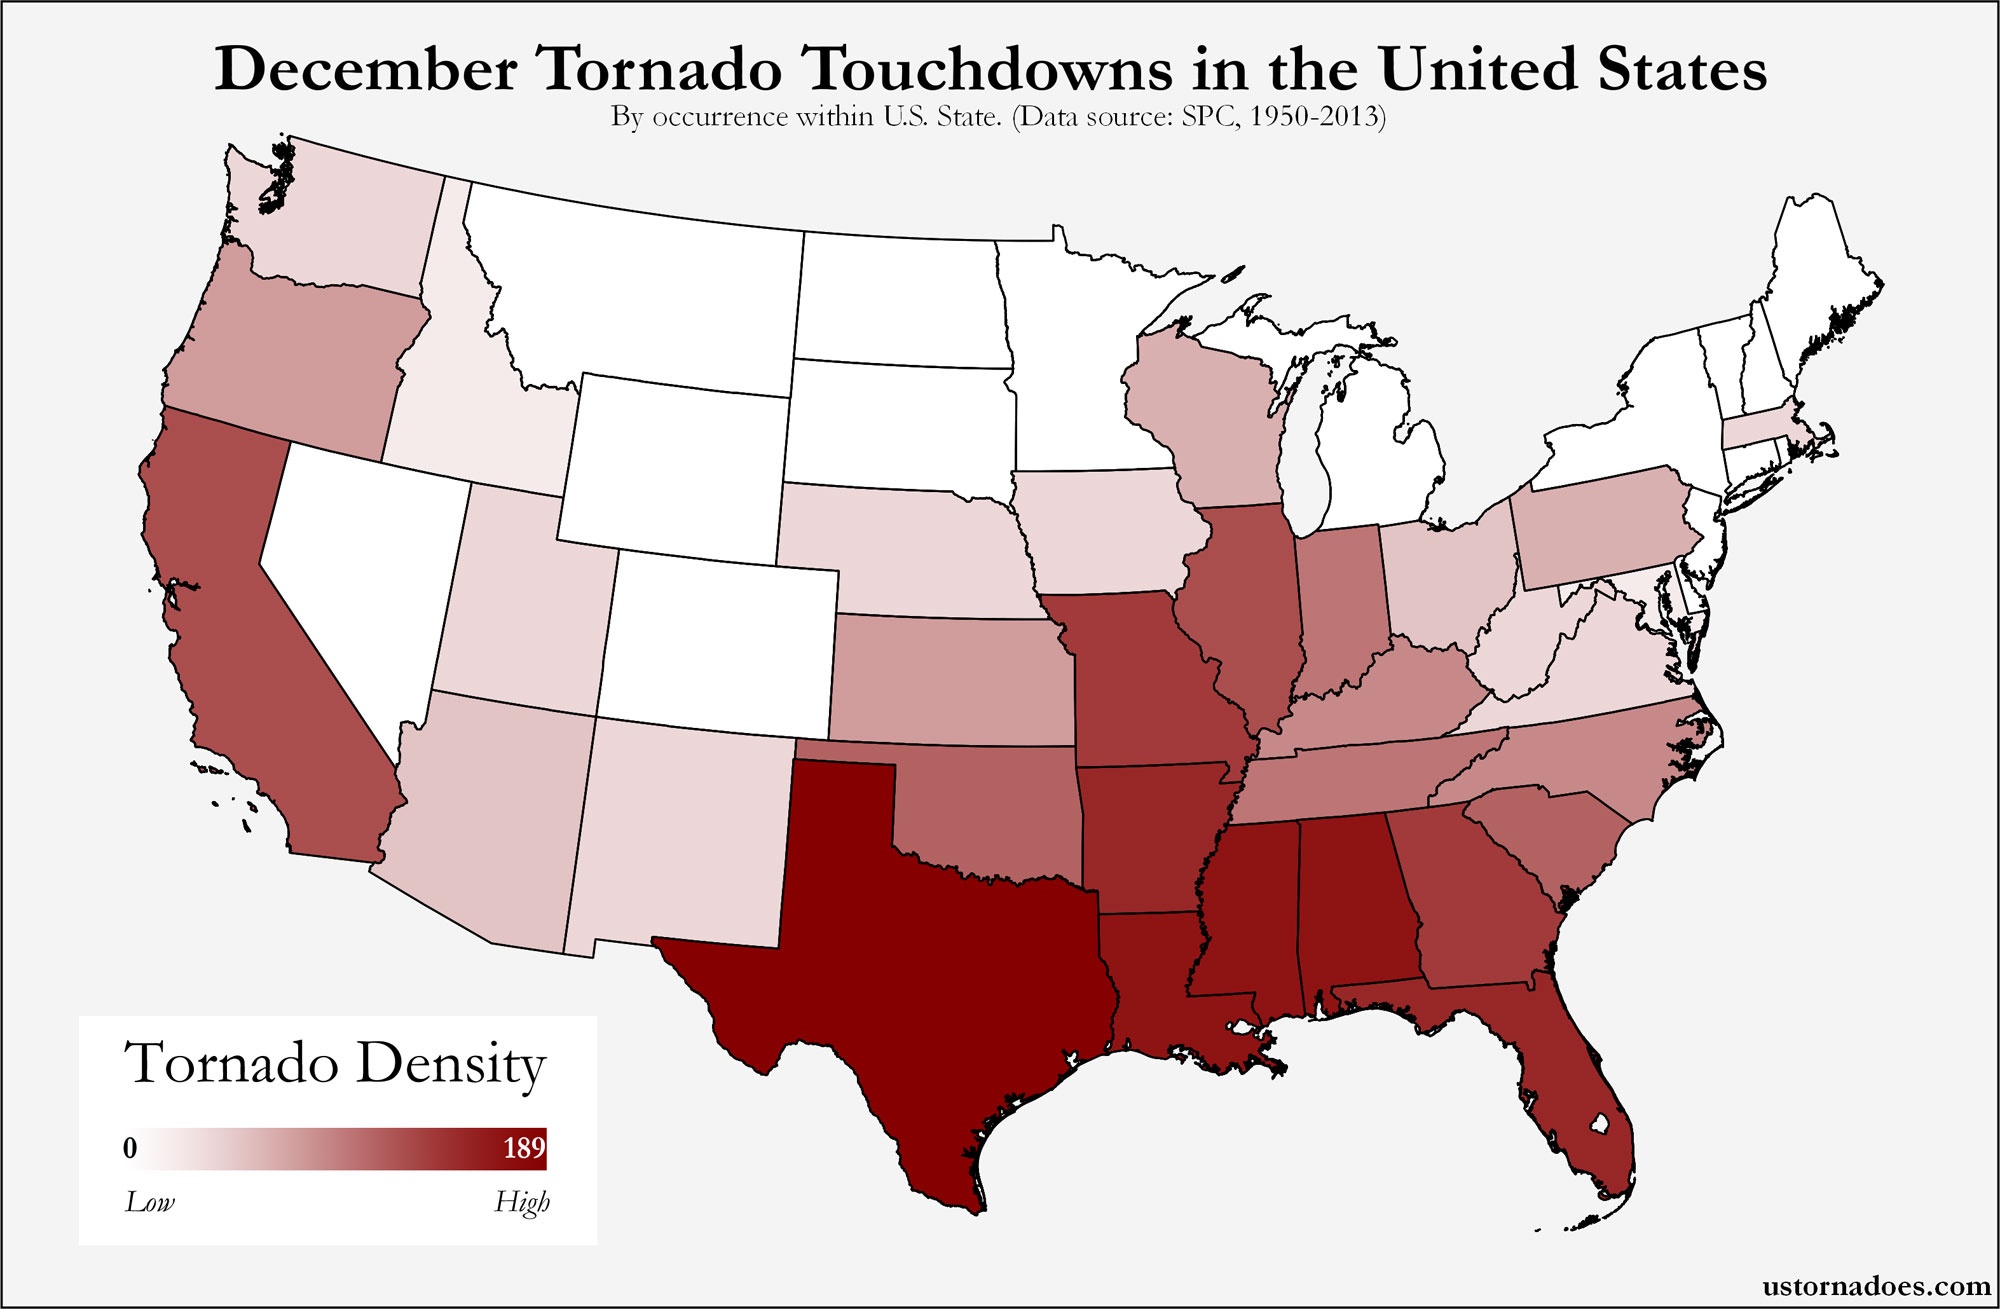
Here’s where tornadoes typically form in December across the United States – ustornadoes.com
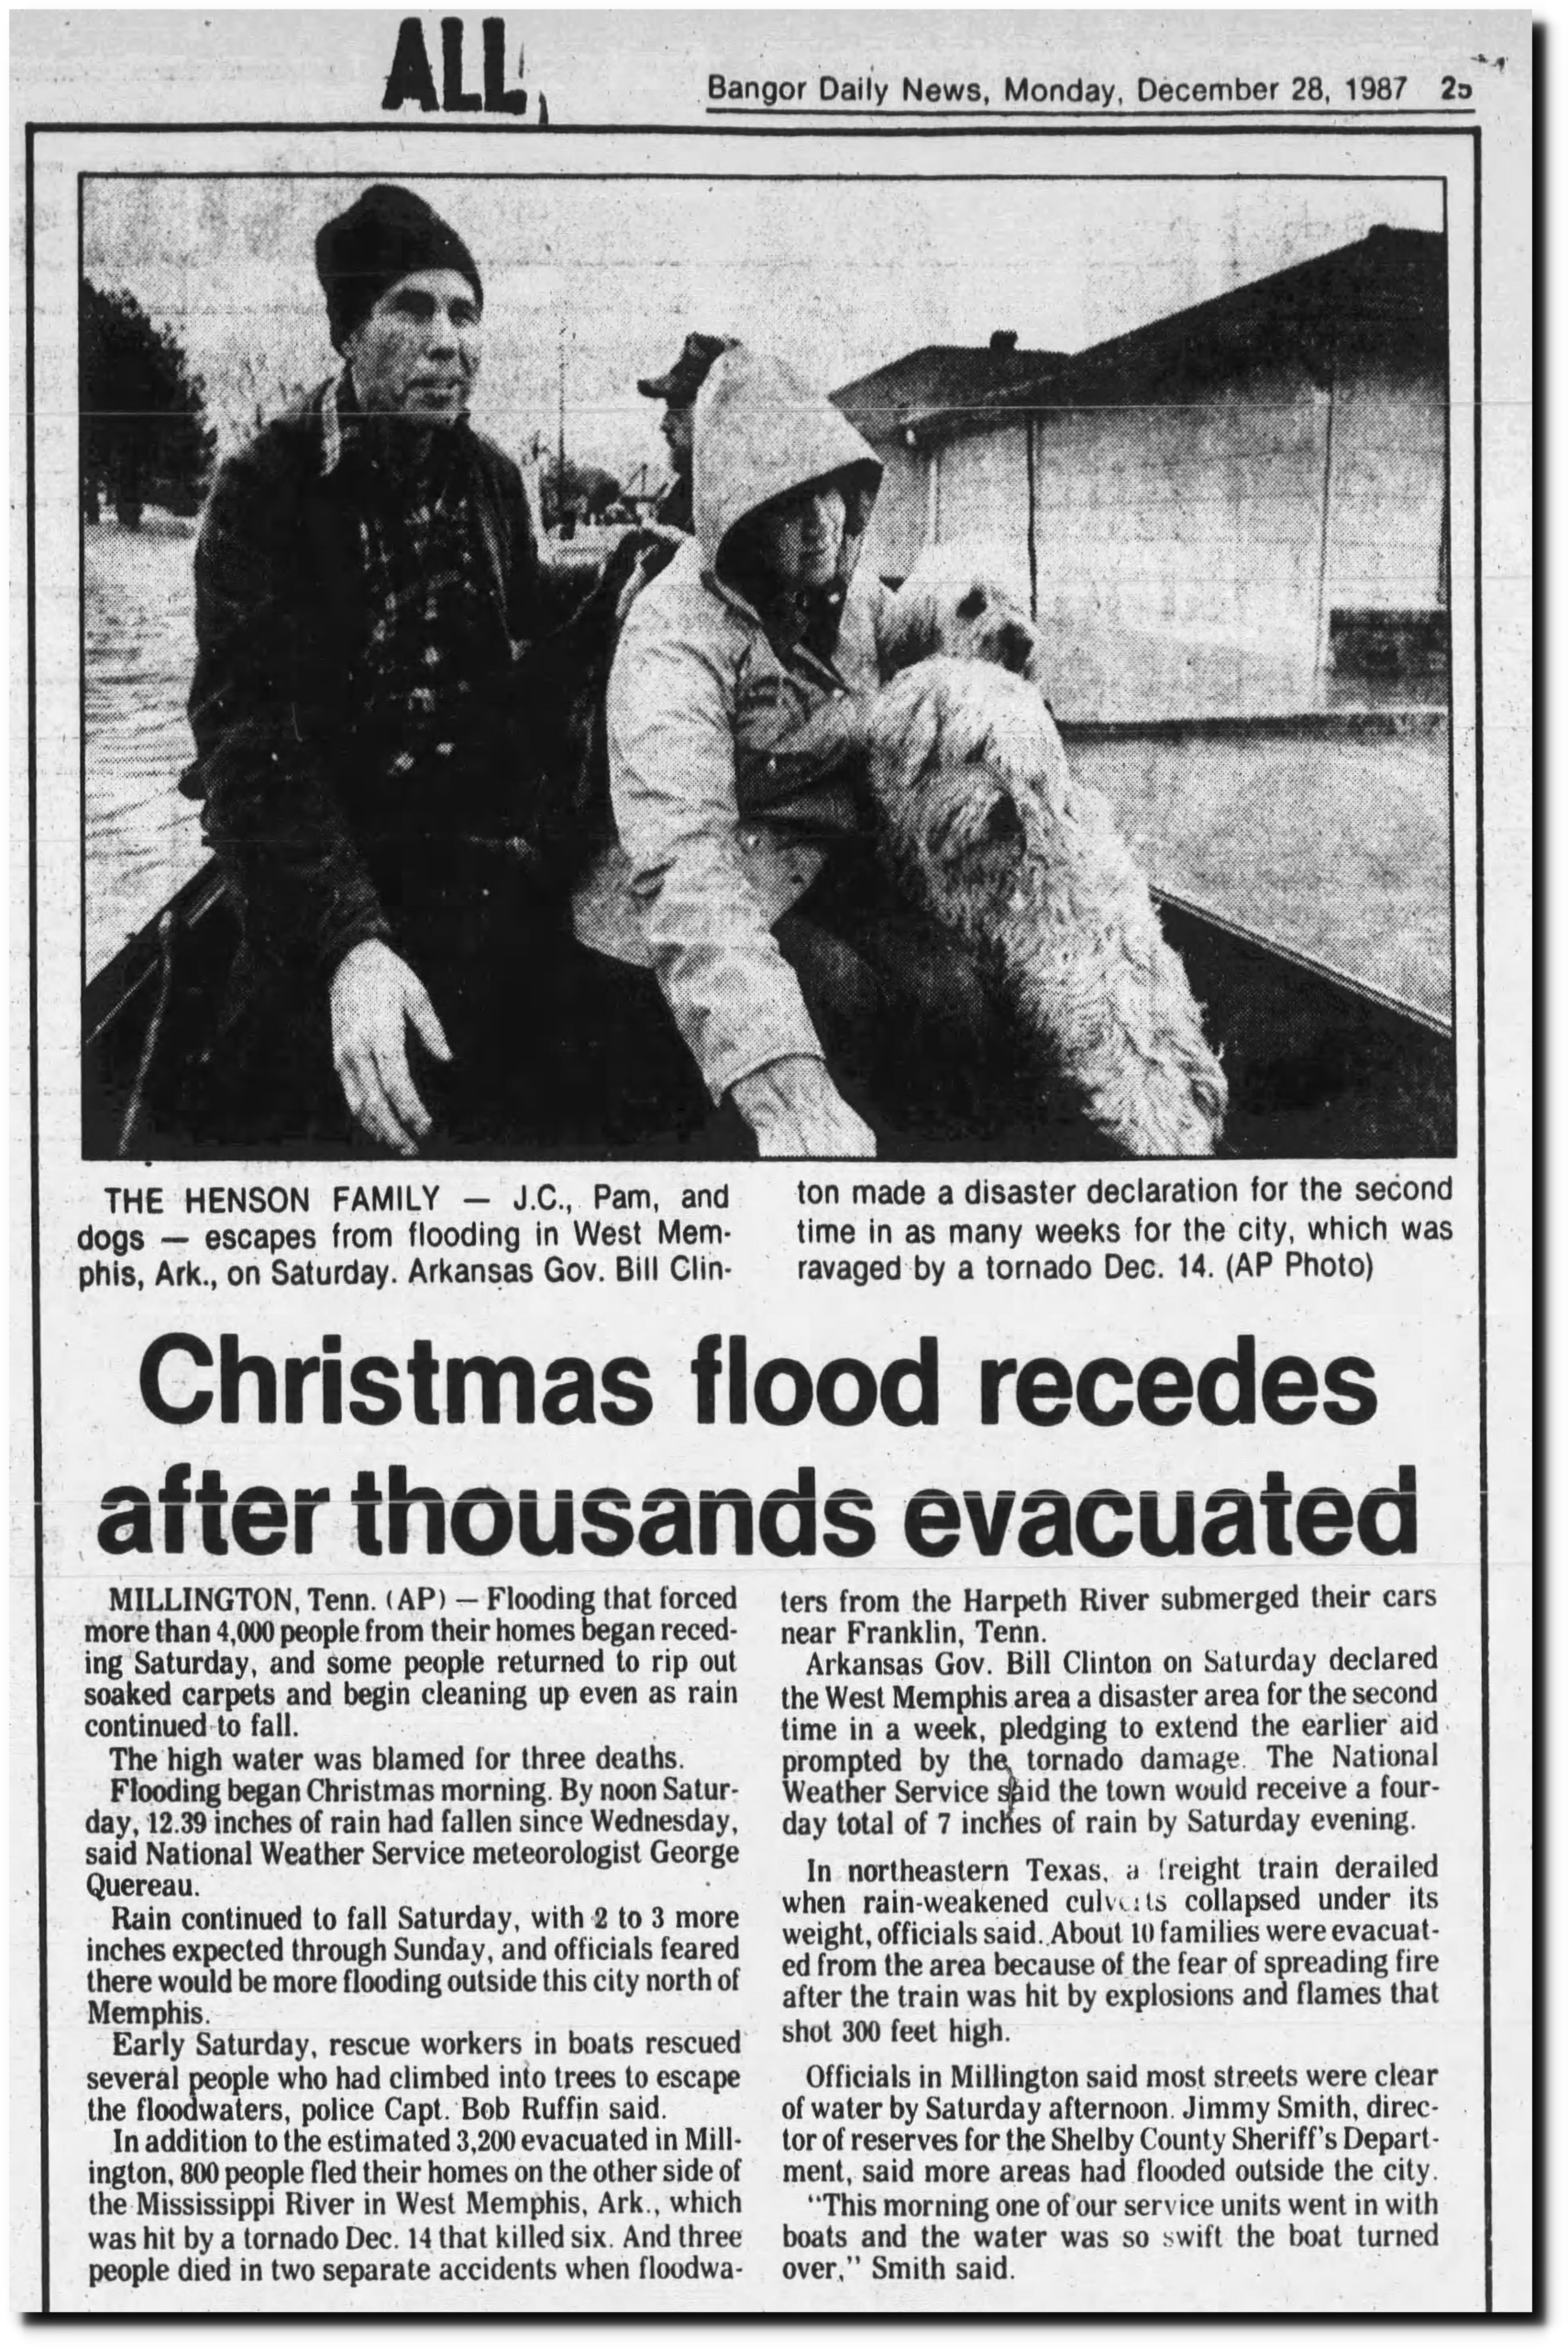
28 Dec 1987, 25 – The Bangor Daily News at Newspapers.com

13 Dec 1953, Page 48 – The Times at Newspapers.com
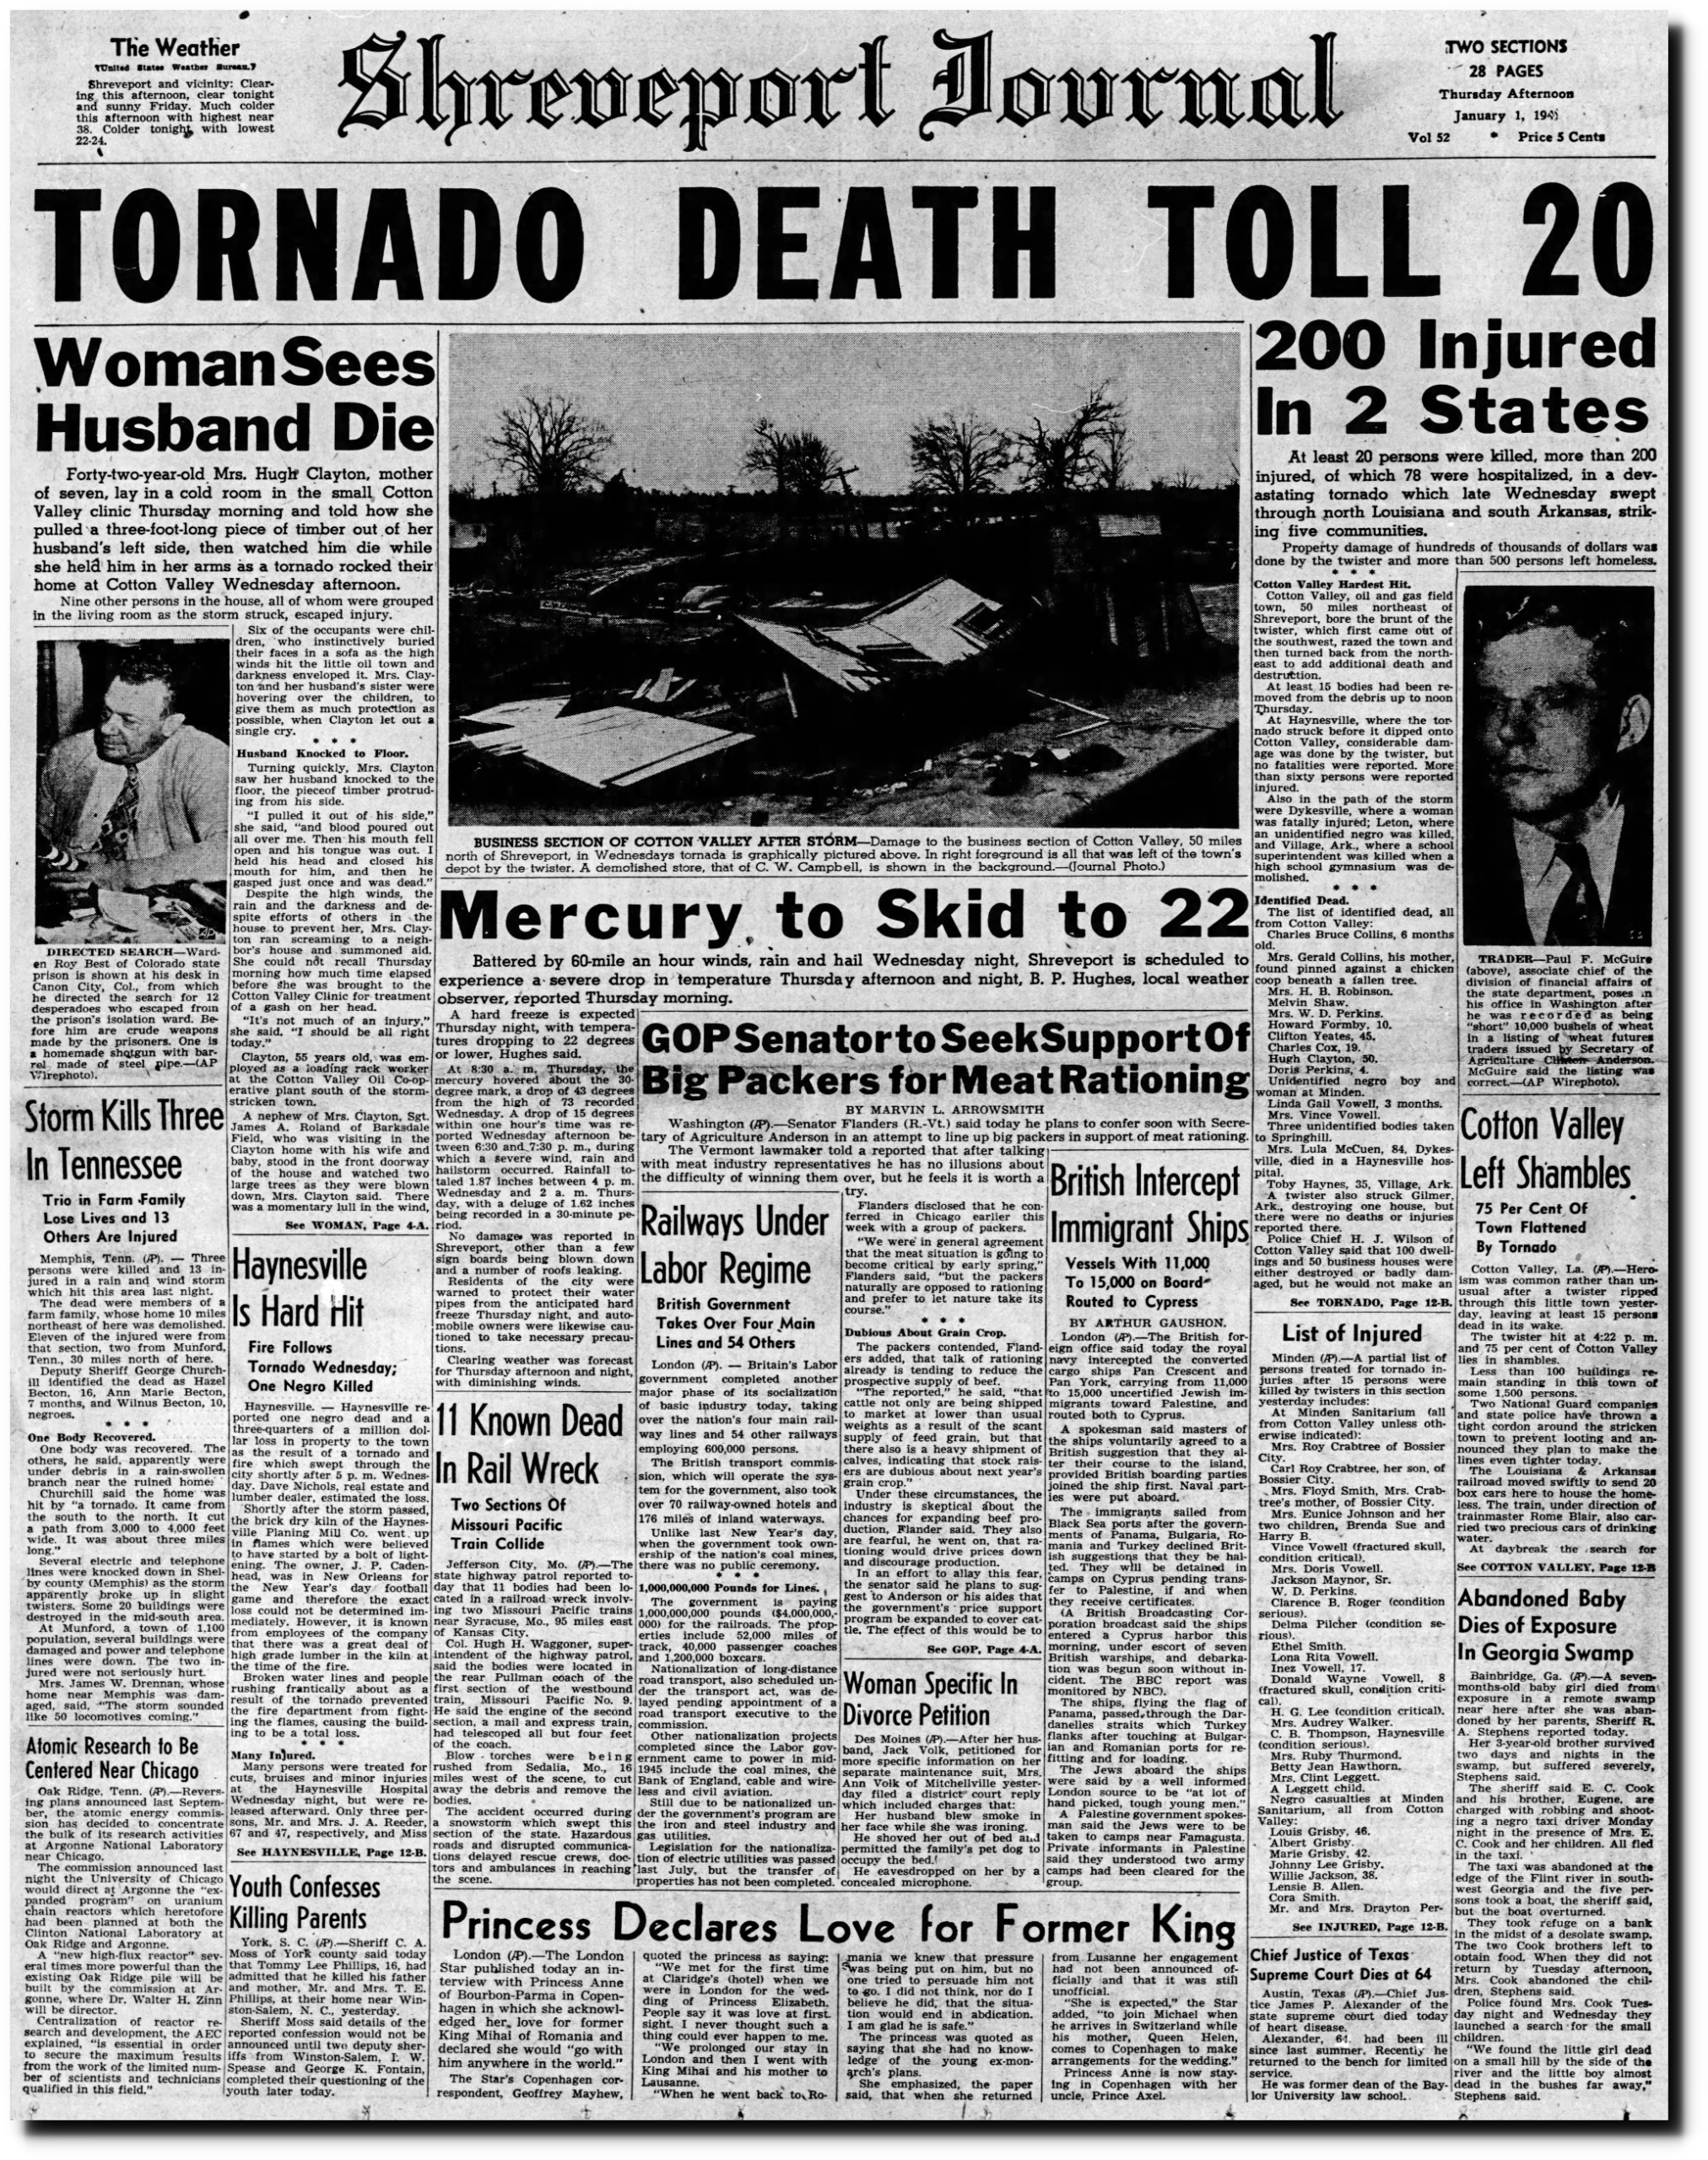
01 Jan 1948, 1 – The Shreveport Journal at Newspapers.com
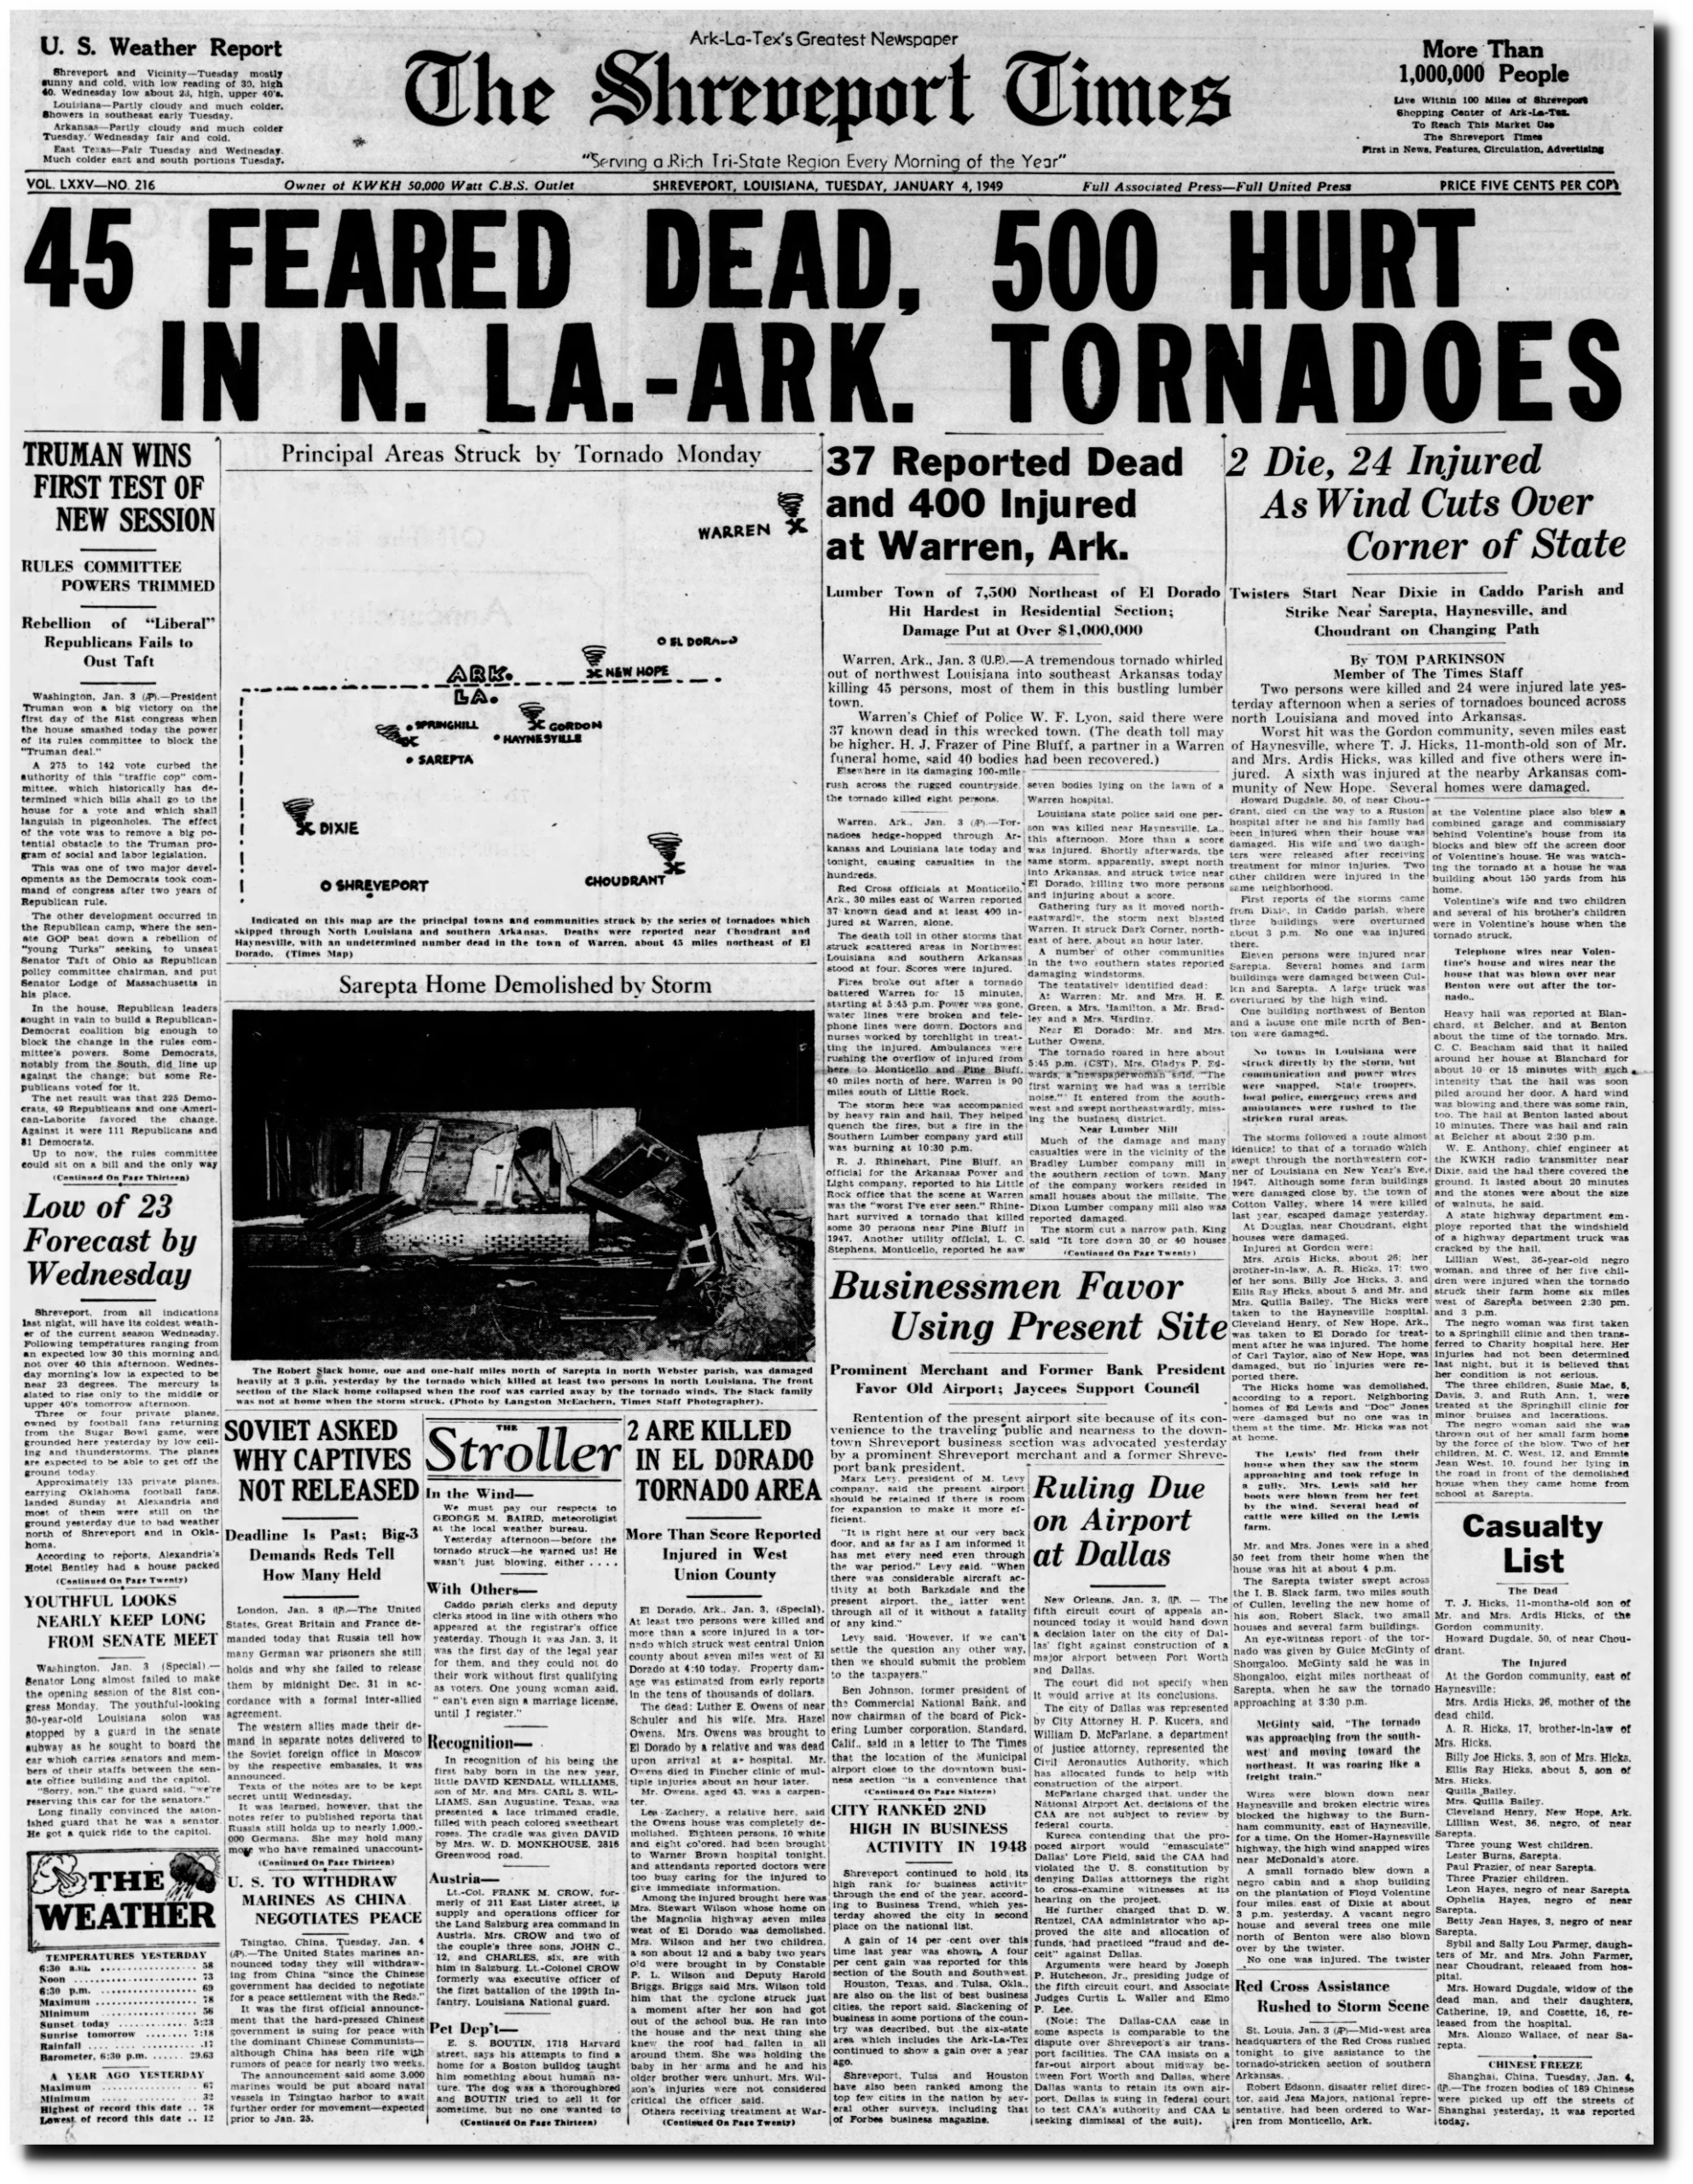
04 Jan 1949, Page 1 – The Times at Newspapers.com
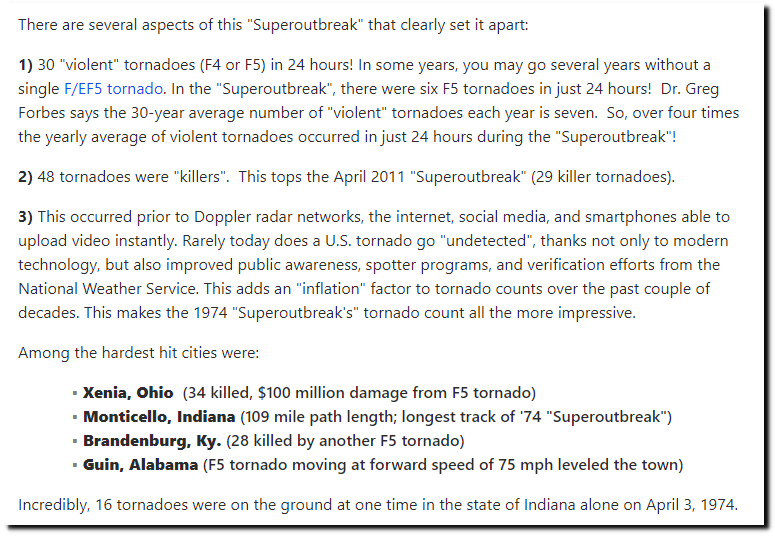
The worst tornado outbreak in Kentucky (and the US) occurred in 1974.
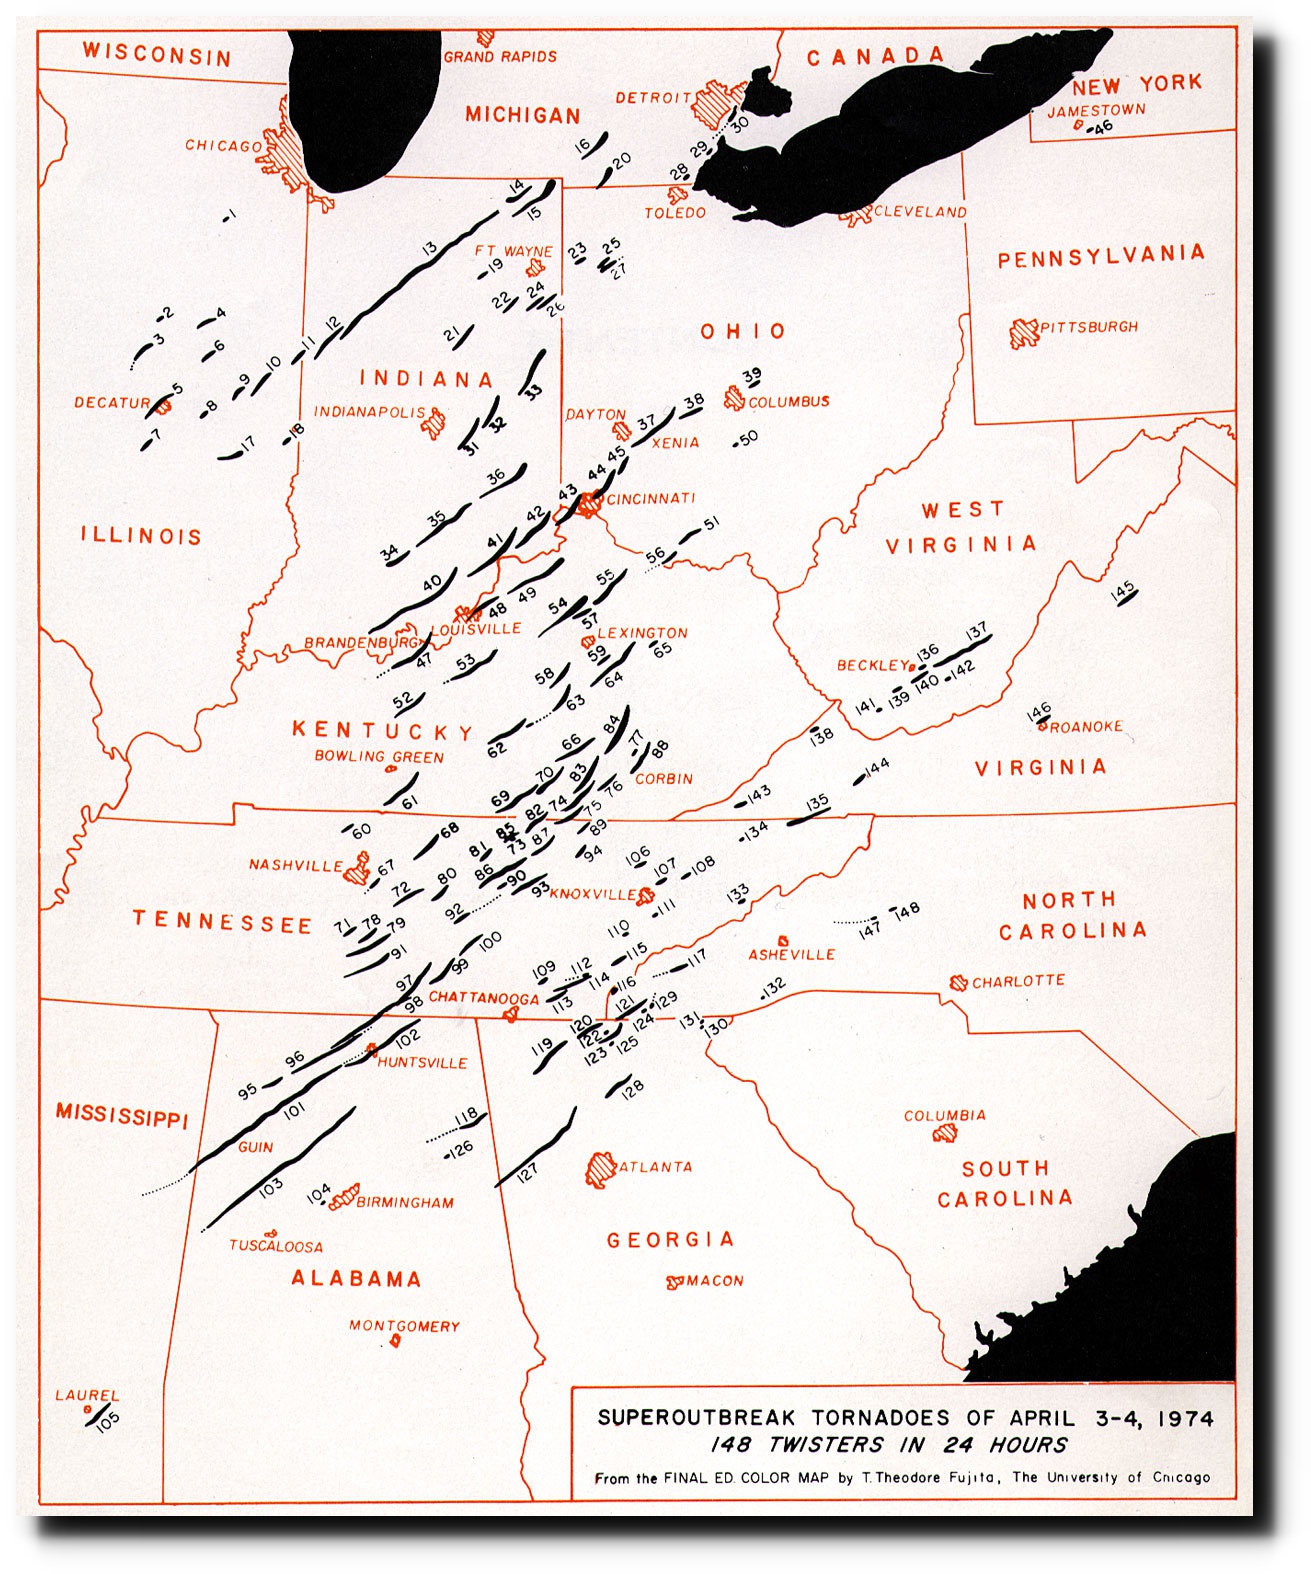
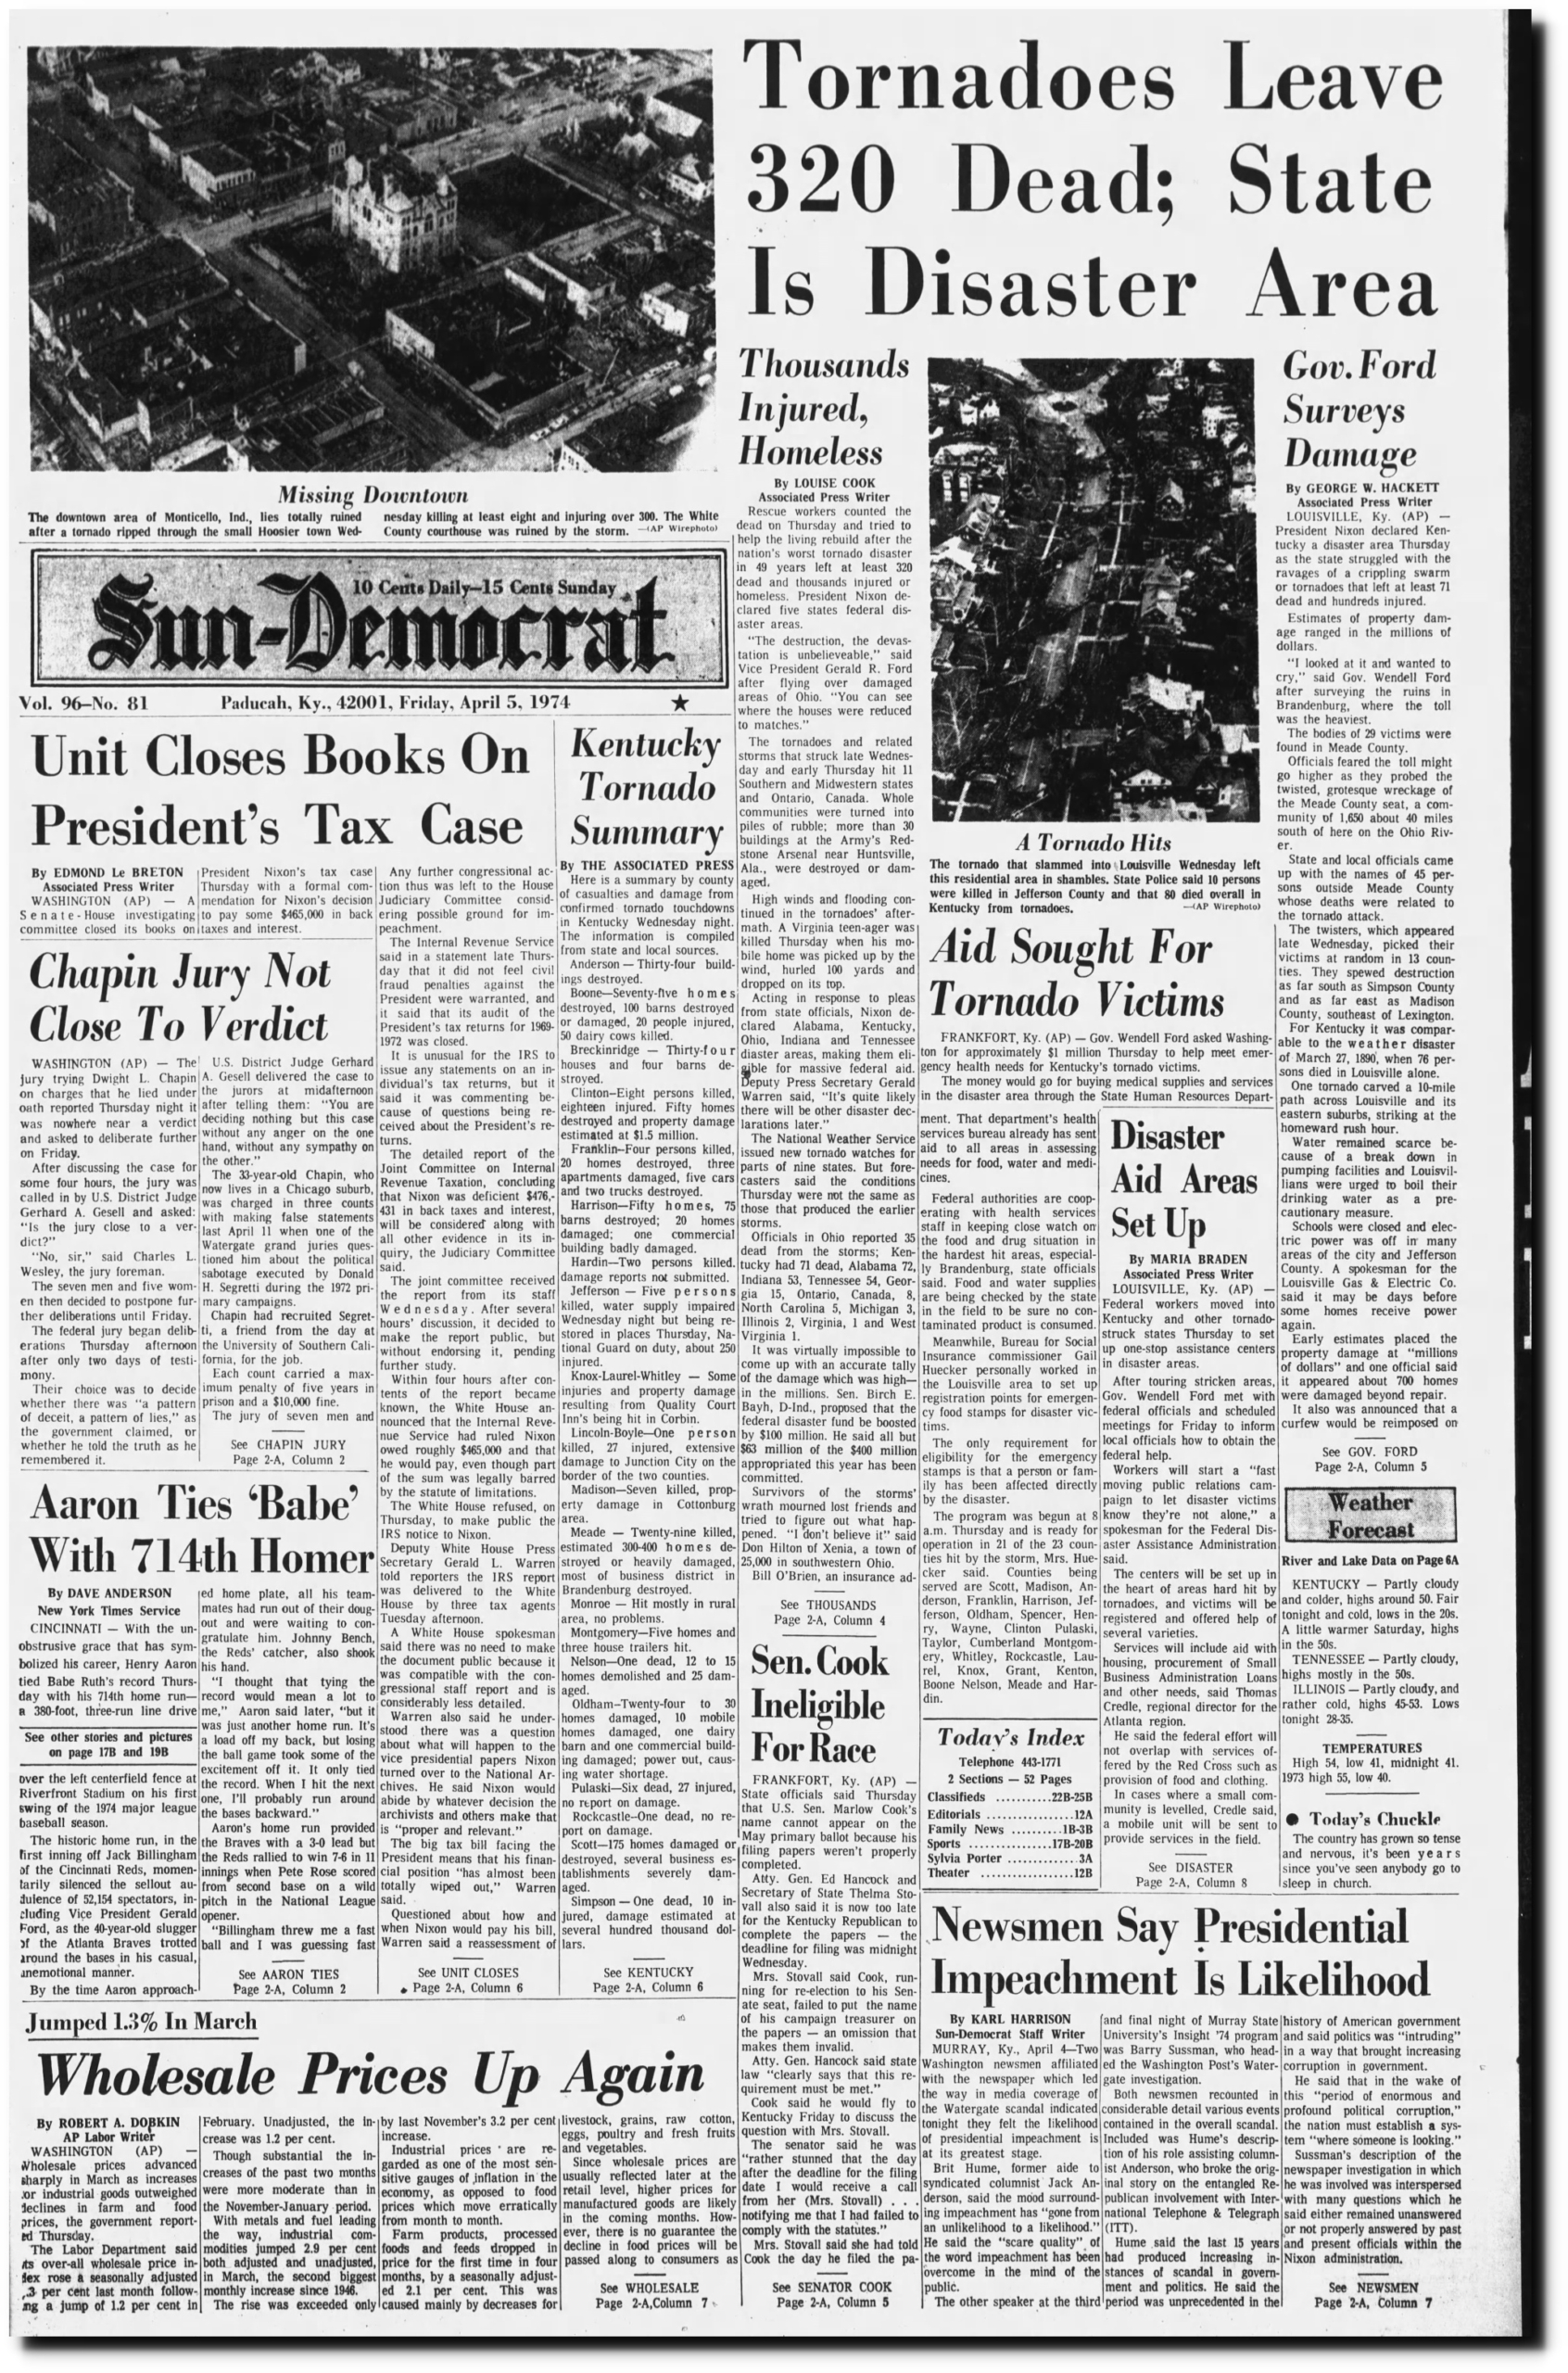
05 Apr 1974, 1 – The Paducah Sun at Newspapers.com
Climatologists blamed it on global cooling.
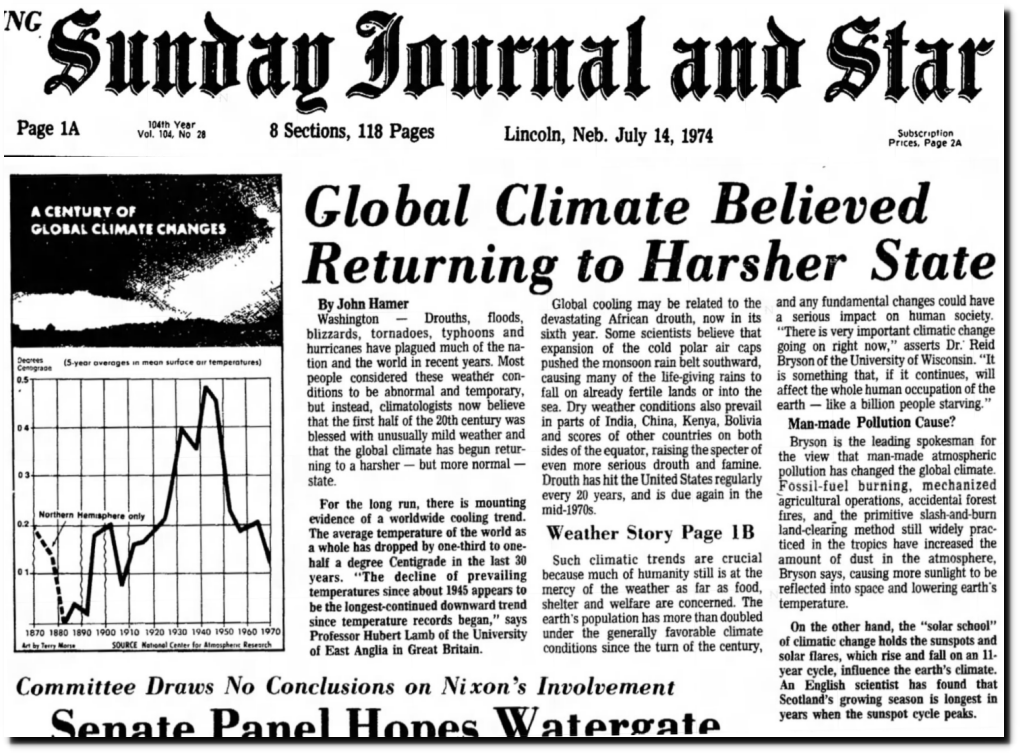
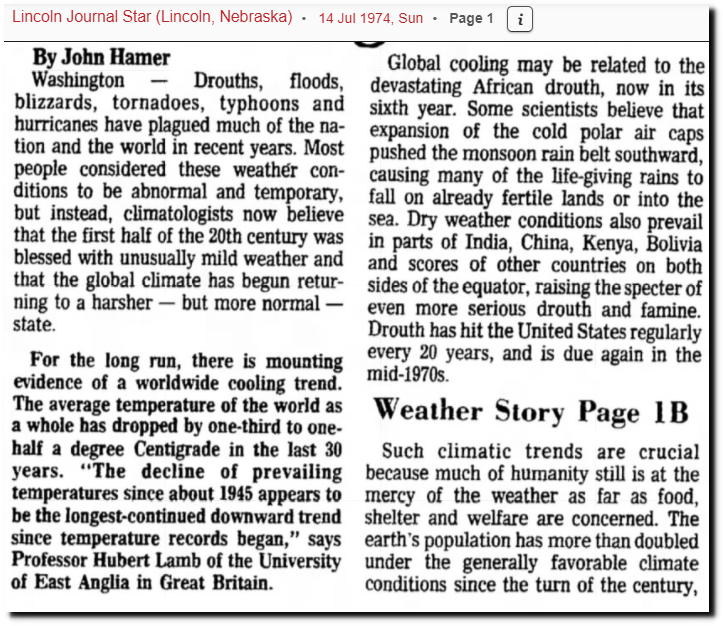
14 Jul 1974, Page 1 – Lincoln Journal Star at Newspapers.com
“The persistent higher temperatures, for which a number of speculative explanations have been given, began in August, 1920, and for the succeeding twelve months there was an average monthly excess above normal of 3,4 degrees”
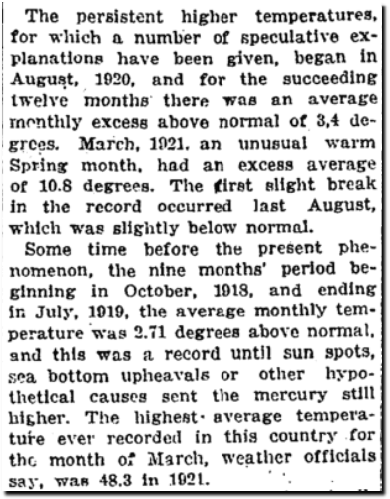
TimesMachine: October 3, 1921 – NYTimes.com
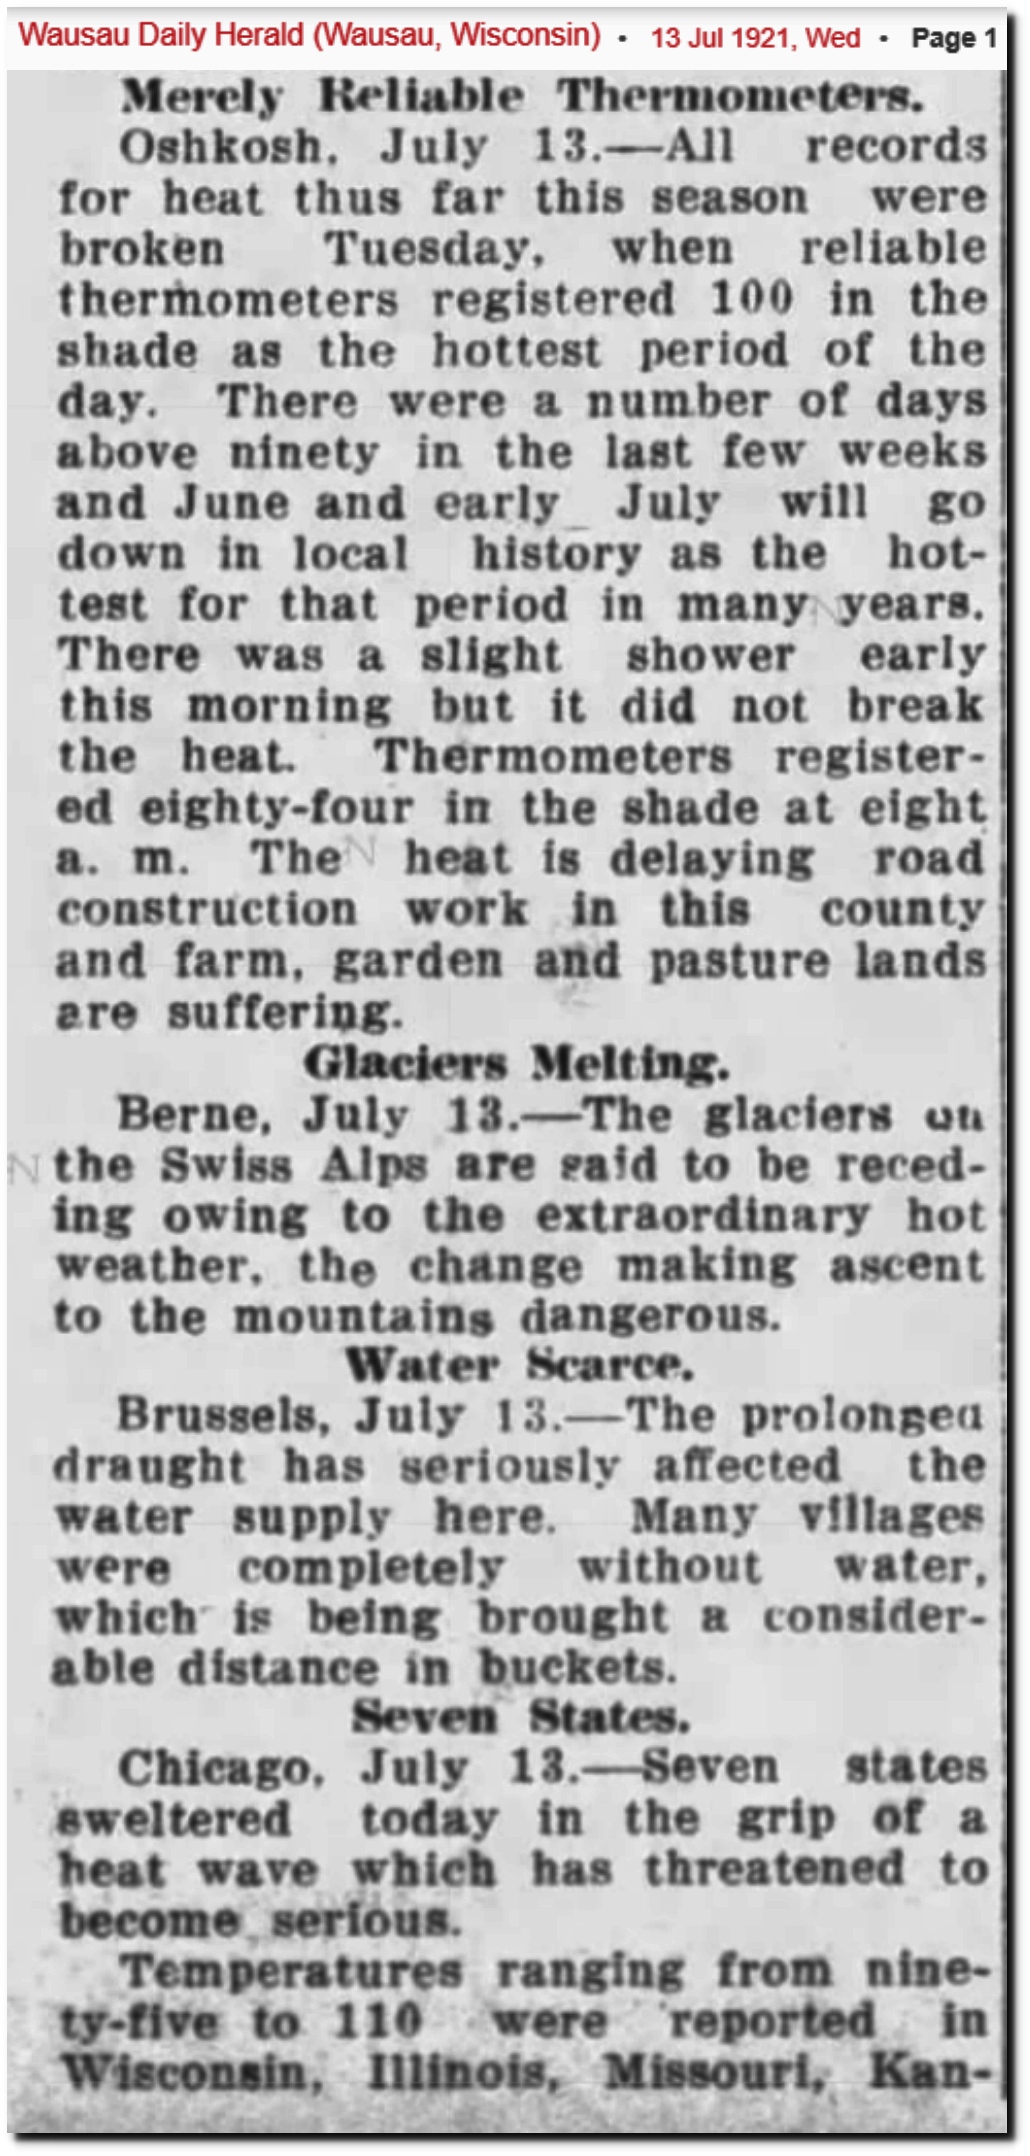
13 Jul 1921, 1 – Wausau Daily Herald at Newspapers.com

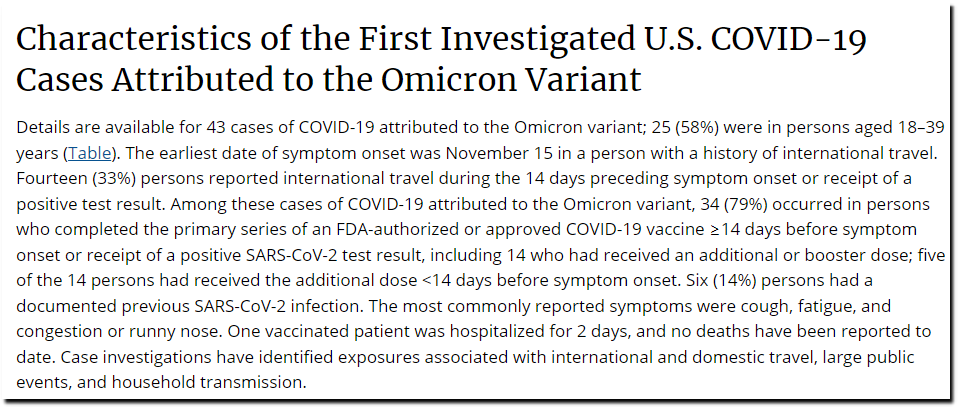
The CDC reports that fully vaccinated people are more likely to get “the Omicron Variant” than unvaccinated people, and that three shots doesn’t help.
“(79%) occurred in persons who completed the primary series of an FDA-authorized or approved COVID-19 vaccine ?14 days before symptom onset or receipt of a positive SARS-CoV-2 test result, including 14 who had received an additional or booster dose”
Meanwhile, Reuters reports that the vaccine works against Omicron but everyone needs three shots.
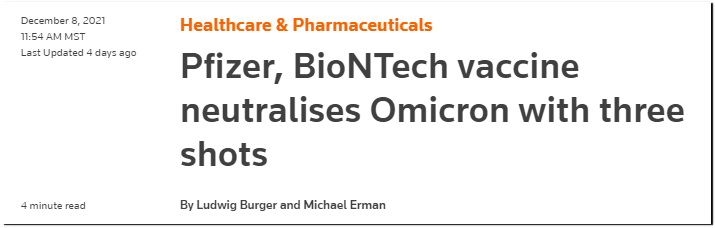
Pfizer, BioNTech vaccine neutralises Omicron with three shots | Reuters
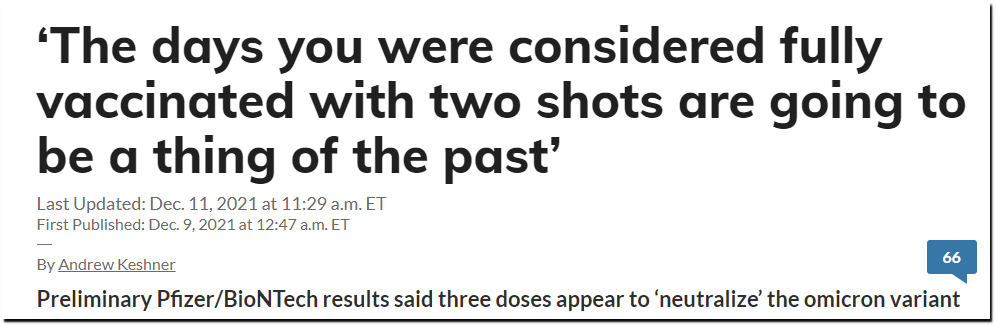
Two shots are a thing of the past.
The former CEO of Reuters is on the Pfizer board of directors.

The Biden administration uses this graph as evidence that burning fossil fuels is making the weather more severe.
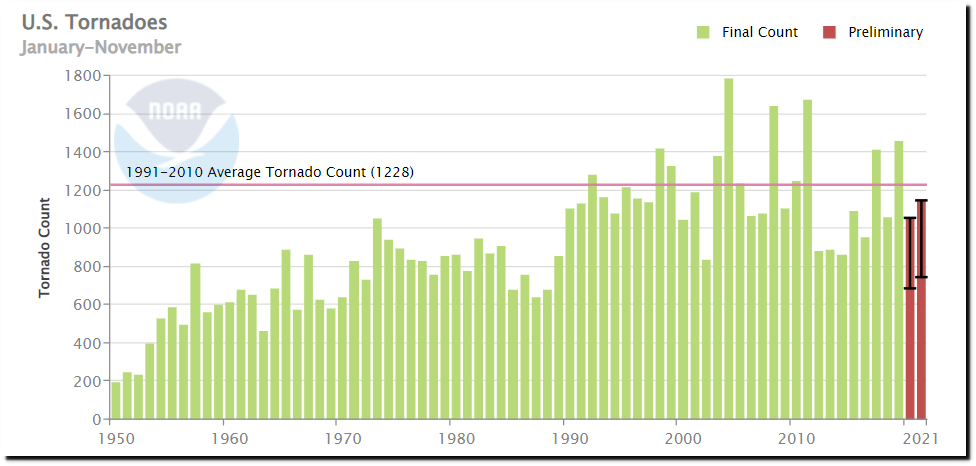
U.S. Tornadoes | Societal Impacts | National Centers for Environmental Information (NCEI)
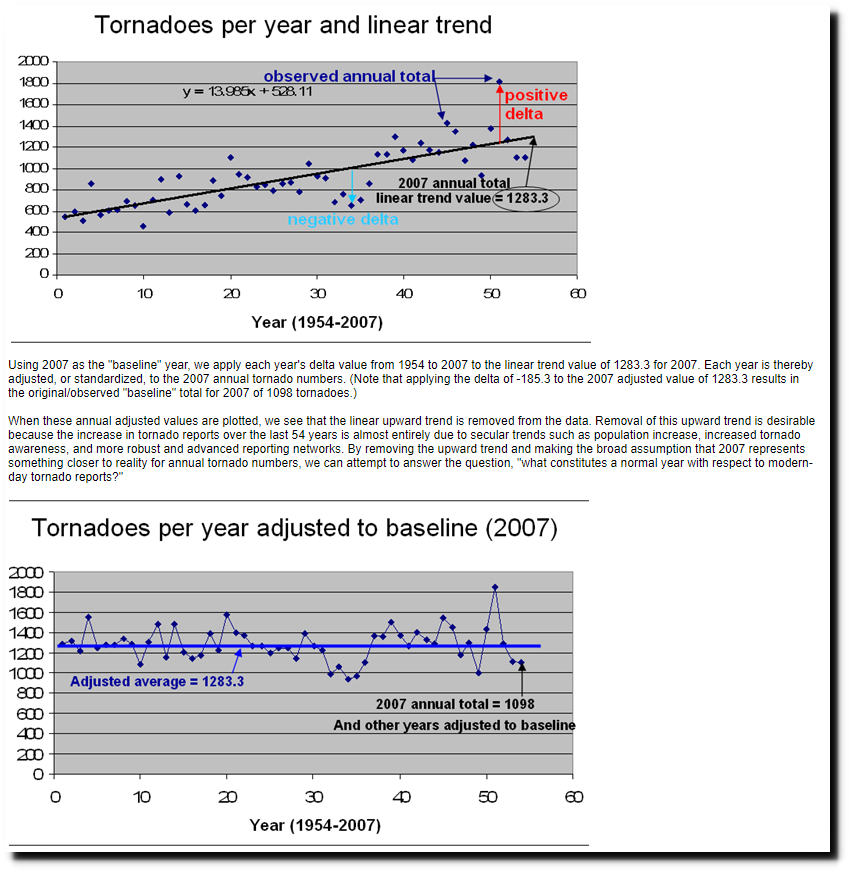
But NOAA knows the graph is flawed due to changes in the way tornadoes are detected and recorded. NOAA adjusts the tornado count for inflation – which makes the apparent increase disappear.

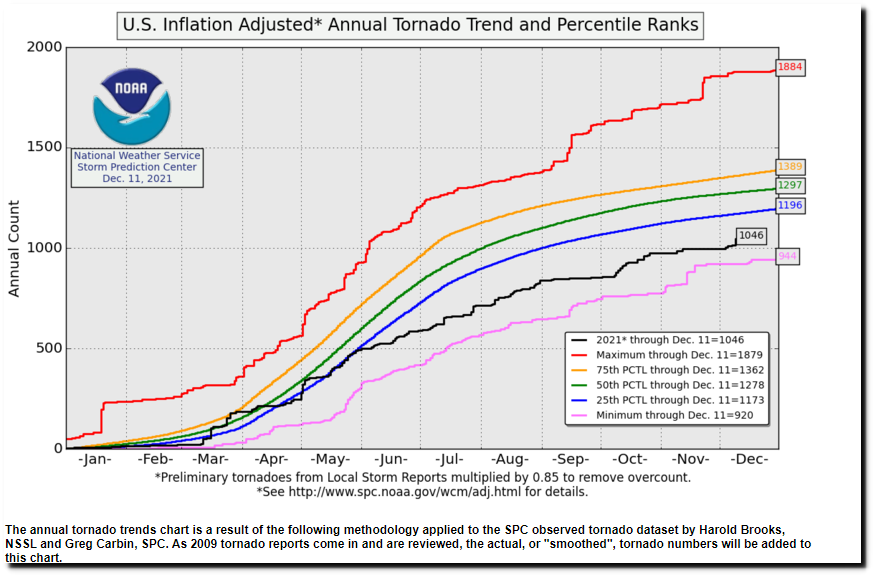
Inflation Adjusted Tornado Running Totals – Storm Prediction Center WCM Page
That NOAA web page has a link to an explanation explaining what is wrong with the data. That web page has been deleted by NOAA, but is available on the Internet Archive.
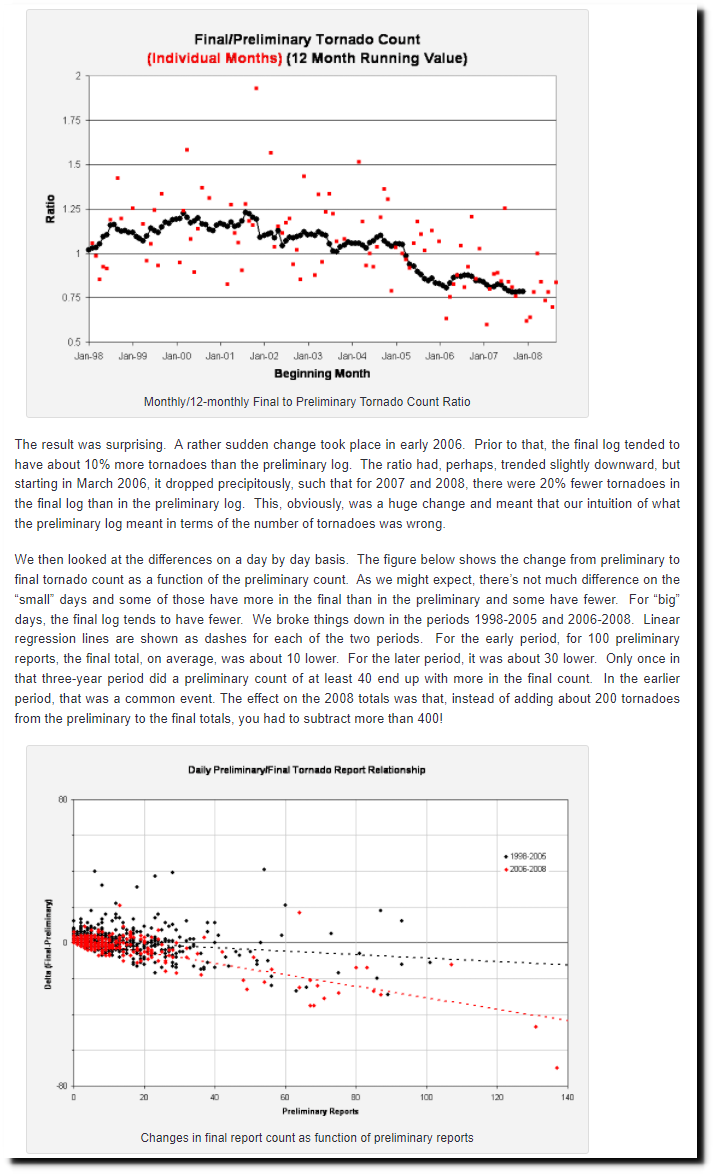
The relationship between preliminary and final tornado reports – NOAA Weather Partners
More meaningful data is the number of strong to violent tornadoes, which peaked in 1974 and have been declining for fifty years. It is much less likely that a violent tornado would have been missed in the past. This graph has also been deleted by NOAA.
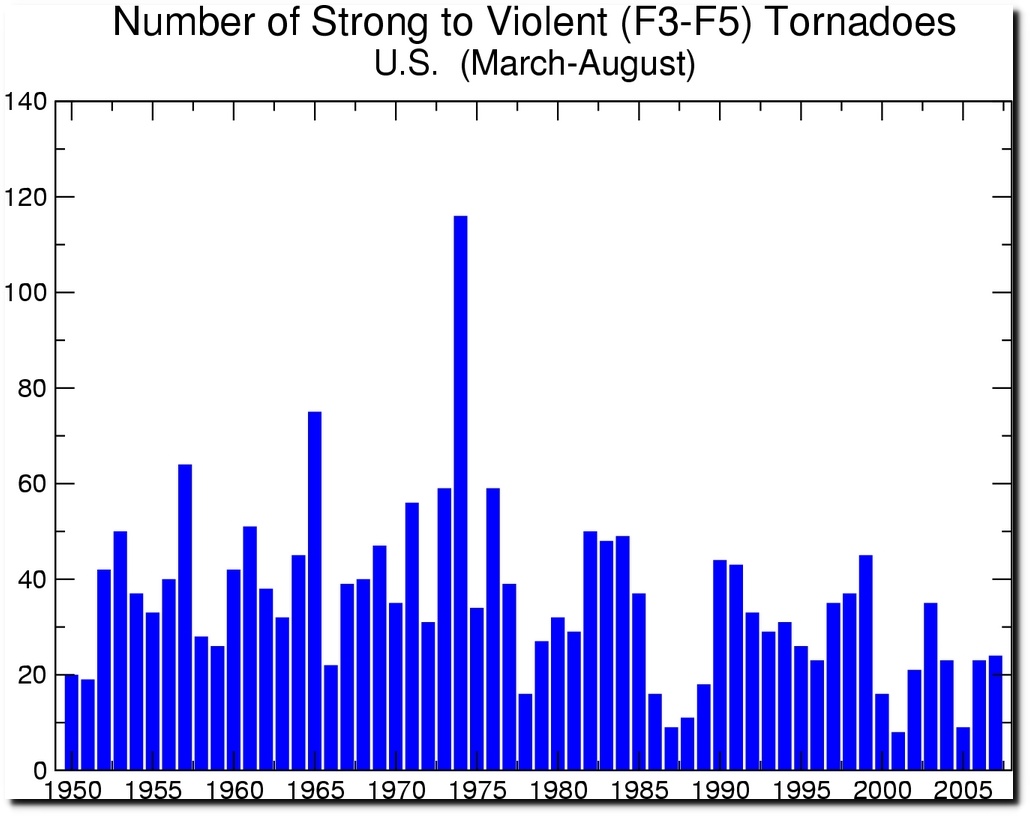
This graph overlays the violent tornados in blue on top of the NOAA all tornado trend, and shows the divergence.
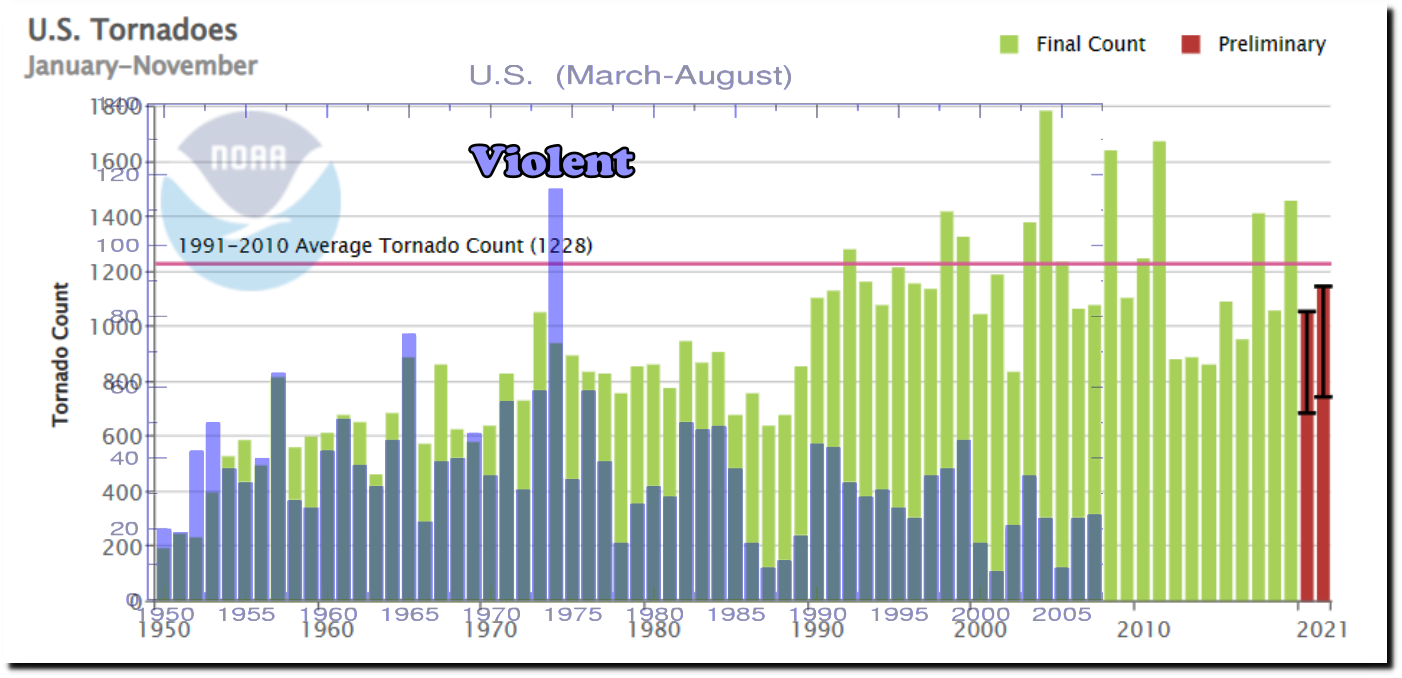
Three years ago was the first year with no violent tornadoes.

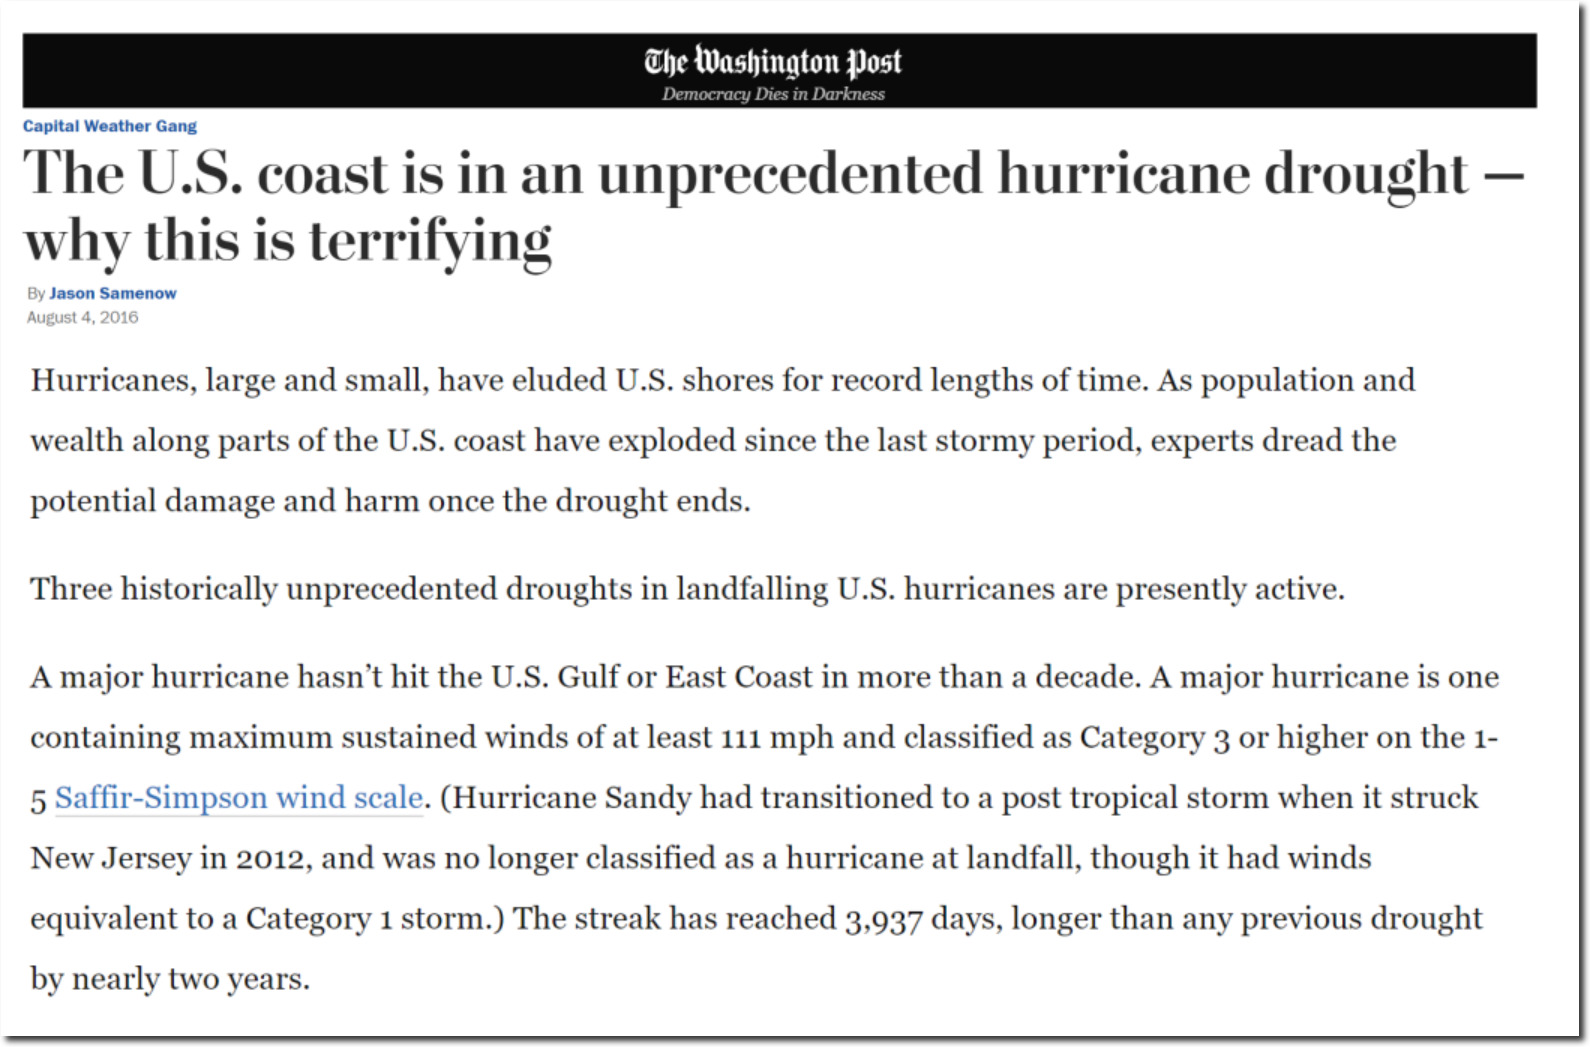
2018 will be the first year with no violent tornadoes in the United States – The Washington Post
And that followed the most quiet period on record for hurricanes.
In 1979, the New York Times explained the fallacy behind the widespread belief the weather was becoming more extreme and more variable.
“GENEVA, Feb 15 — This winter Chicago was paralyzed by snow. Last winter it was Boston. European Russia has just suffered its coldest December in a century. In Britain and Western Europe, the summer of 1976 was the hottest in 250 years. Droughts have recently killed 80 percent of the livestock in parts of Africa and have taken many human lives.
Does this mean that the world climate has become ominously variable? Participants in the world climate conference here who have done systematic studies of the records are almost unanimous in saying no.
Dr. W. J. Gibbs, a leading Australian meteorologist, noting current rapid dissemination of reports on floods, blizzards and “record” temperatures, said: “The variability is not greater but more apparent”.
Dr. B. John Mason, director of the British Weather Services, told a news conference that, despite “a lot of loose statements.” he knew of no evidence that the current extremes were any greater or more frequent than those in earlier decades.
People become vividly aware of current hardships and forget those of the past, Dr. Mason and others said.”
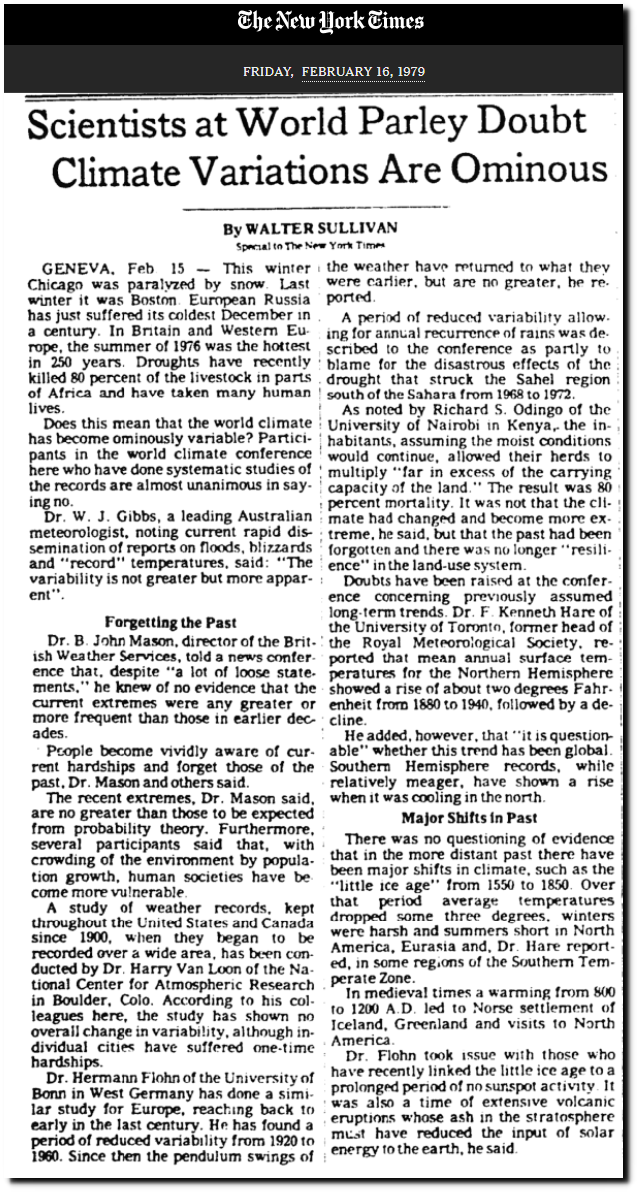
Scientists at World Parley Doubt Climate Variations Are Ominous – The New York Times
“This myth arises over and over again”
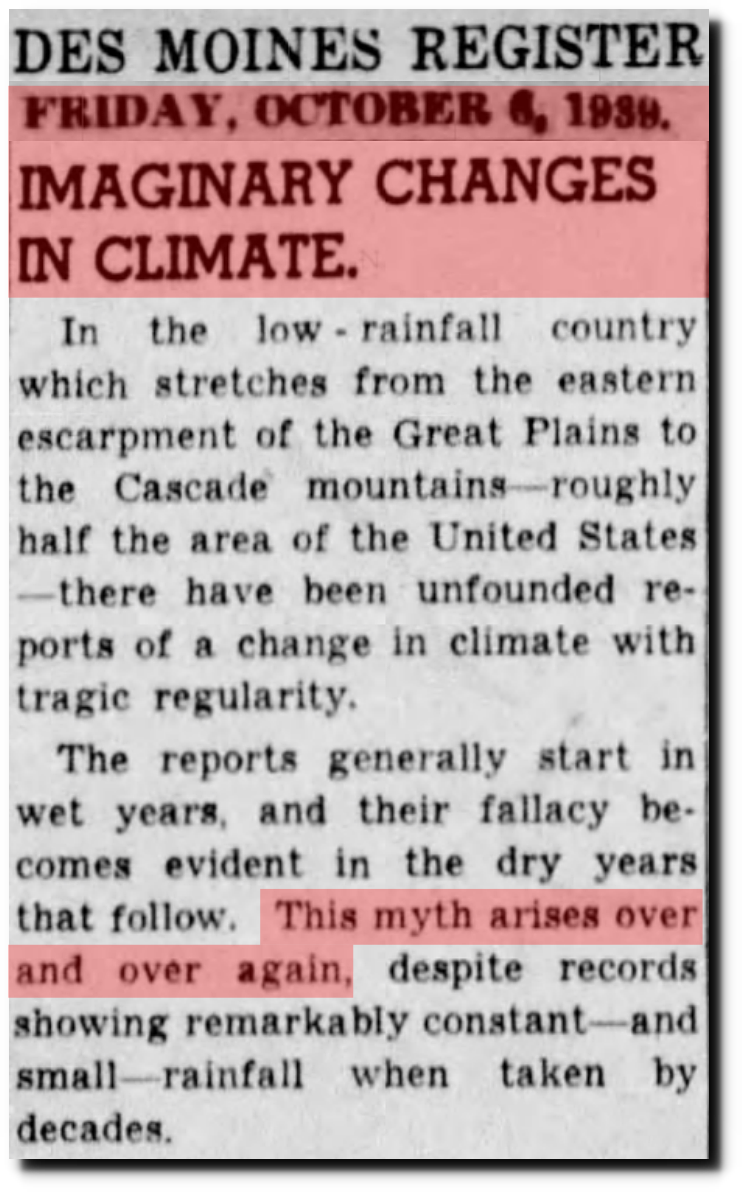 06 Oct 1939, Page 6 – The Des Moines Register at Newspapers.com
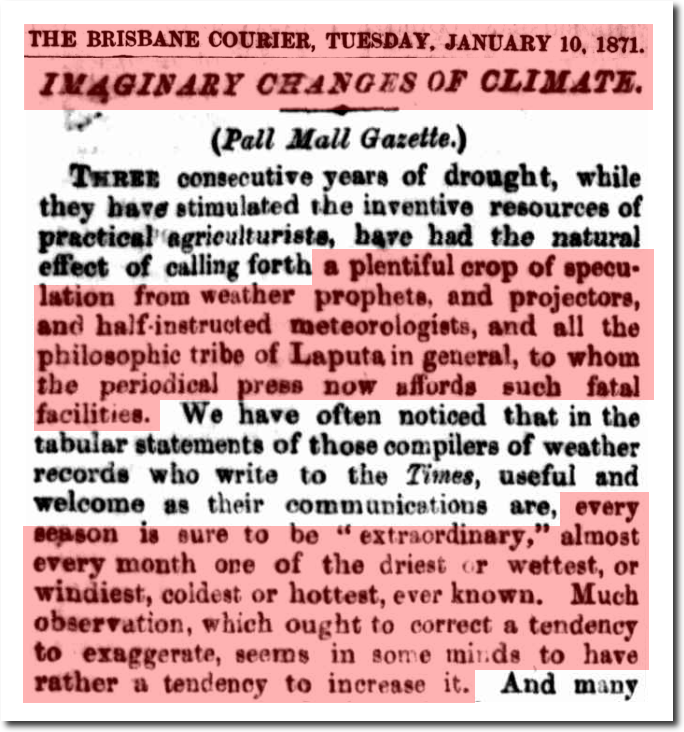
“Much observation, which ought to correct a tendency to exaggerate, seems in some minds to have rather a tendency to increase it.”
It must be the global warming keeping people away from Wyoming.
