

Disrupting the Borg is expensive and time consuming!

Google Search
-
Recent Posts
- One Atomic Bomb Per Hour
- New Video : Analyzing Oil And Gas
- Is Antarctica Melting?
- High Speed Analysis And Visualization
- El Nino To The Rescue?
- Fake News Update
- Growth Of Antarctic Sea Ice
- 65 Years Of Progress!
- El Nino To The Rescue?
- Worst March Drought On Record
- ChartGL Process Control Demo
- The Biggest Money Laundering Scam
- Drought In The Headwaters Of Lake Powell
- Unrealistic Expectations Of Water Availability
- Did Bill Gates Do This?
- Worst March Drought On Record In The US
- The Real Hockey Stick Graph
- Analyzing The Western Water Crisis
- Gaslighting 1924
- “Why Do You Resist?”
- Climate Attribution Model
- Fact Checking NASA
- Fact Checking Grok
- Fact Checking The New York Times
- New Visitech Features
June 2026 M T W T F S S 1 2 3 4 5 6 7 8 9 10 11 12 13 14 15 16 17 18 19 20 21 22 23 24 25 26 27 28 29 30 Recent Comments
- Bob G on One Atomic Bomb Per Hour
- Bob G on One Atomic Bomb Per Hour
- Hank Phillips on One Atomic Bomb Per Hour
- Hank Phillips on One Atomic Bomb Per Hour
- Bob G on One Atomic Bomb Per Hour
- Bob G on One Atomic Bomb Per Hour
- Bob G on One Atomic Bomb Per Hour
- Bob G on One Atomic Bomb Per Hour
- Jack the Insider on One Atomic Bomb Per Hour
- Bob G on One Atomic Bomb Per Hour
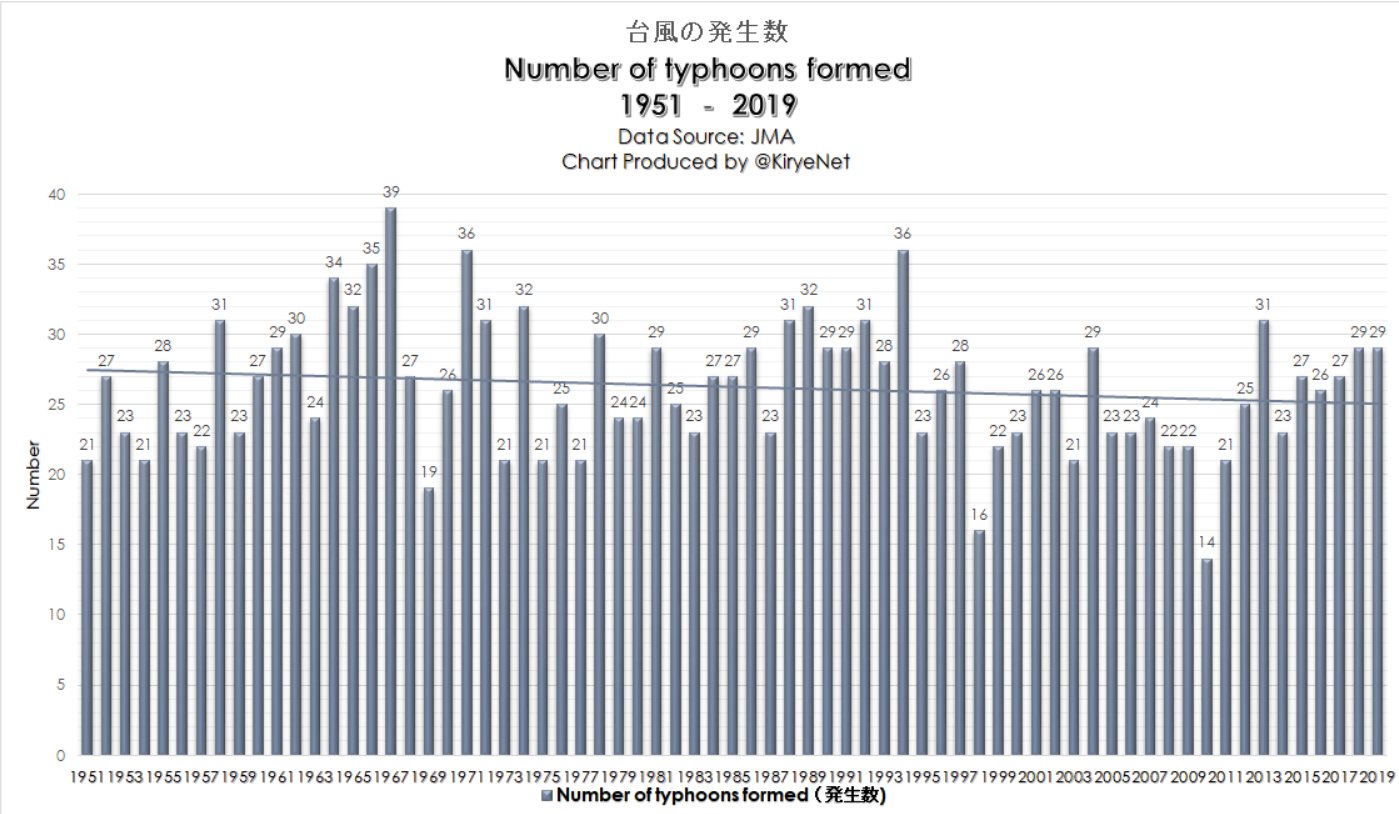
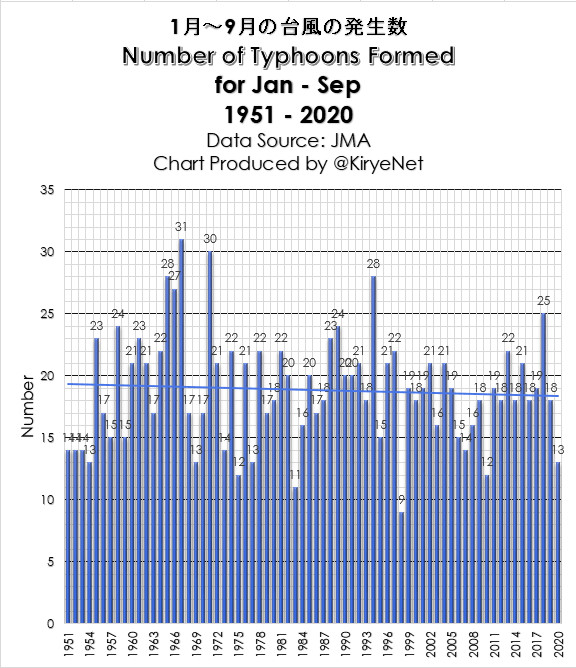
Number Of Typhoons Formed From January Through September Between 1951 And 2020
Today, I checked the data for typhoons that also include this September.
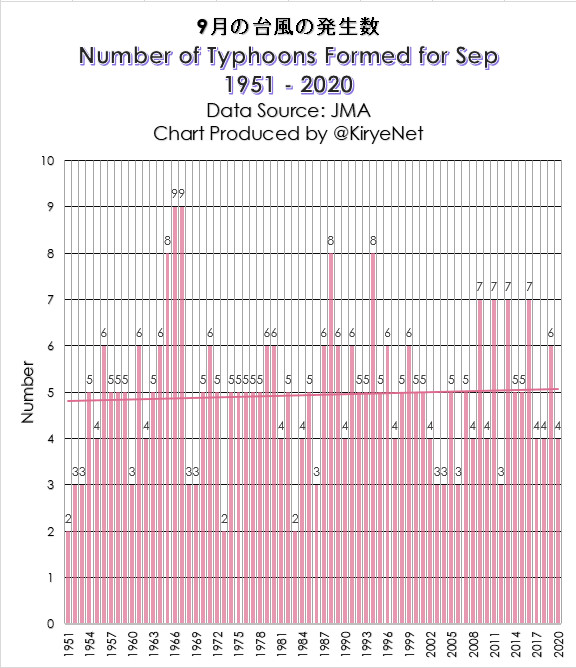
Looking at the data for September alone, the number of typhoons formed has been trending up modestly since 1951.
However, during this September four typhoons formed, which was below the 1981-2010 mean value of 4.8.
Also the number of typhoons formed from January through September between 1951 and 2020 shows a downward trend.
You can also see a downward trend by looking at the annual data up through 2019.
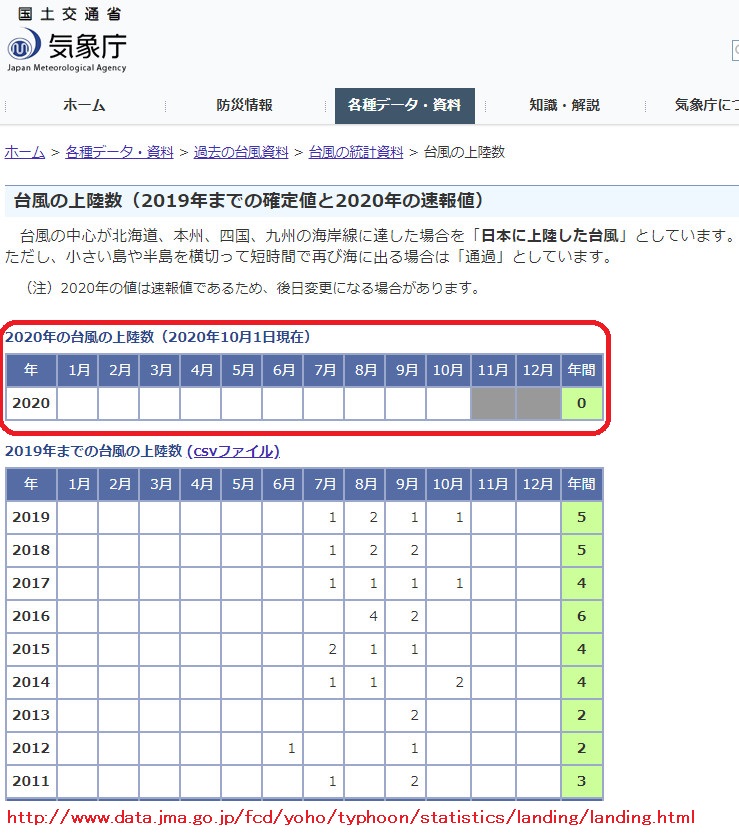
Furthermore, as of October 1, the number of typhoons landings in Japan this year is still zero, according to the Japan Meteorological Agency (JMA).
Posted in Uncategorized
Leave a comment
New Video : Fighting Fire Superstition
In this video I discuss the superstition and misinformation about forest fires which the press and Democrats hold as their religion.
Posted in Uncategorized
Leave a comment
Russian Collusion
Posted in Uncategorized
Leave a comment
GHCN Unadjusted Data Show Zanzibar Has Seen A Cooling Trend Since 1880!
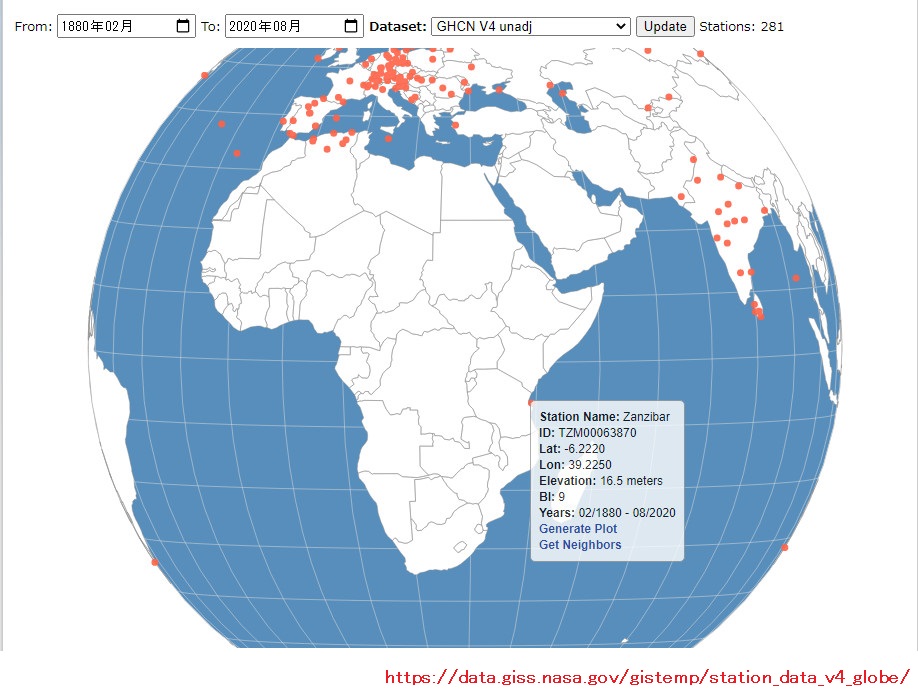
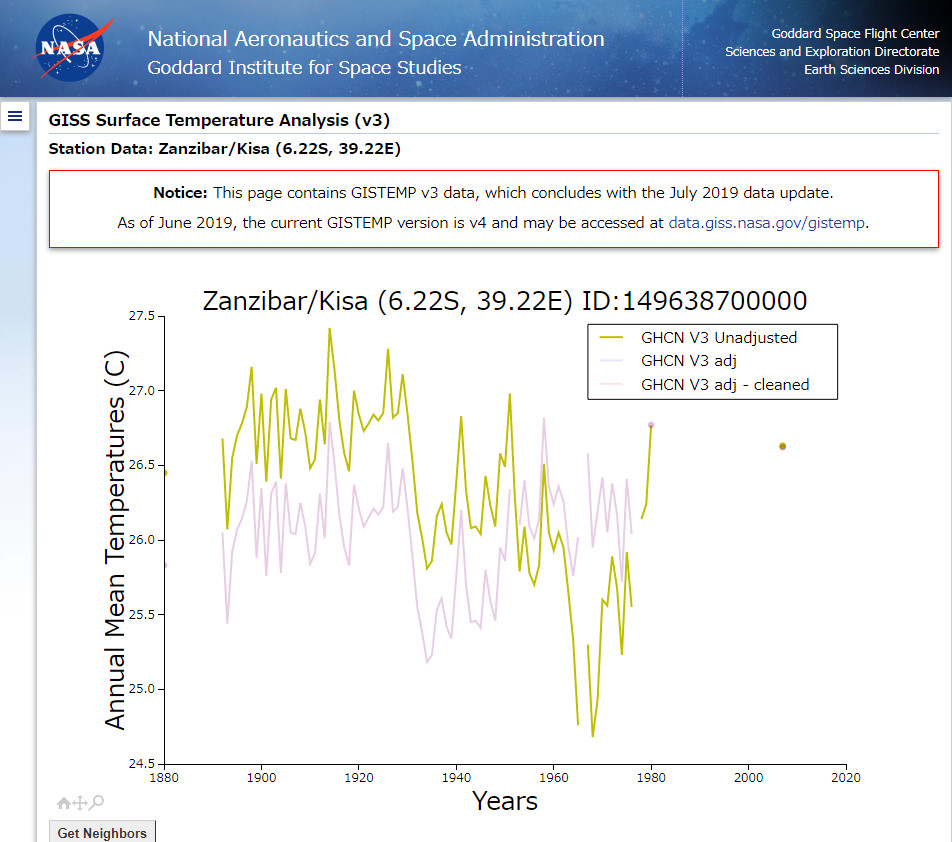
What follows is the data from the Tanzanian Island of Zanzibar in the Indian Ocean.
NASA’s website tells us that the GHCN V3 Unadjusted data gives the mean annual temperature up to 2007, despite the V3 dataset being updated up to July 2019, and the trend is a cooling.
According to NASA, in the GHCN V4 dataset, the station has the mean annual temperature data after 2007, not only the data of up to 2007 from 1880.
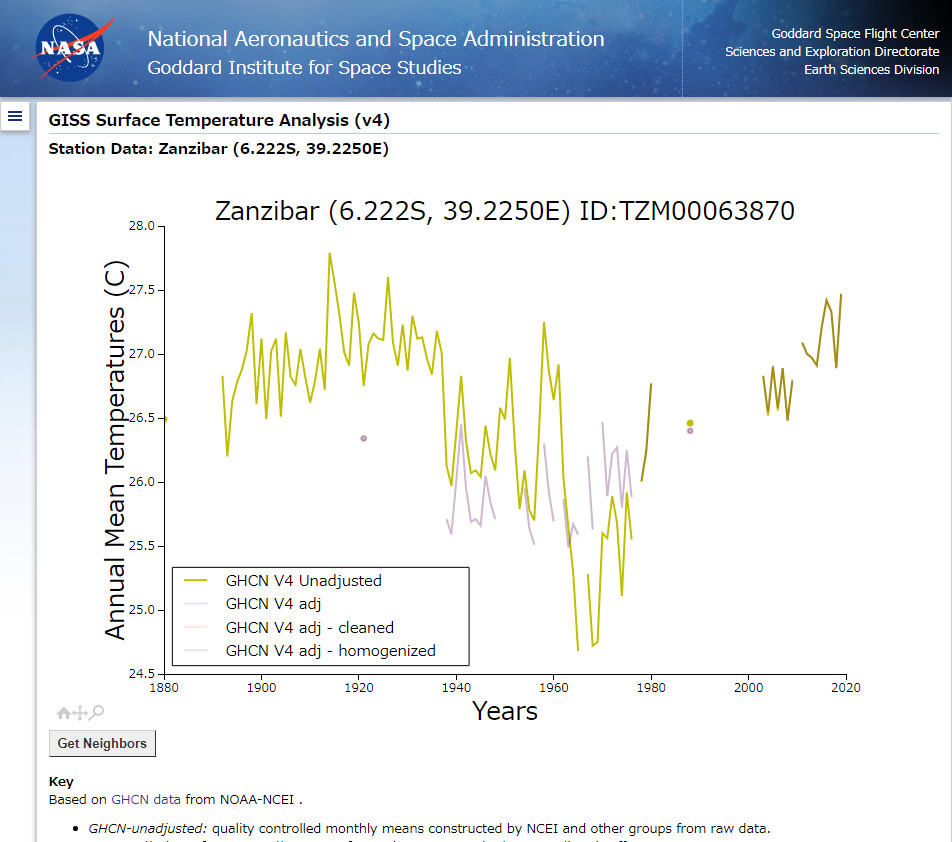
What is worse, the GHCN V4 Unadjusted data show Zanzibar has seen a cooling trend since 1880, but the GHCN V4 adj – homogenized show that the island has had a warming trend.
? GHCN V4 Unadjusted vs. GHCN V4 adj – homogenized
I wonder just how much NASA likes data alteration?
? GHCN V3 Unadjusted vs GHCN V4 Unadjusted
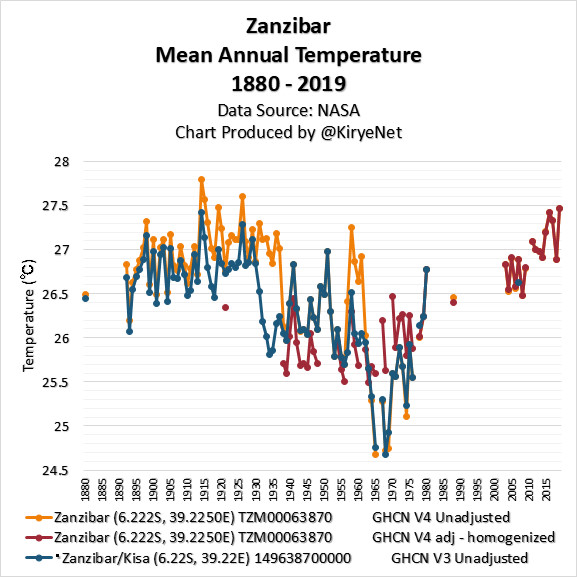
? GHCN V4 Unadjusted vs. GHCN V4 adj – homogenized and GHCN V3 Unadjusted
Posted in Uncategorized
Leave a comment
Listen To The Scientists
Democrats always say “listen to the scientists” – while ignoring what the scientists are actually saying.

Coronavirus: Health experts join global anti-lockdown movement – BBC News
Posted in Uncategorized
Leave a comment