This is the current NASA land surface temperature graph, which shows steady warming from 1880 to 1980, and then faster warming since 1980.
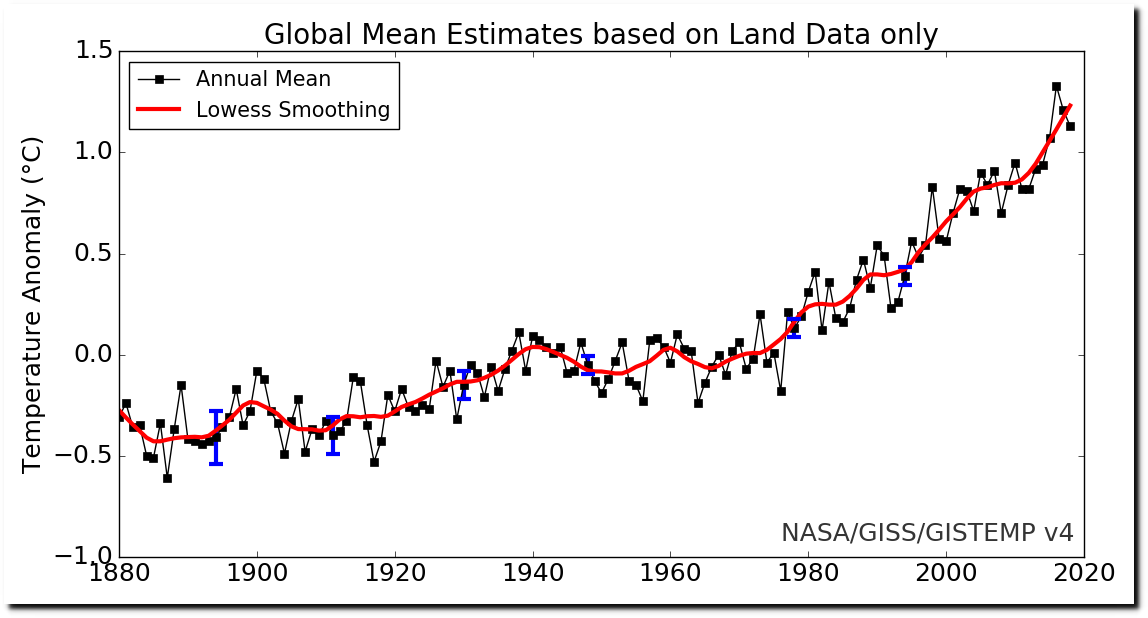
graph.png (1130×600)
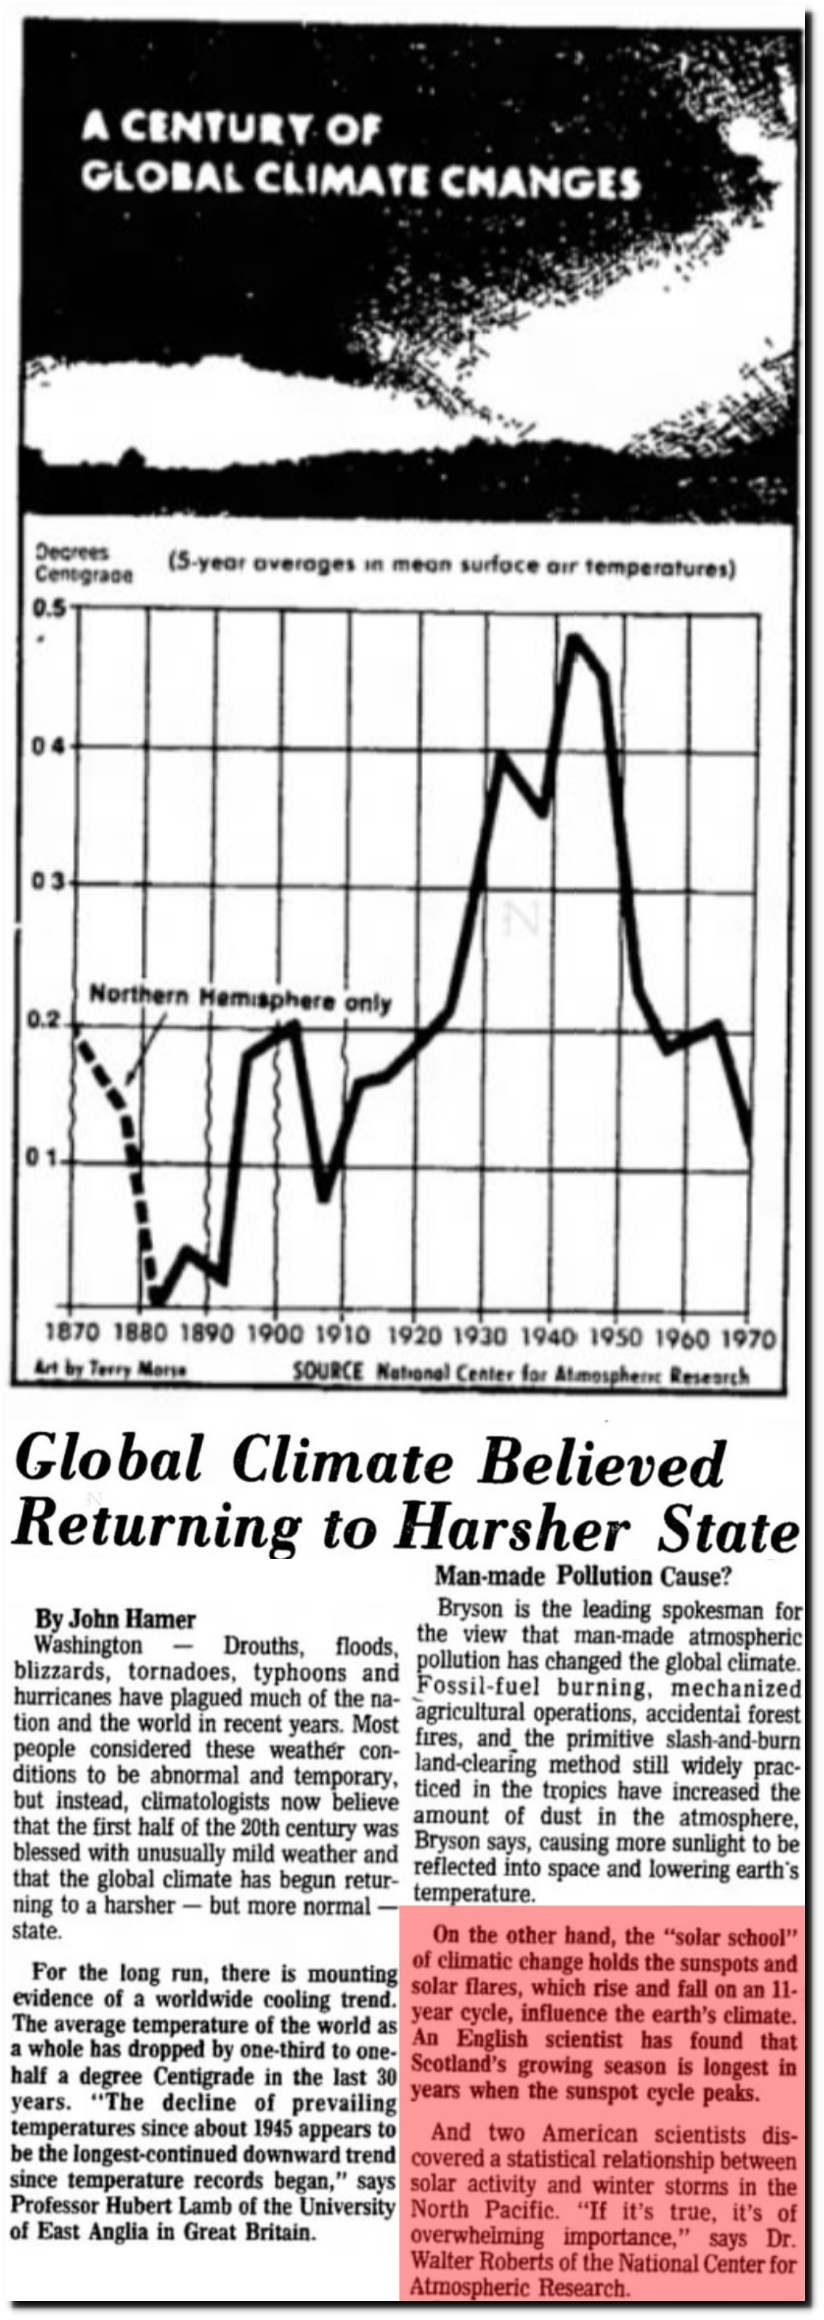
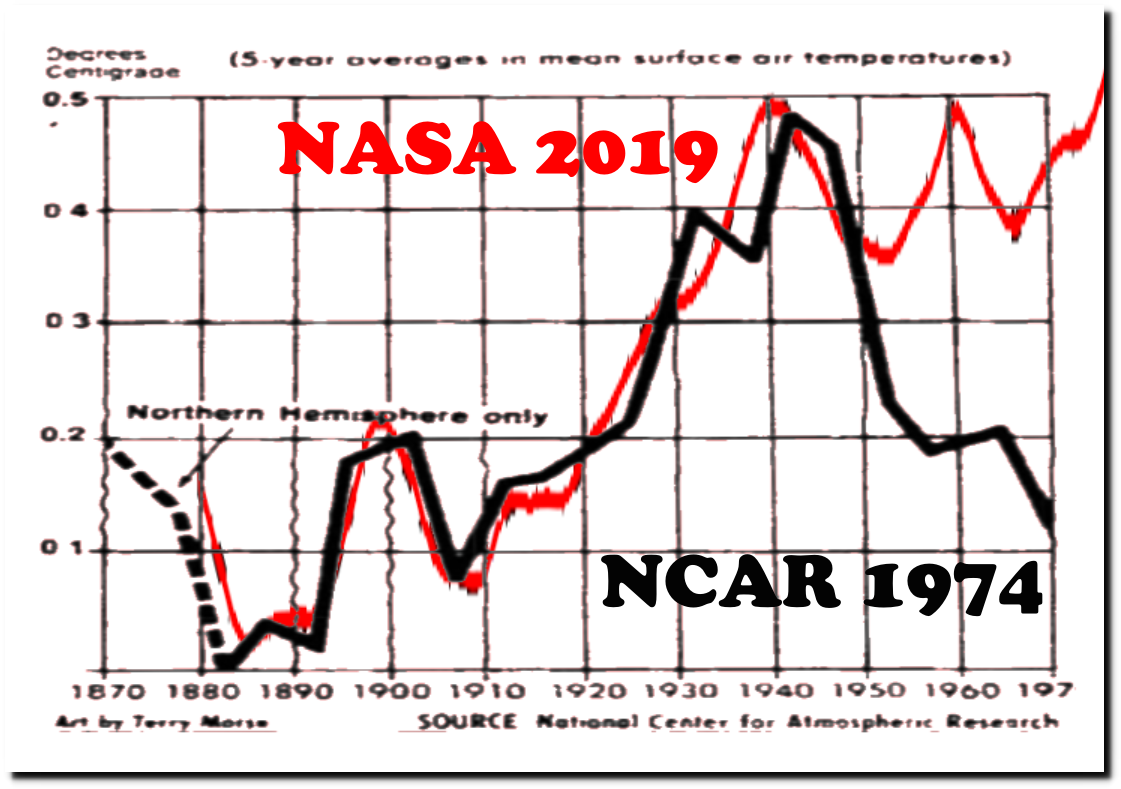
Their graph looks nothing like the 1974 graph from the National Center for Atmospheric Research, which showed a worldwide cooling trend from 1940 to 1970, and no warming from 1870 to 1970.
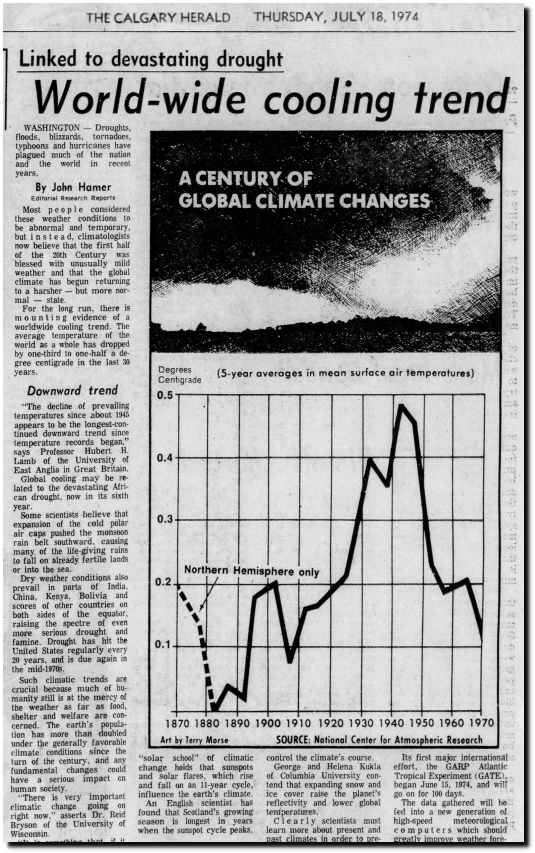
18 Jul 1974, 5 – Calgary Herald at Newspapers.com
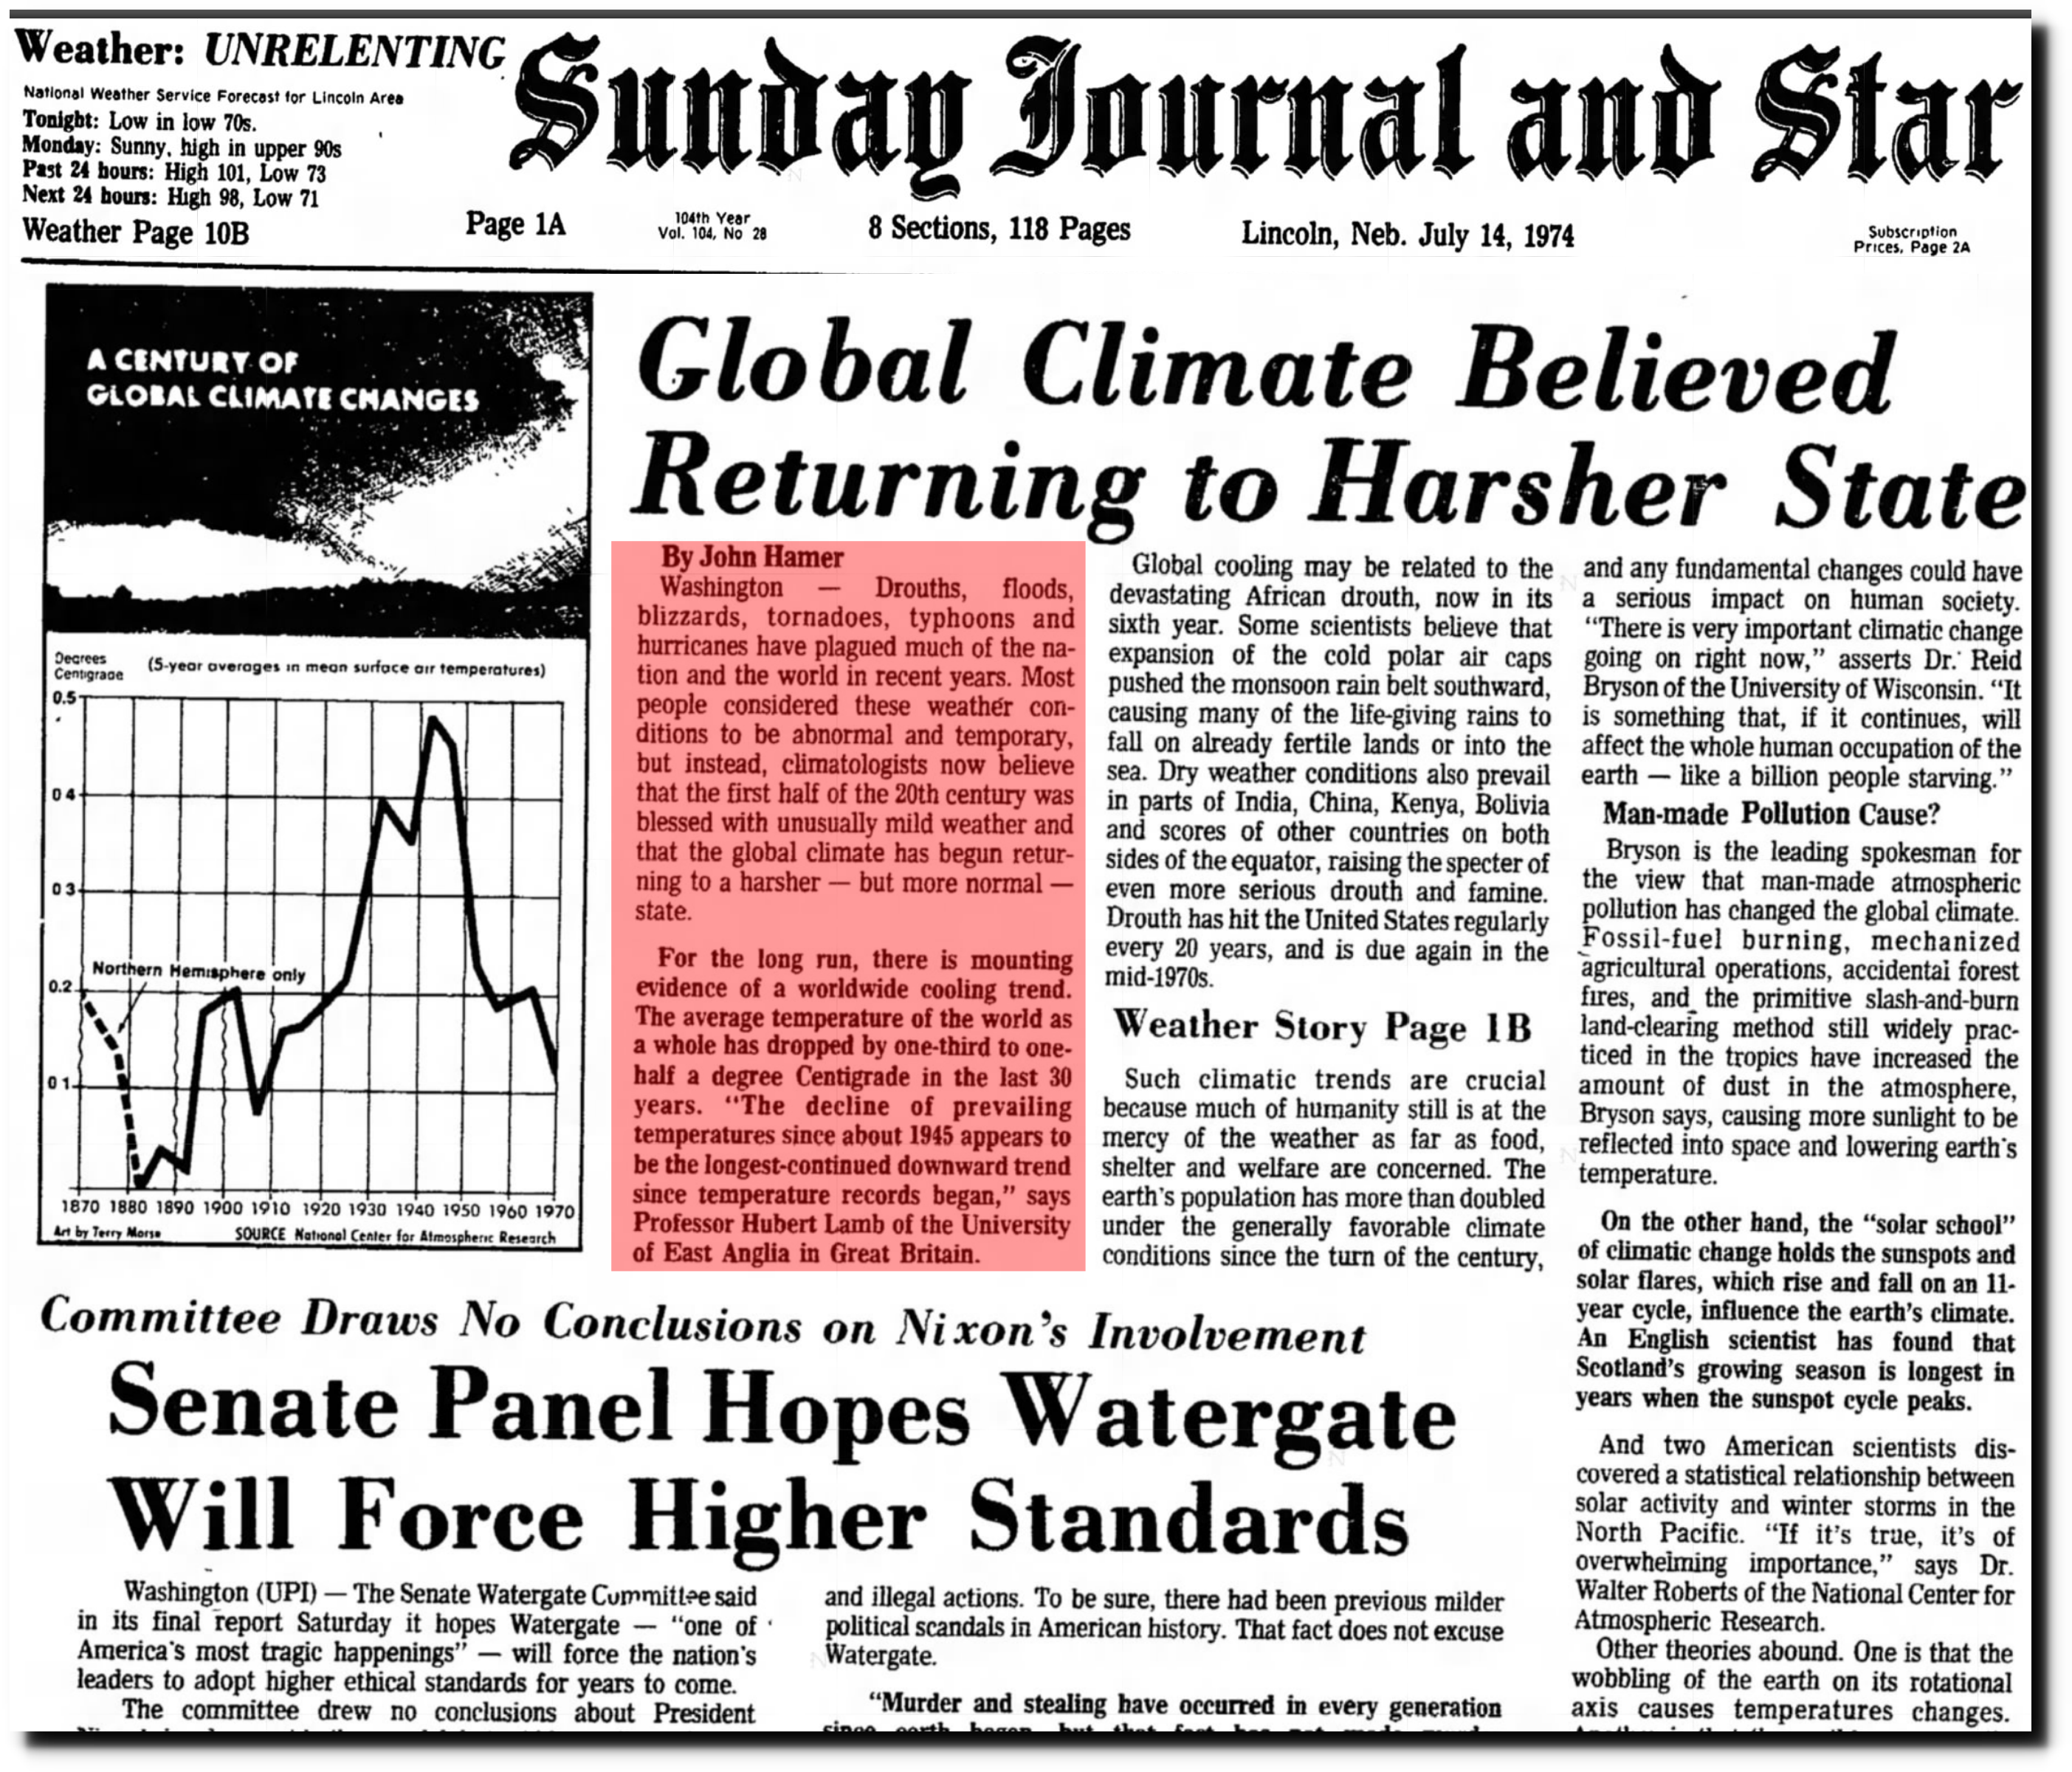
14 Jul 1974, Page 1 – Lincoln Journal Star at Newspapers.com
The National Academy of Sciences reported the same thing.
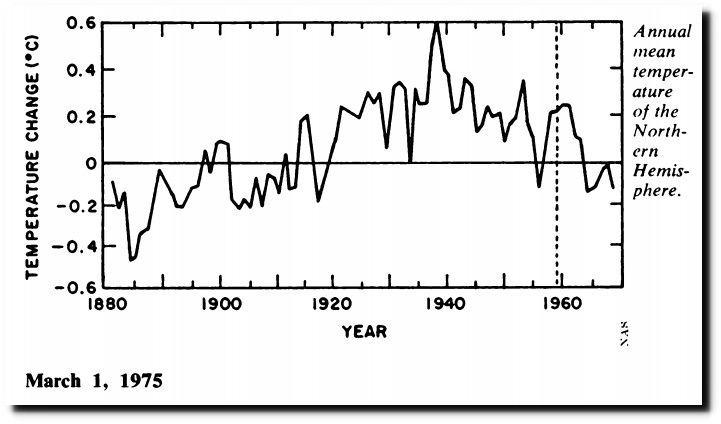
https://www.sciencenews.org/sites/default/files/8983
National Geographic reported the same thing, and pointed out that the early 1880’s were cold because of the eruption of Mt. Krakatoa.
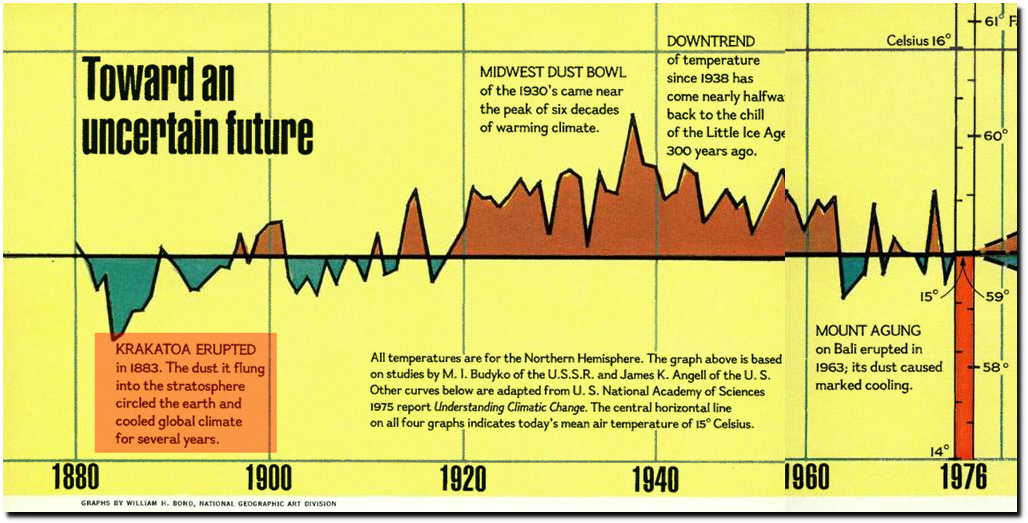
The National Geographic Archive | November 1976 | page 1
The current NASA graph looks nothing like the prior graphs, and has completely erased the post-1940 cooling.

Thirty years ago, Tom Karl (longtime head of NOAA’s National Climatic Data Center) said most global warming occurred before 1919, and that Earth cooled from 1921 to 1979.
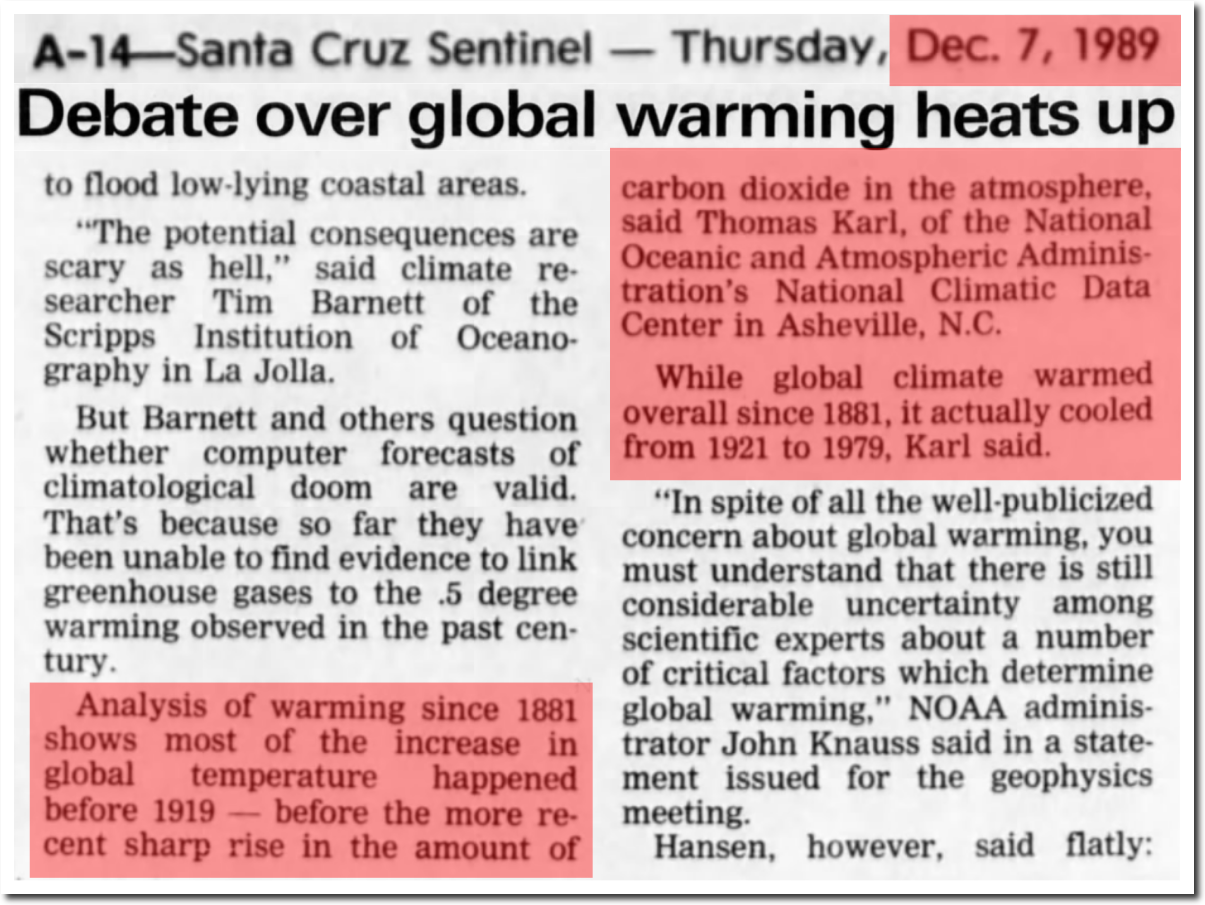
07 Dec 1989, Page 14 – Santa Cruz Sentinel at Newspapers.com
NASA now shows about 0.4C warming from 1921 to 1979.

Over the last two decades, NASA has steadily altered their data, to more than double warming prior to the year 2000.
Data.GISS: GISTEMP HISTORY
I have documented this fraud many times over the past decade, but here is some new information about warm temperatures NASA is hiding prior to the eruption of Krakatoa.
In 2001, NASA included temperature data going back to 1867. It showed no warming from 1867 to 1979, and showed 1878 as being the warmest year prior to 1980
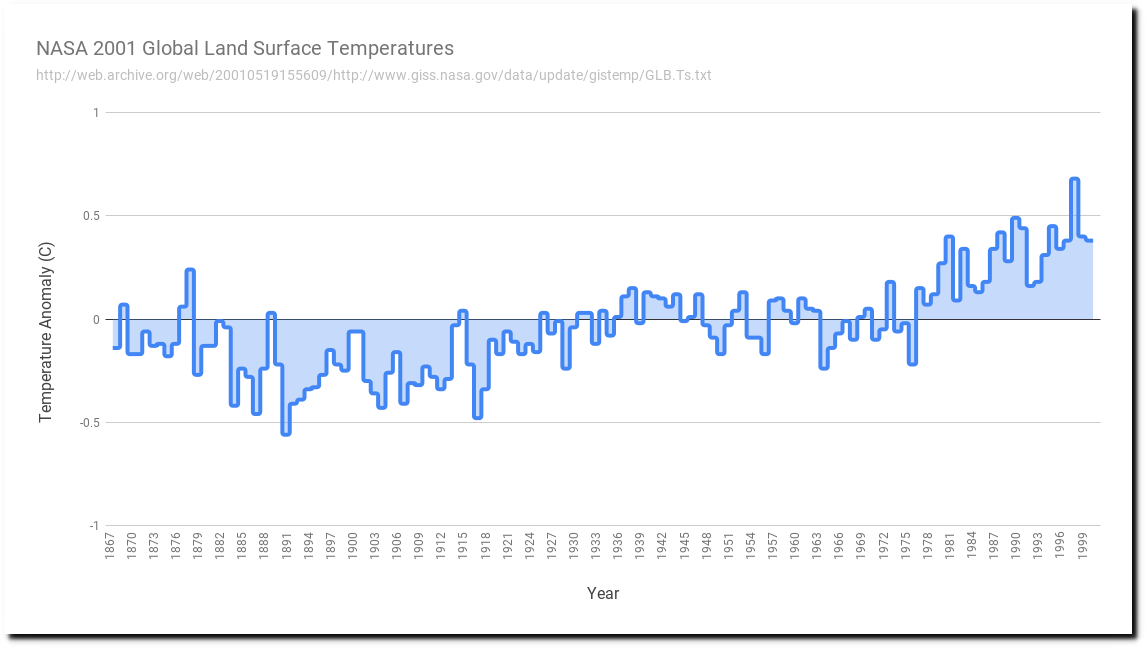
The first four months of the year showed little or no warming, with March 1878 being the most anomalously warm month on record.
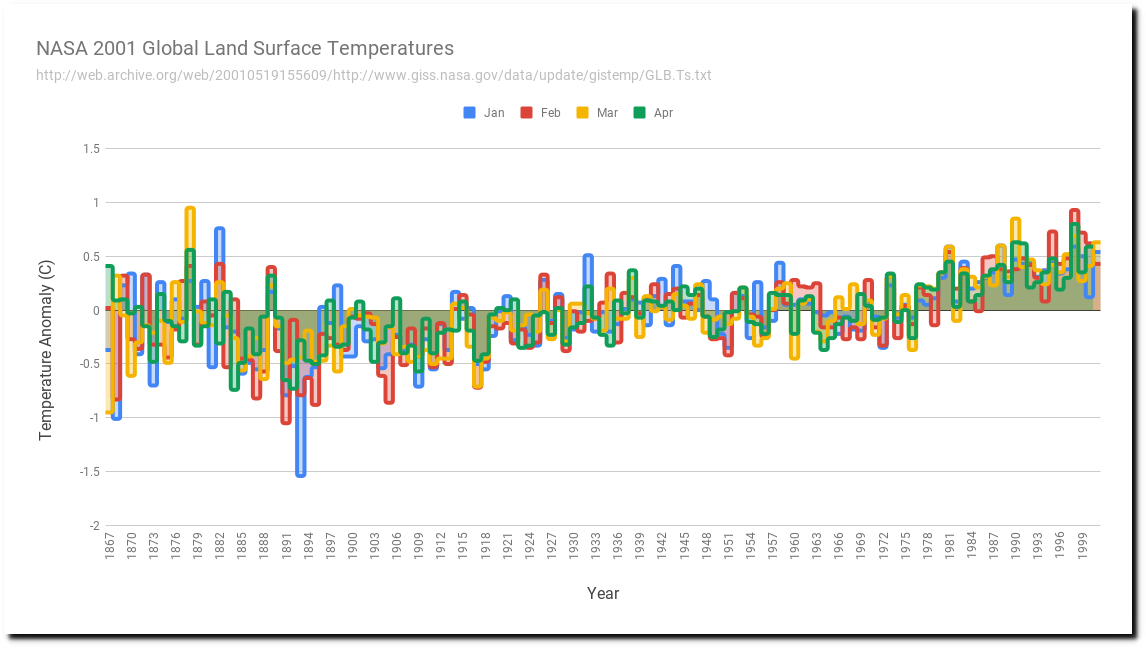
NASA 2001
After the year 2001, NASA apparently made the decision to hide the hot years prior to 1880, and start their graphs during the cold period around the time Krakatoa erupted.

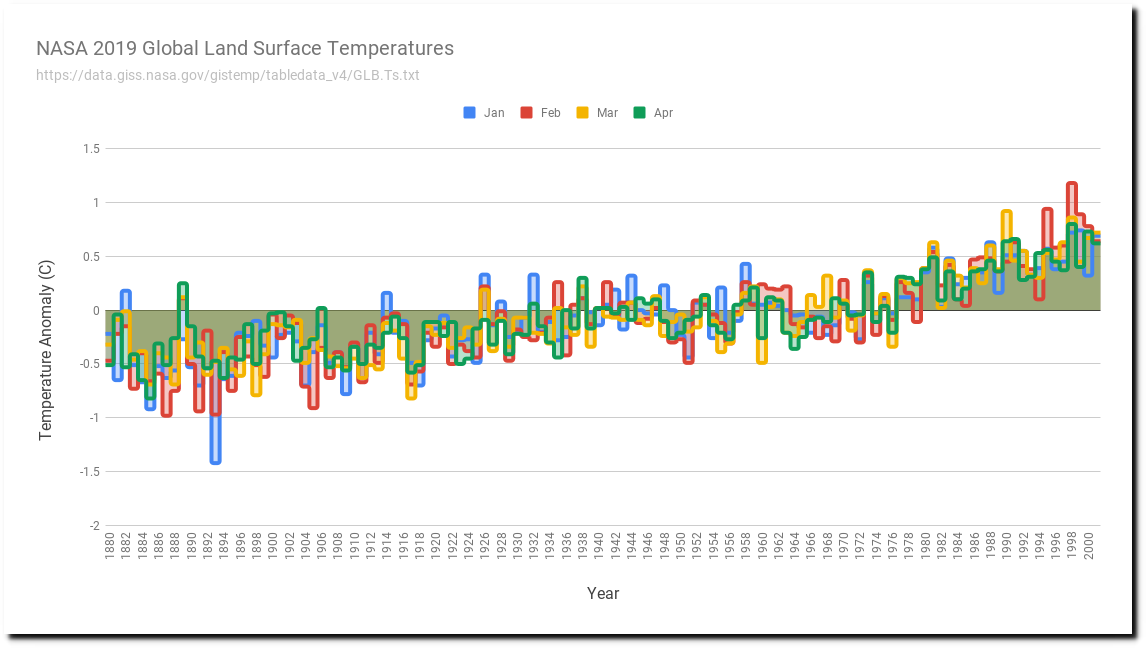
https://data.giss.nasa.gov/gistemp/tabledata_v4/GLB.Ts.txt
1878 was an incredibly warm year, and is now being hidden by NASA. There was no winter in Minnesota that year.
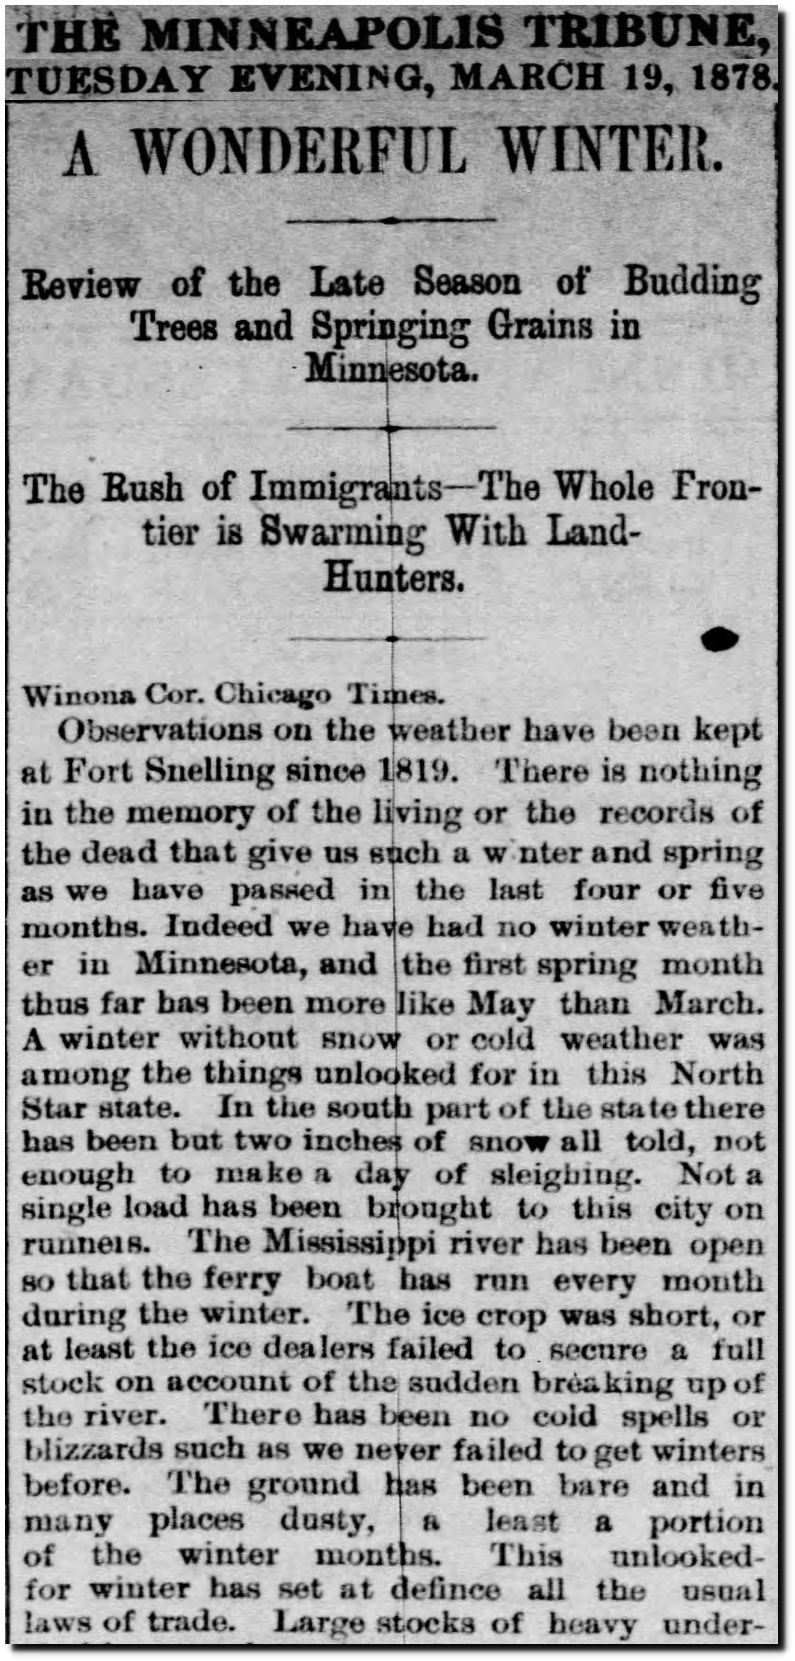
19 Mar 1878, Page 2 – Star Tribune at Newspapers.com
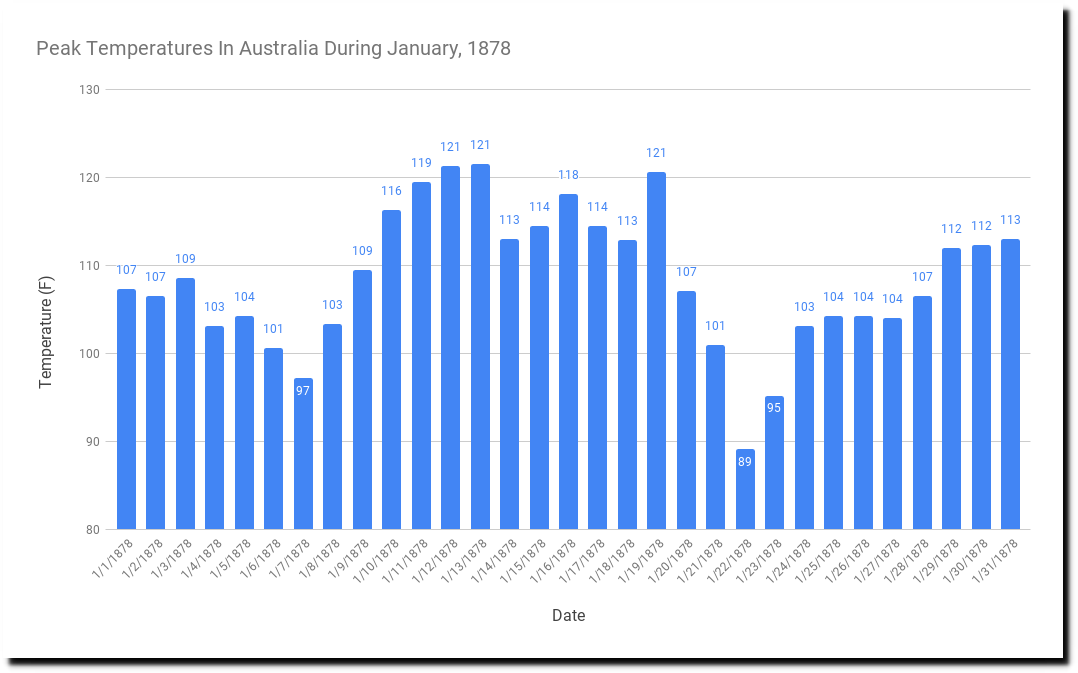
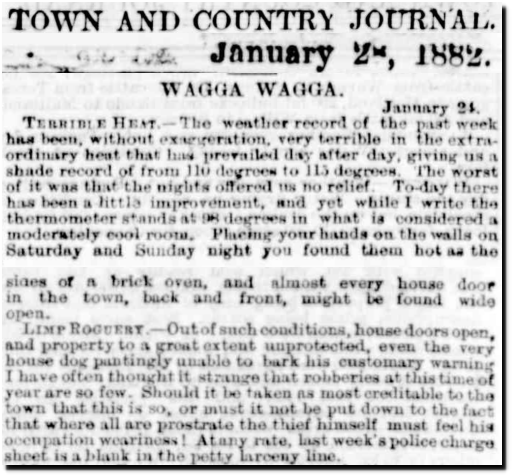
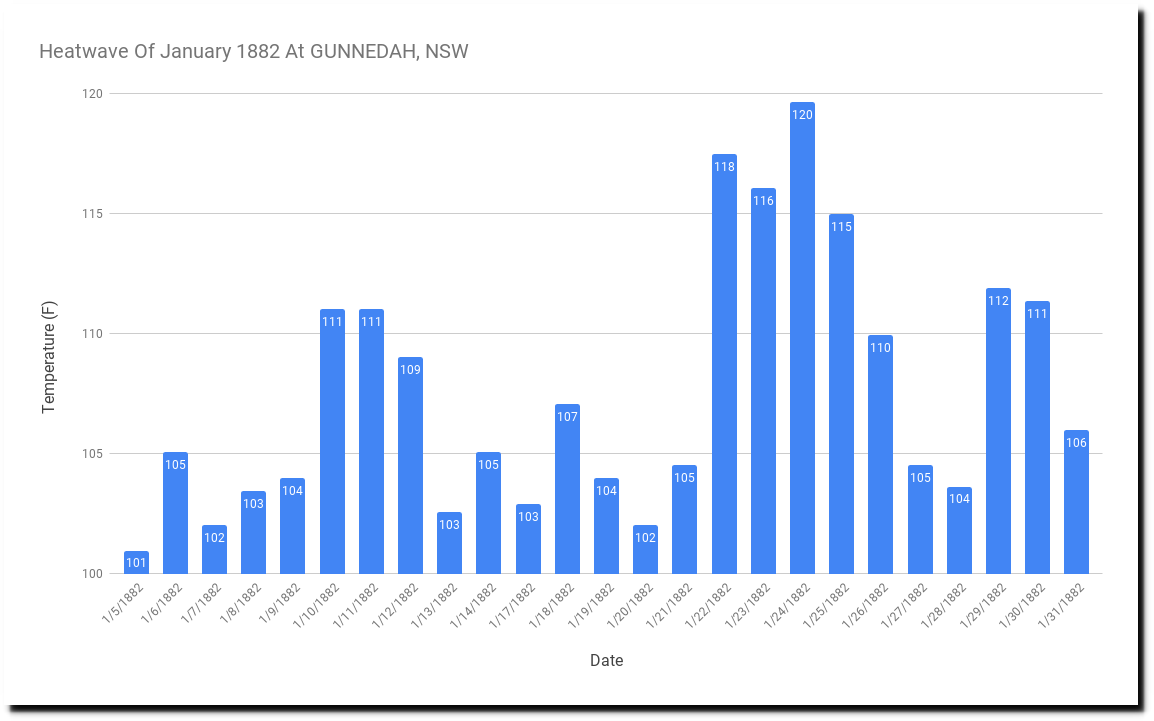
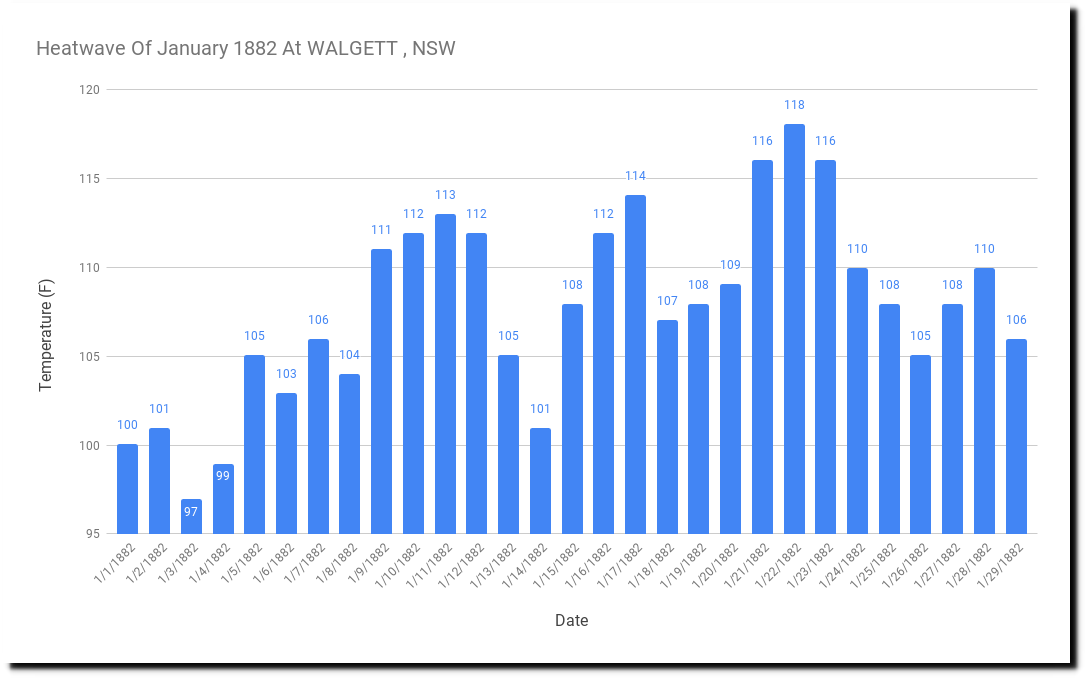
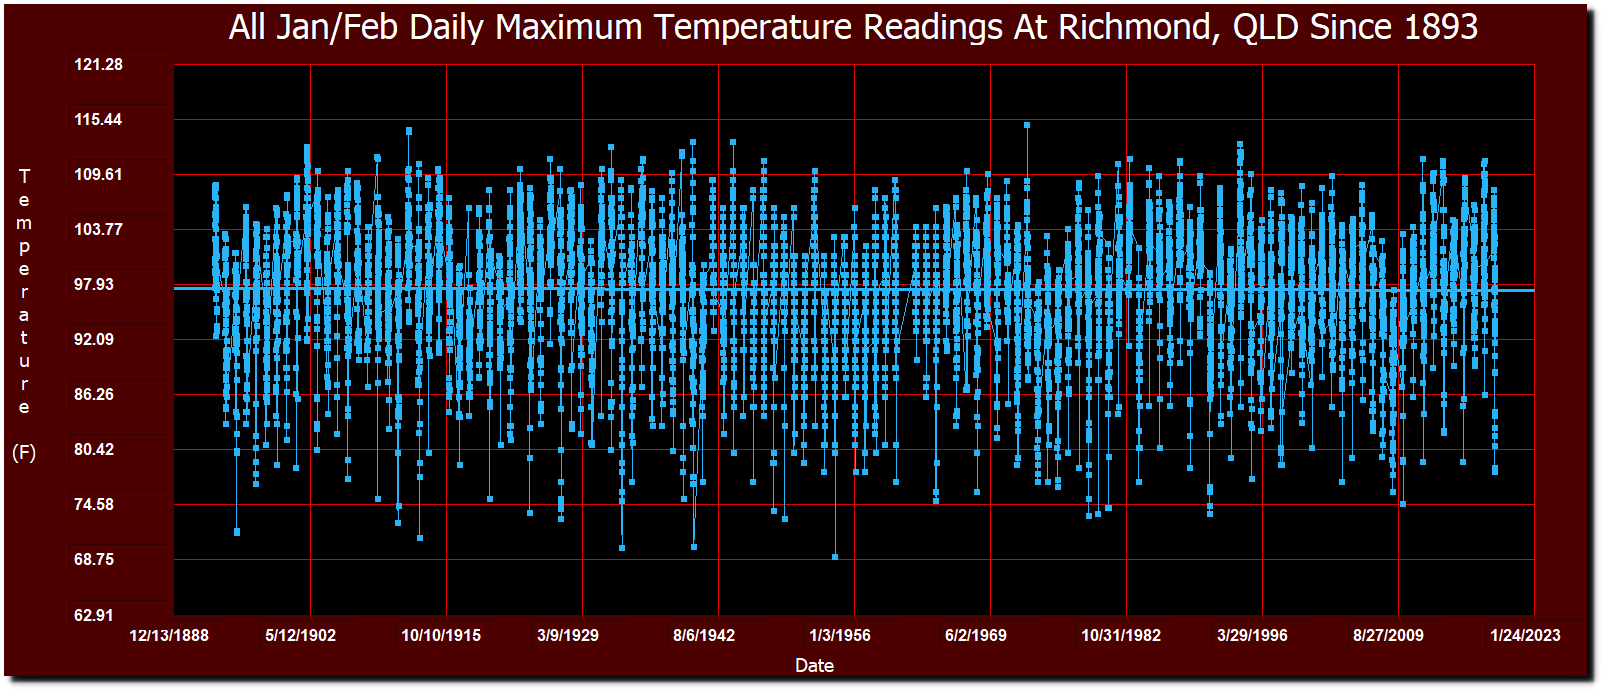
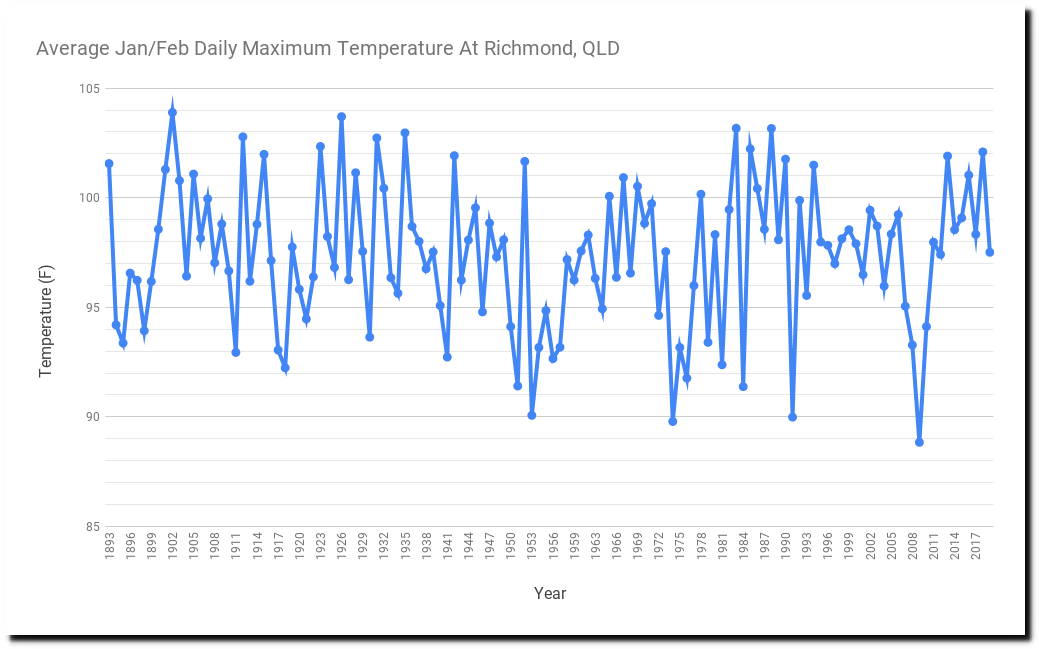
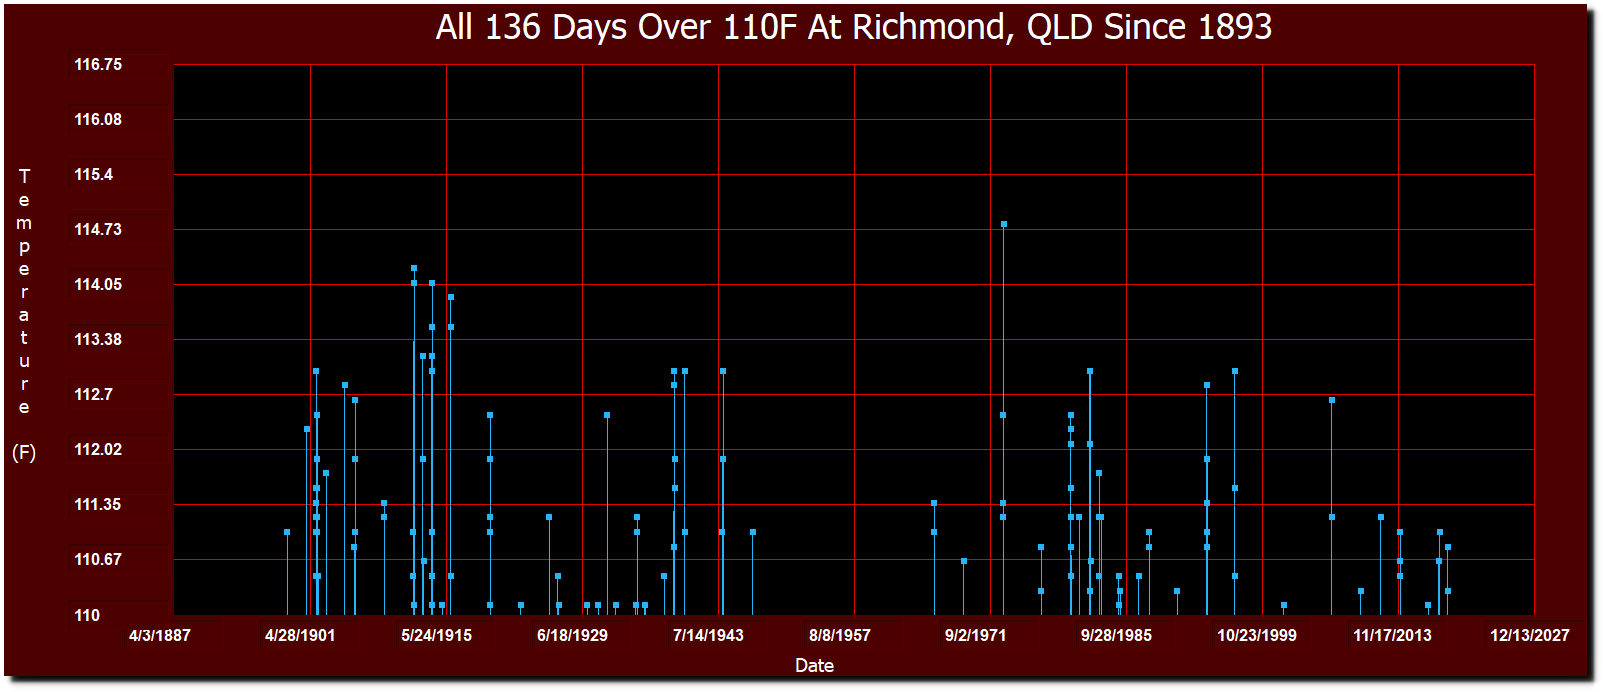
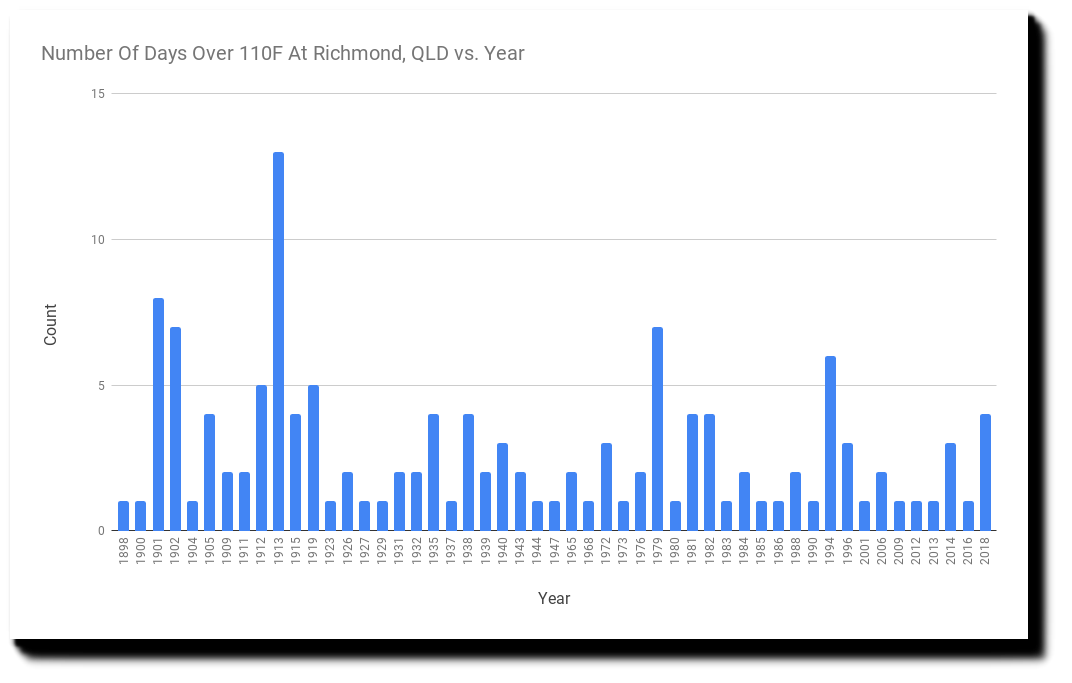
January/February, 1878 may have also been the hottest on record in Australia.
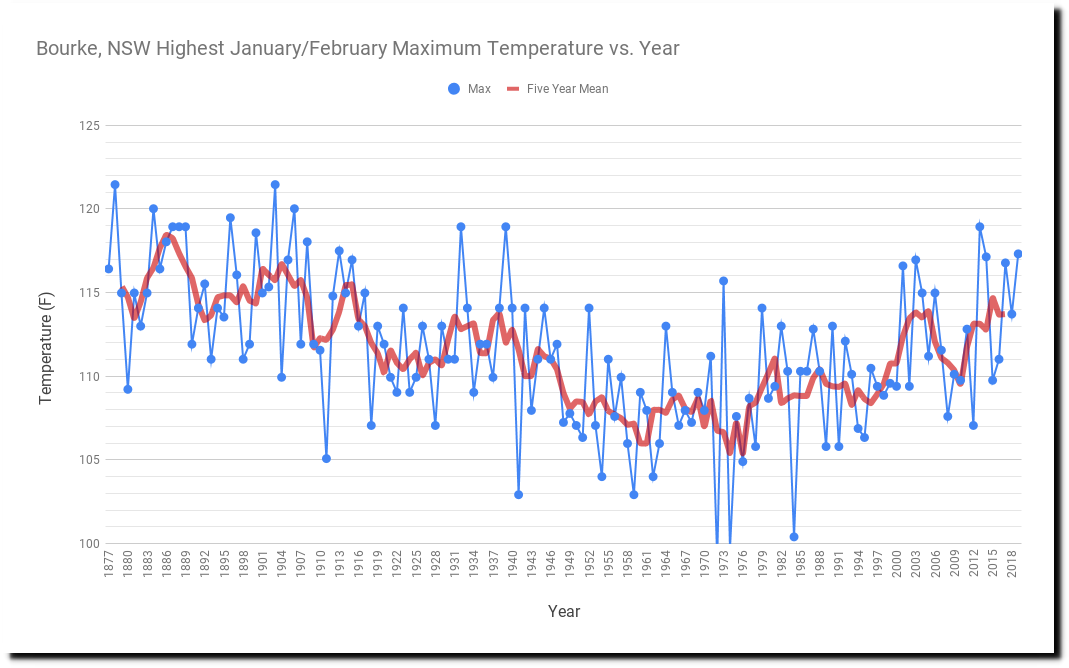
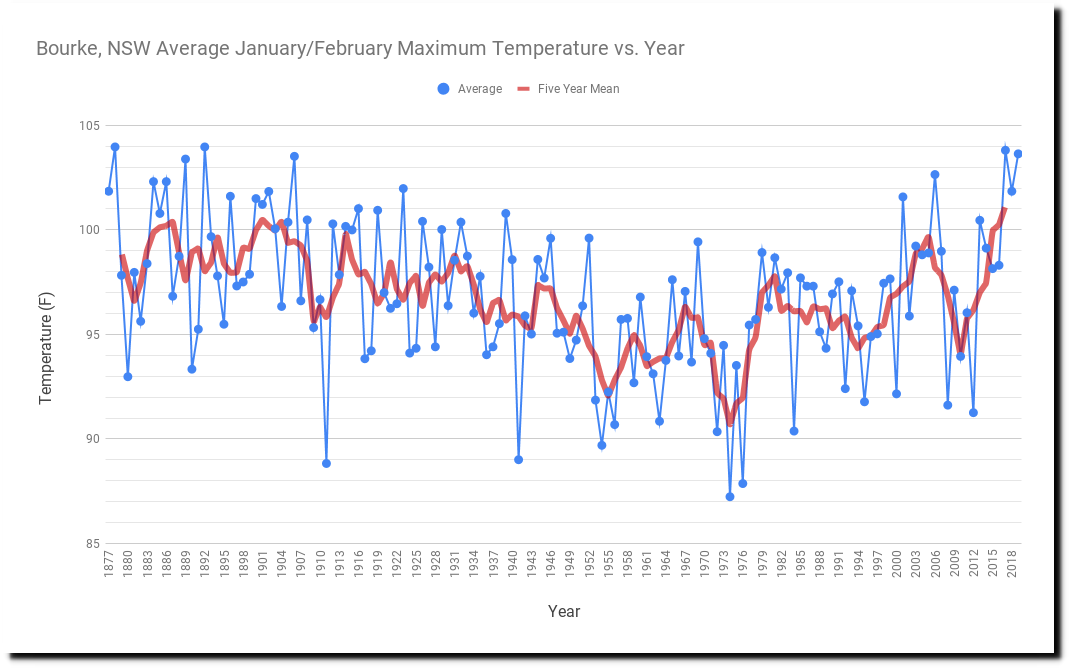
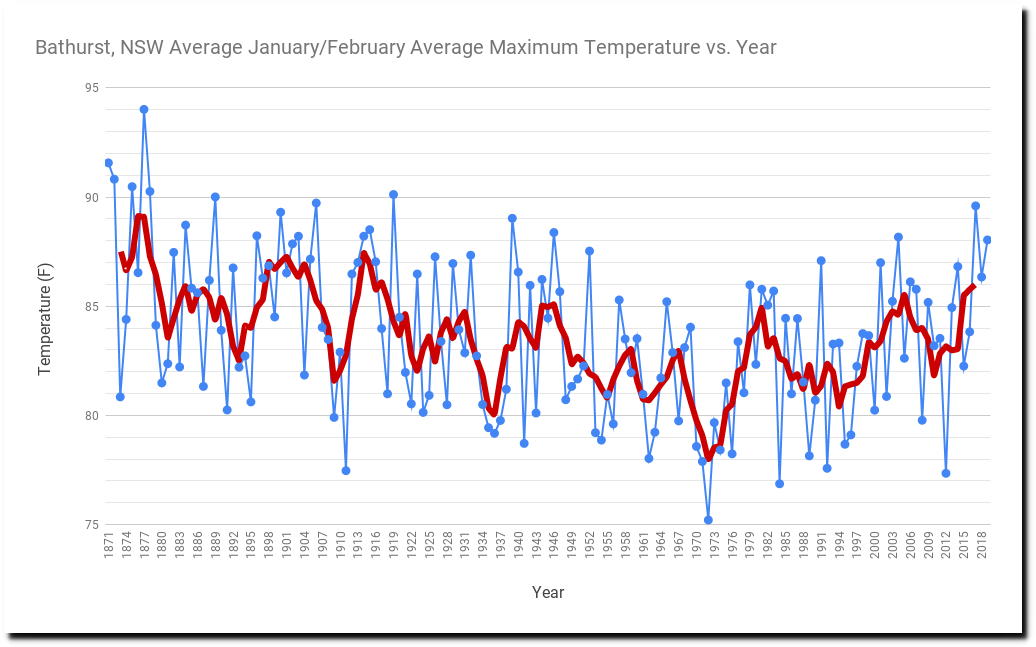
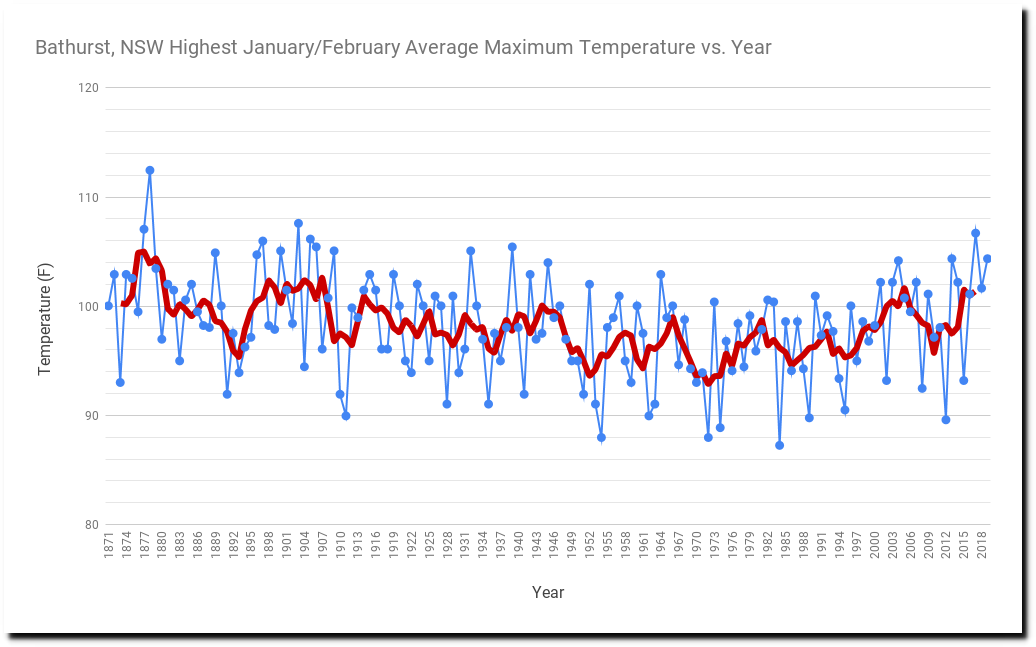
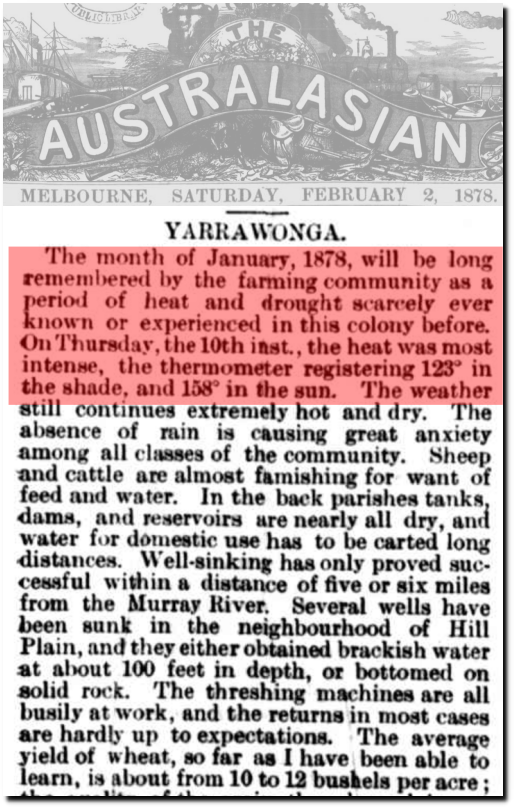
02 Feb 1878 – YARRAWONGA. – Trove
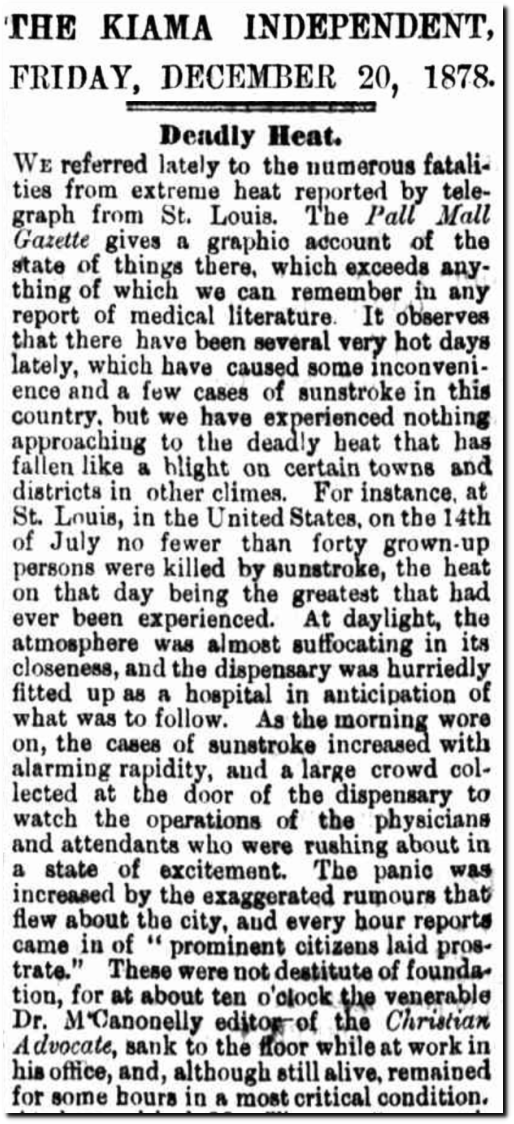
20 Dec 1878 – Deadly Heat. – Trove
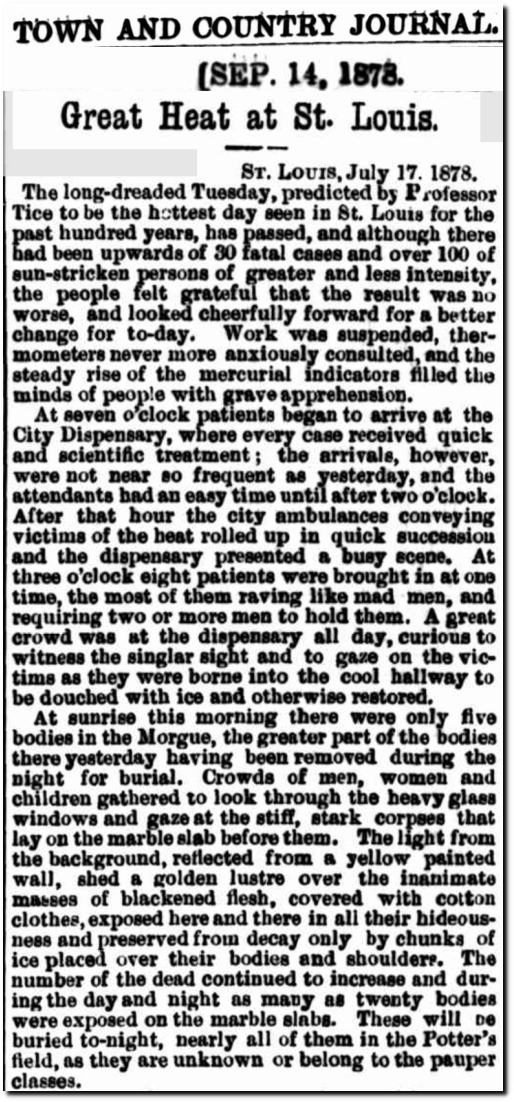
14 Sep 1878 – Great Heat at St. Louis. – Trove

23 Feb 1878 – BRISBANE. – Trove
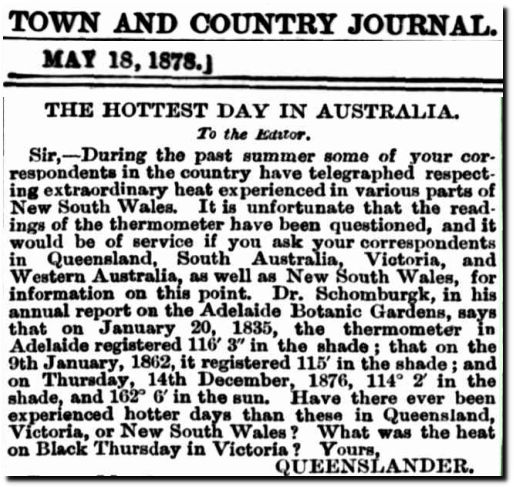
18 May 1878 – THE HOTTEST DAY IN AUSTRALIA. – Trove
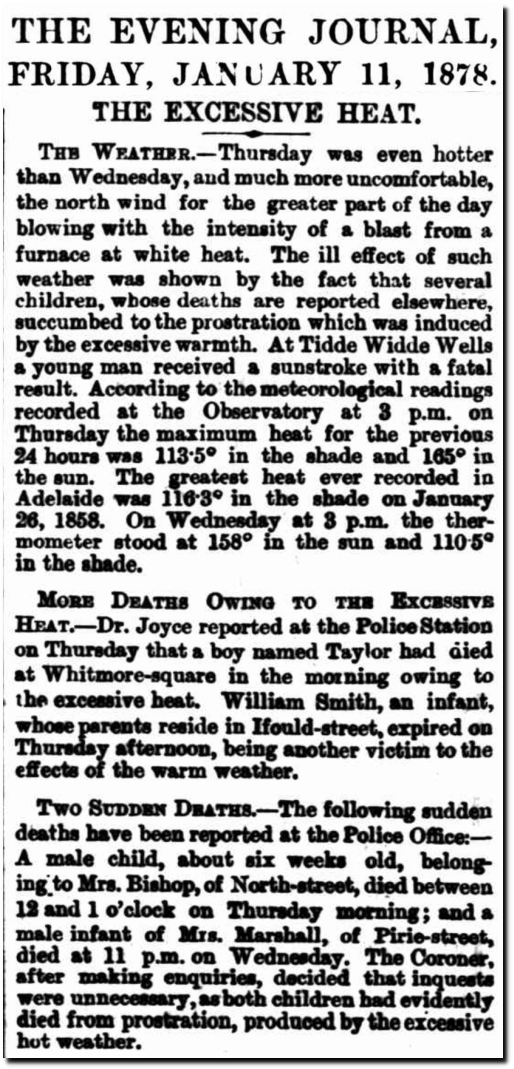
11 Jan 1878 – THE EXCESSIVE HEAT. – Trove
There was something exceptional going on with the weather that year, around the world. Instead of trying to understand it, NASA chose to hide it
After massively altering the data over and over again, hiding the record heat of 1878, starting their graphs around the time of a volcanic eruption, and pretending that the 1974 NCAR, National Academy of Sciences and National Geographic graphs don’t exist – NASA claims that everyone precisely agrees.
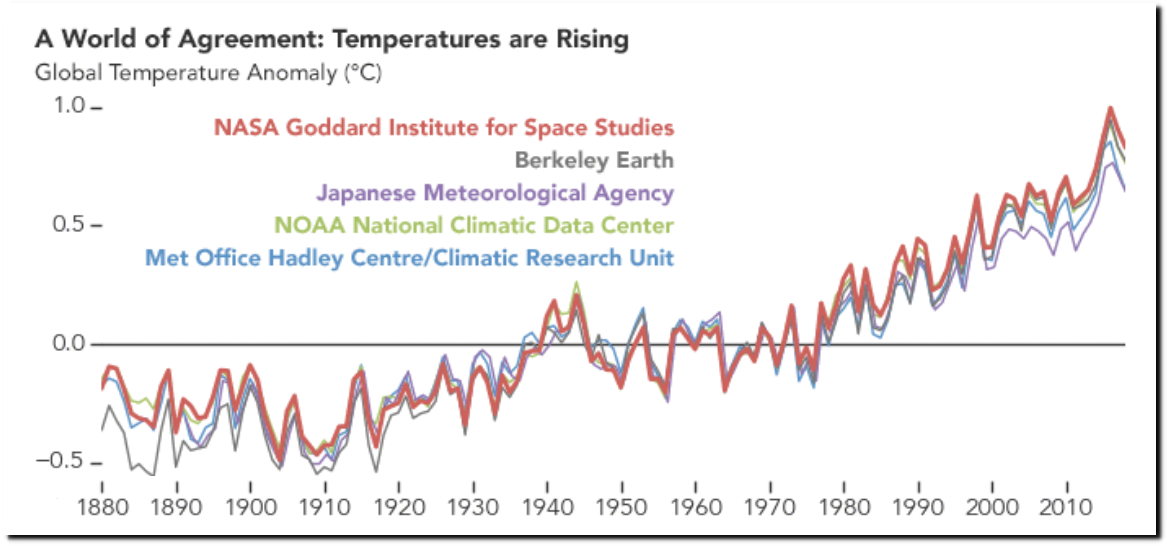
Scientific Consensus | Facts – Climate Change: Vital Signs of the Planet
The boldness and arrogance of these fraudsters seems to know no bounds, because they know that the press and politicians are afraid to confront them – even though they do it right out in the open.

di2.nu/foia/1254108338.txt


