Climate scientists say sea level rise rates have increased from 1.4 mm/year to more than 3 mm/year, and that it is the fastest rate in 2,800 years.
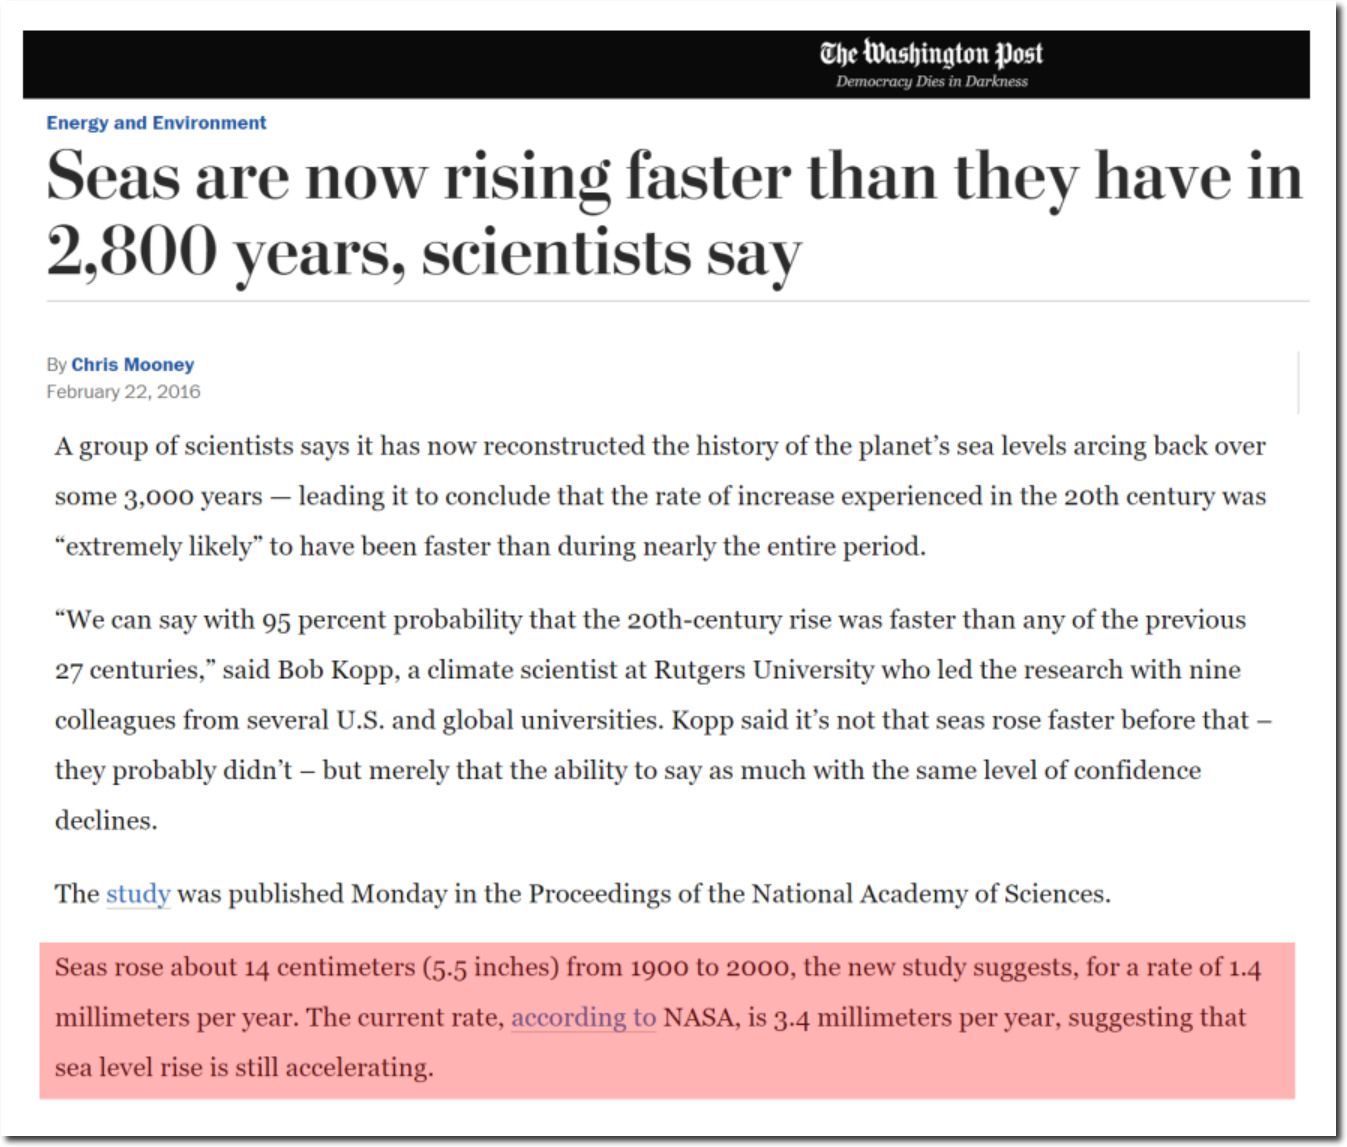
Seas are now rising faster than they have in 2,800 years, scientists say – The Washington Post
This is in direct contradiction to the 1990 IPCC report, which said there was no convincing evidence of an acceleration of sea level rise during the 20th century.
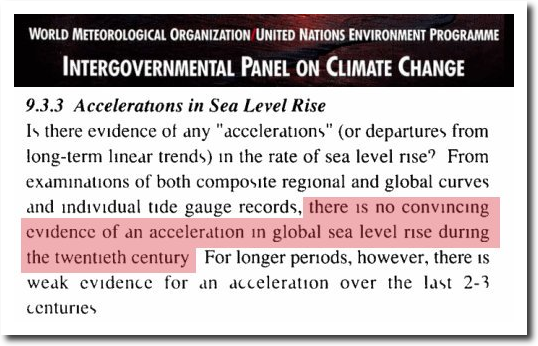
1990 IPCC Report
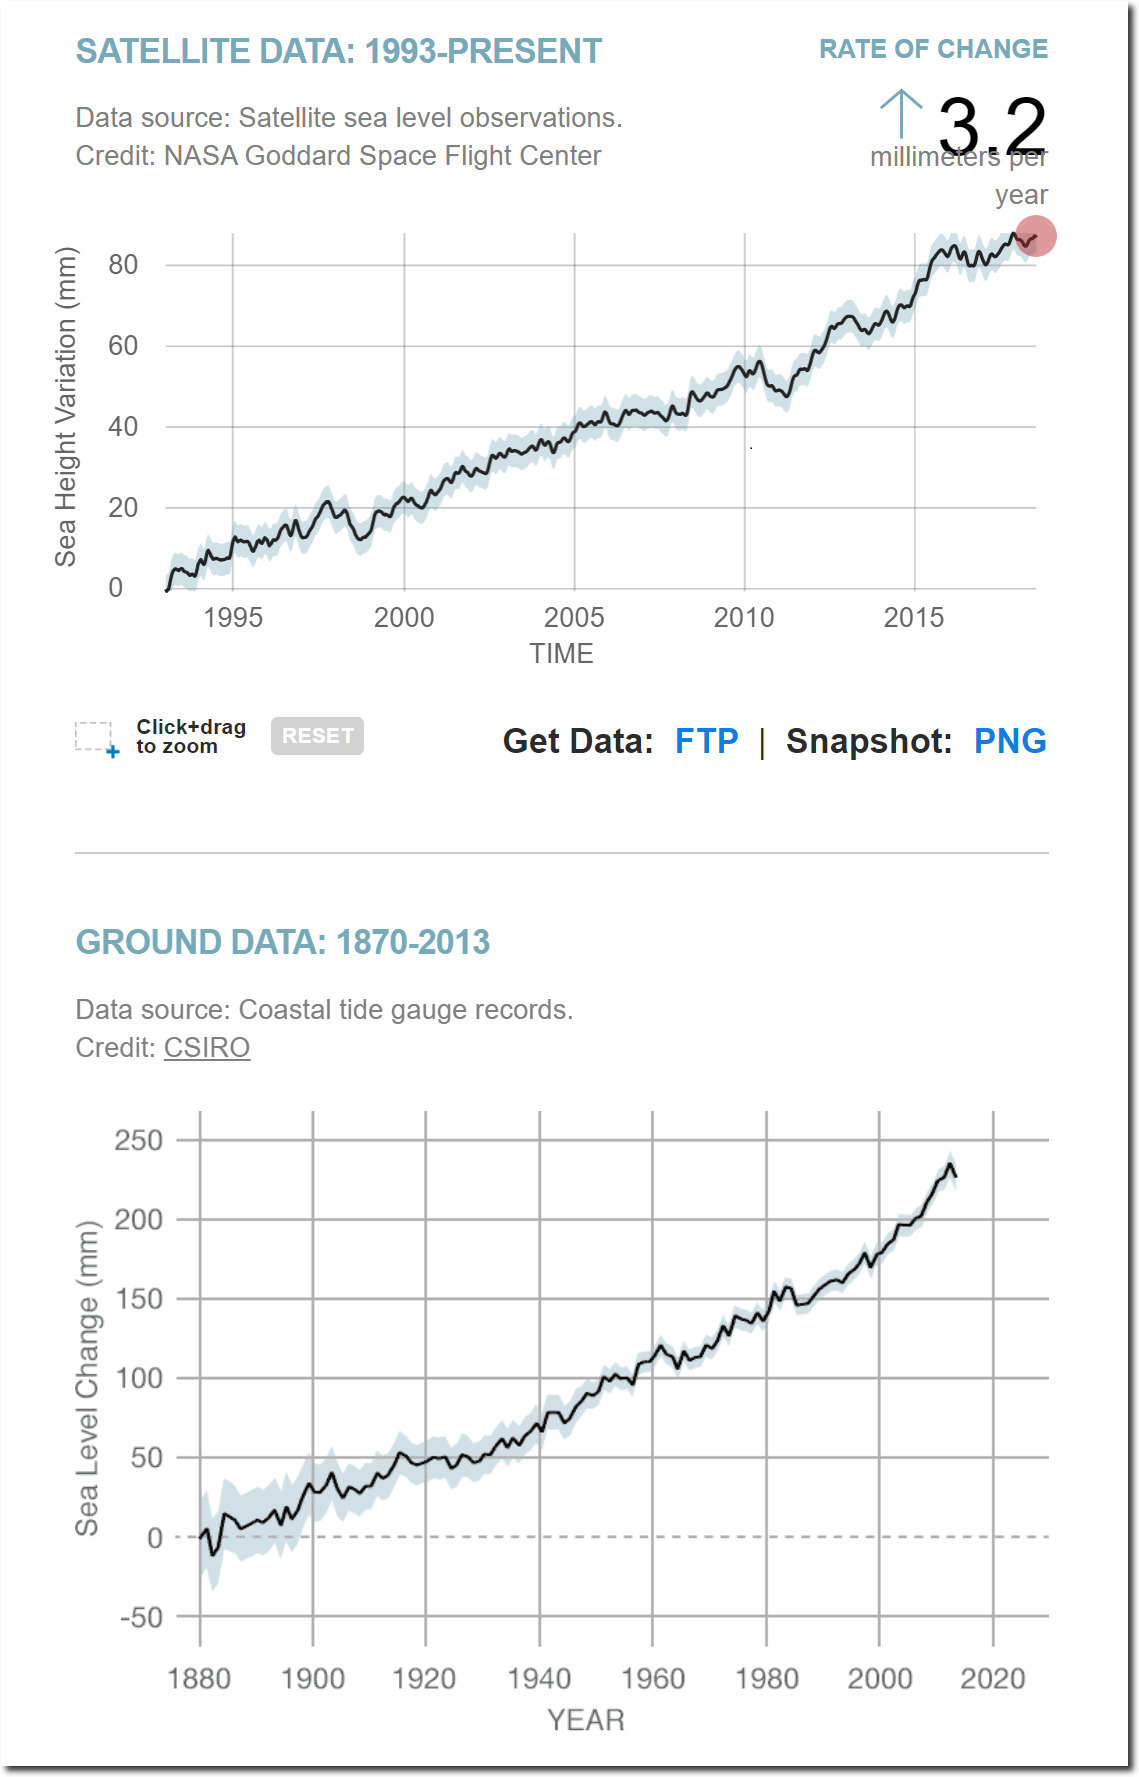
So how did this magical doubling of sea level rise rates occur? Prior to 1993, tide gauges were exclusively used to measure sea level. Since then, satellite data has been used to generate the new inflated numbers.
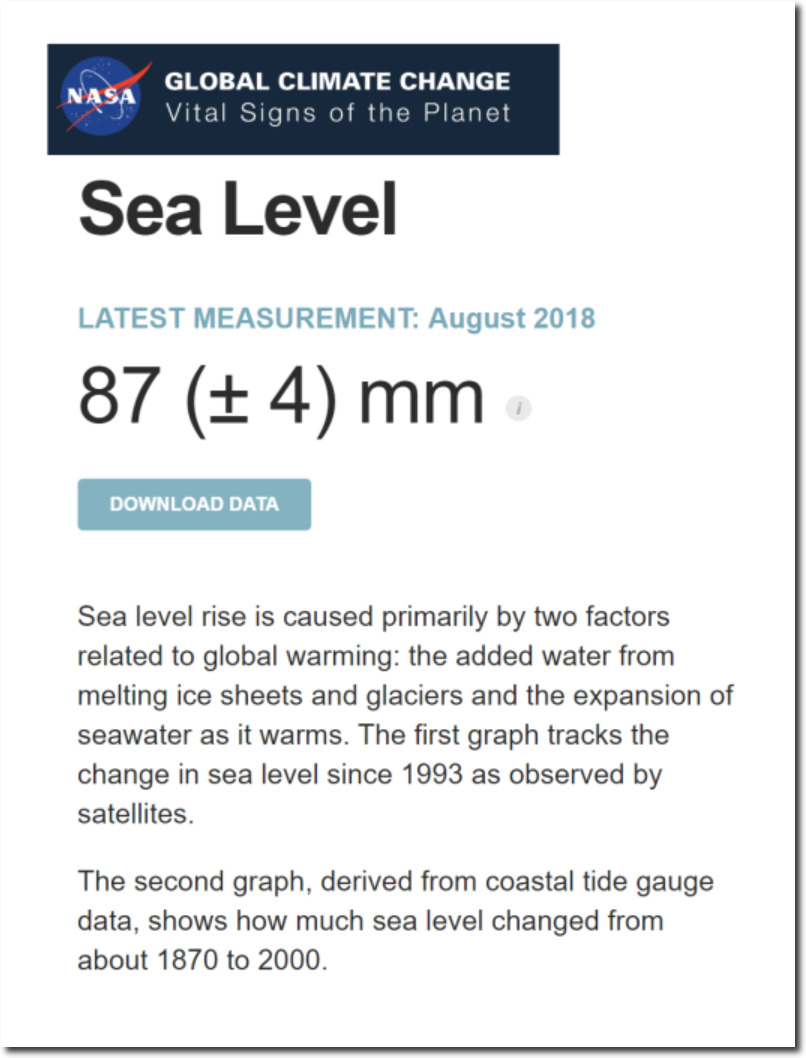
Sea Level | Vital Signs – Climate Change: Vital Signs of the Planet
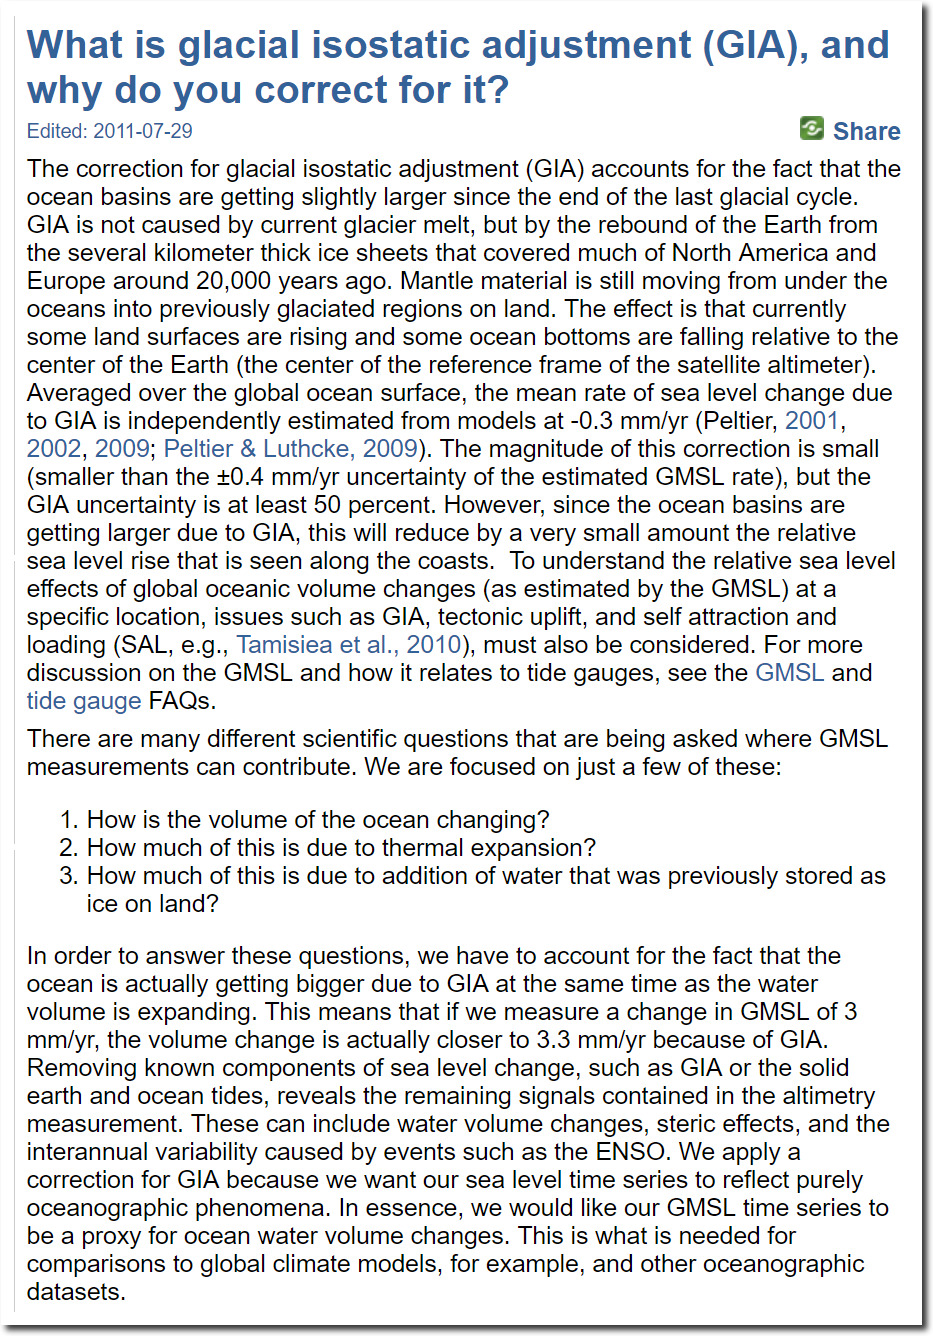
Satellites have lots of issues with taking mm level sea level measurements. The ocean surface is very rough, satellite orbits decay, and satellite measurements frequently have an error nearly as large as the trend.
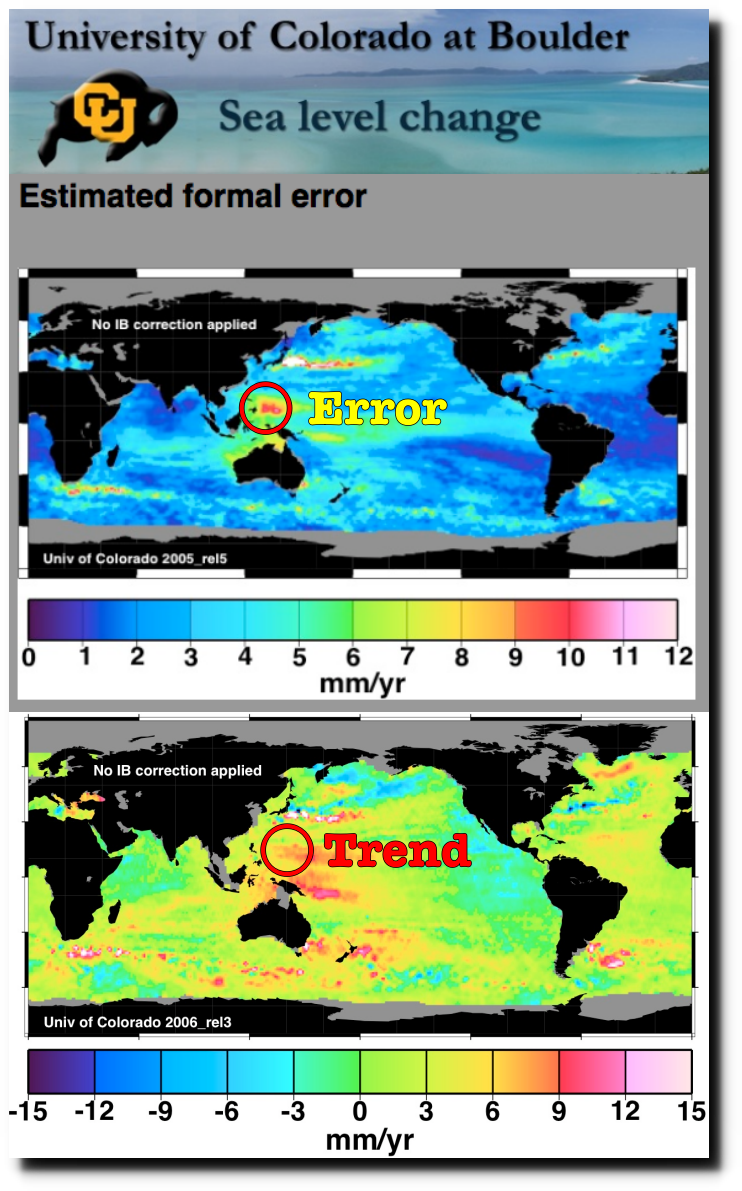
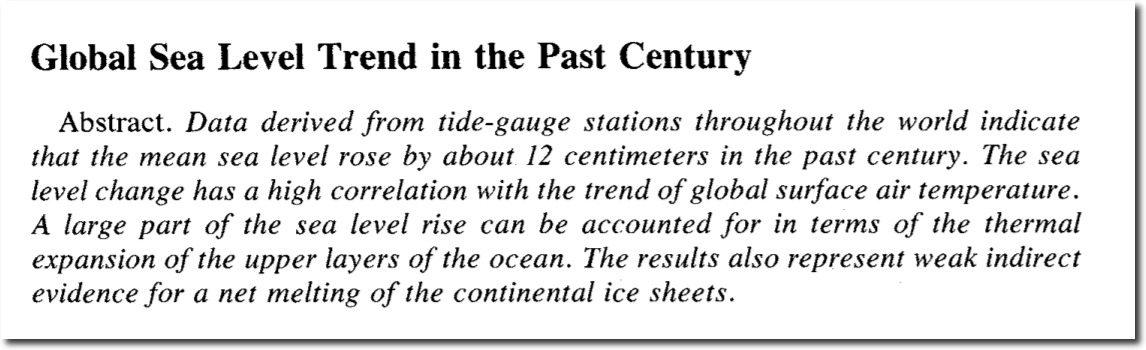
Global mean sea level results
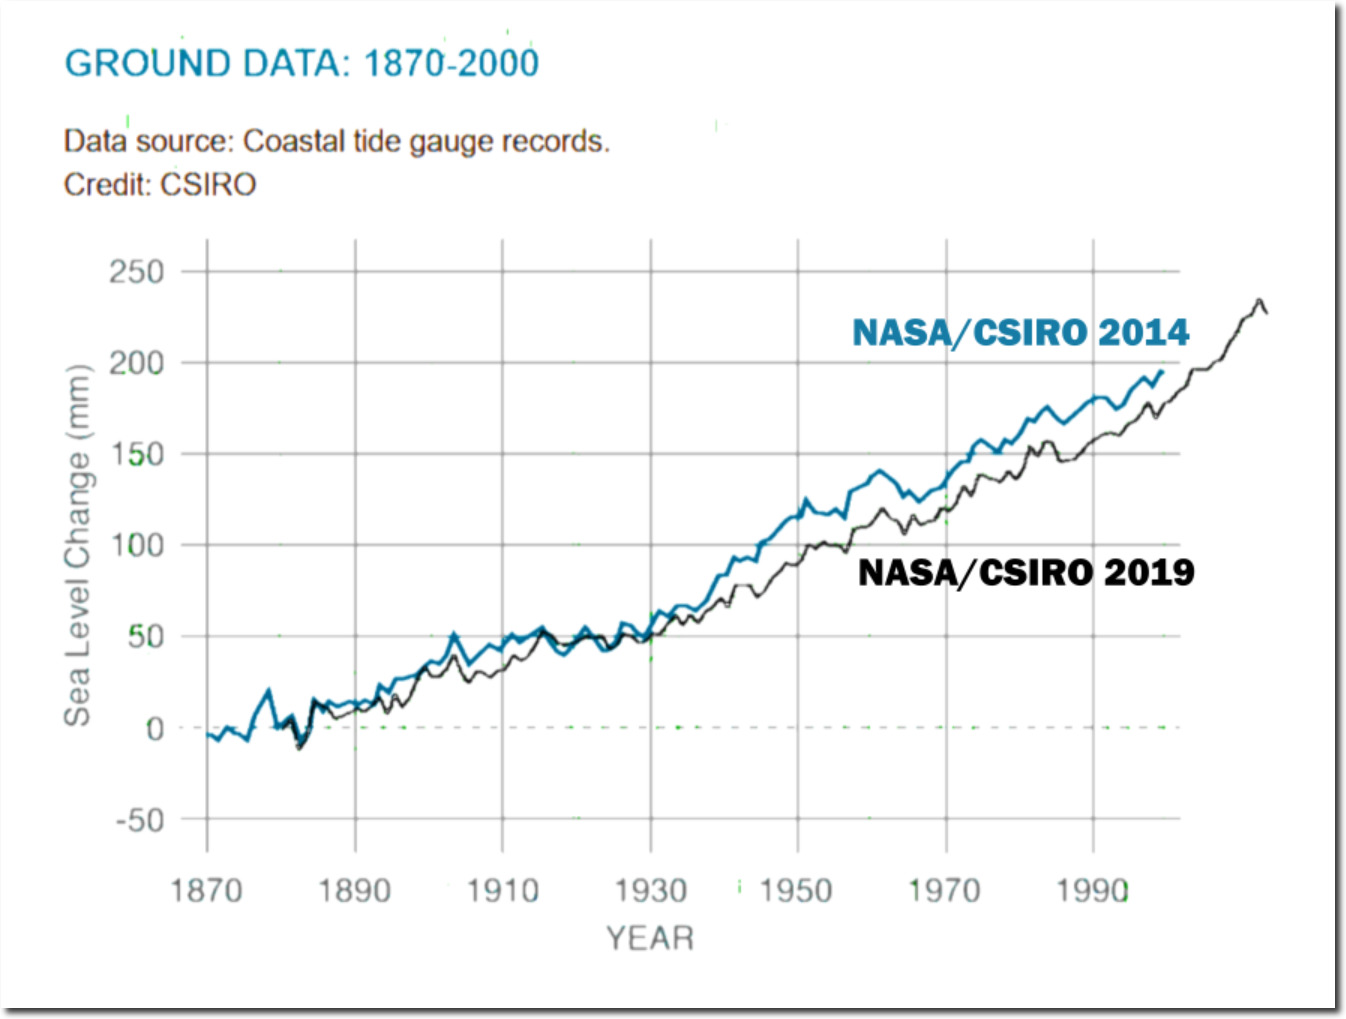
Even worse, they add in 0.3 mm/year for a global isostatic adjustment (GIA) to the satellite record. This is done because the sea floor is sinking in response to glacial rebound after the end of the last ice age.
What is glacial isostatic adjustment (GIA), and why do you correct for it? | CU Sea Level Research Group
GIA would be relevant if you were calculating properties like ocean depth or ocean volume which can’t be directly measured, but it has no validity for sea level – which is directly measured and is essentially the distance from the center of the earth. The only justification to make any adjustment to sea level would be to account for measurement error – and GIA has nothing to do with measurement error. A sinking ocean floor lowers sea level, not raises it. And if they are going to use GIA, they would need to add it to the tide gauge data too. Using it only for the satellite data is both junk science and fraudulent.
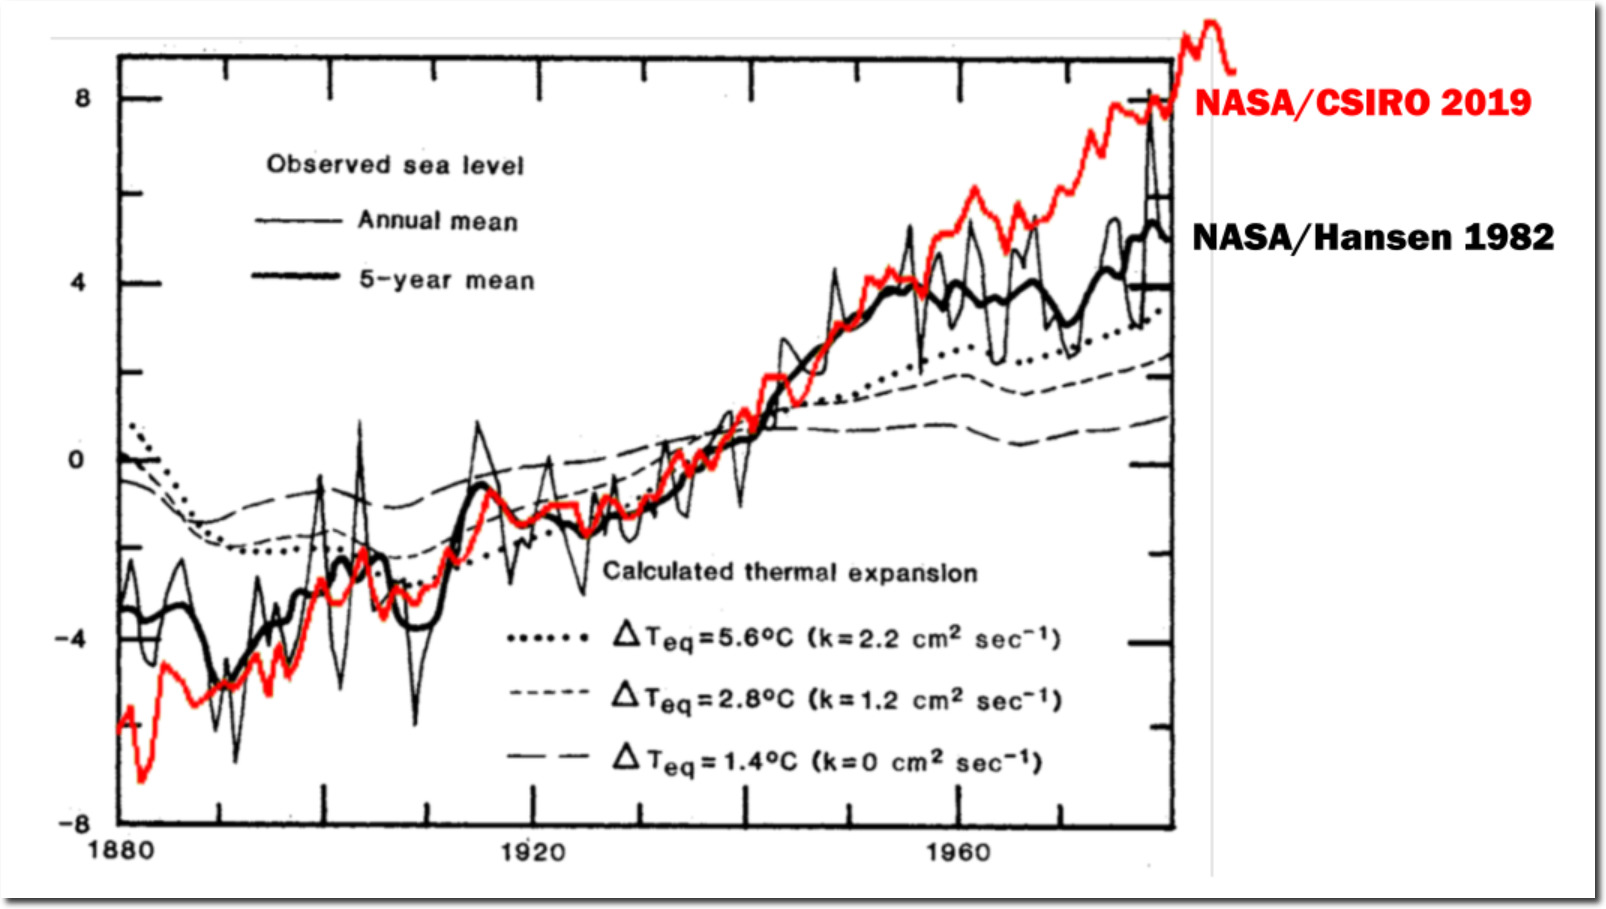
Additional fraud has been introduced by altering the tide gauge data. Over the past five years, NASA has lowered 1930-2000 sea level rise rates, and then introduced a post-1993 hockey stick at the end. This makes it look like sea level is rising faster now.
2014 2019
But the tide gauge data tampering story gets worse. NASA has massively altered their tide gauge data over the past 40 years. In 1982, James Hansen showed sea level rise rates dropping close to zero after the mid-1950s. Their current graph shows acceleration after 1940.
1982_Gornitz_go05100g.pdf
Sea level rose quickly during the 1940s. Glaciers were melting at an astonishing rate, and climate experts were worried the melting ice was going to drown seaports.
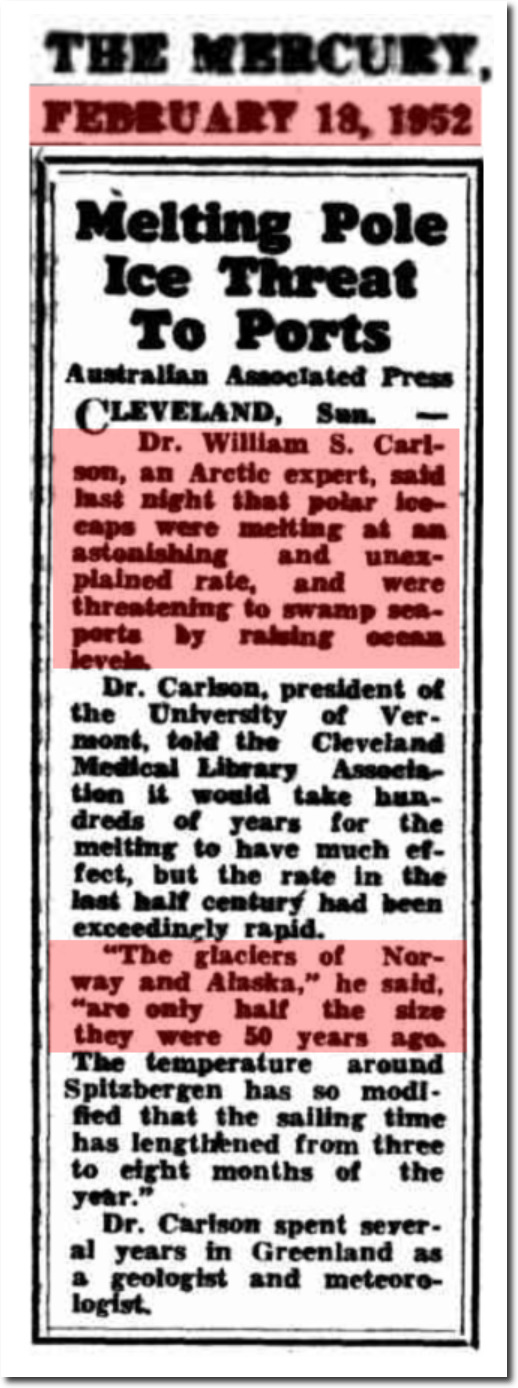
18 Feb 1952 – Melting Pole Ice Threat To Ports – Trove
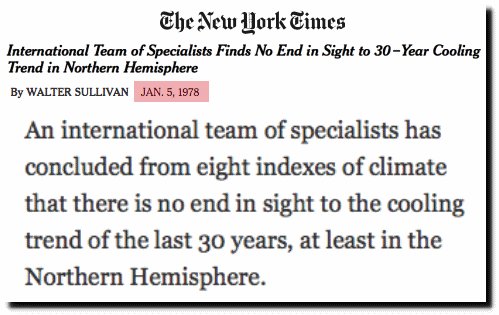
But by 1961, there was unanimous consensus Earth was cooling. There was a sharp cooling during the 1960s and 1970s.

January 30, 1961 – NYTimes
Which led climate scientists to forecast a new ice age in 1972.
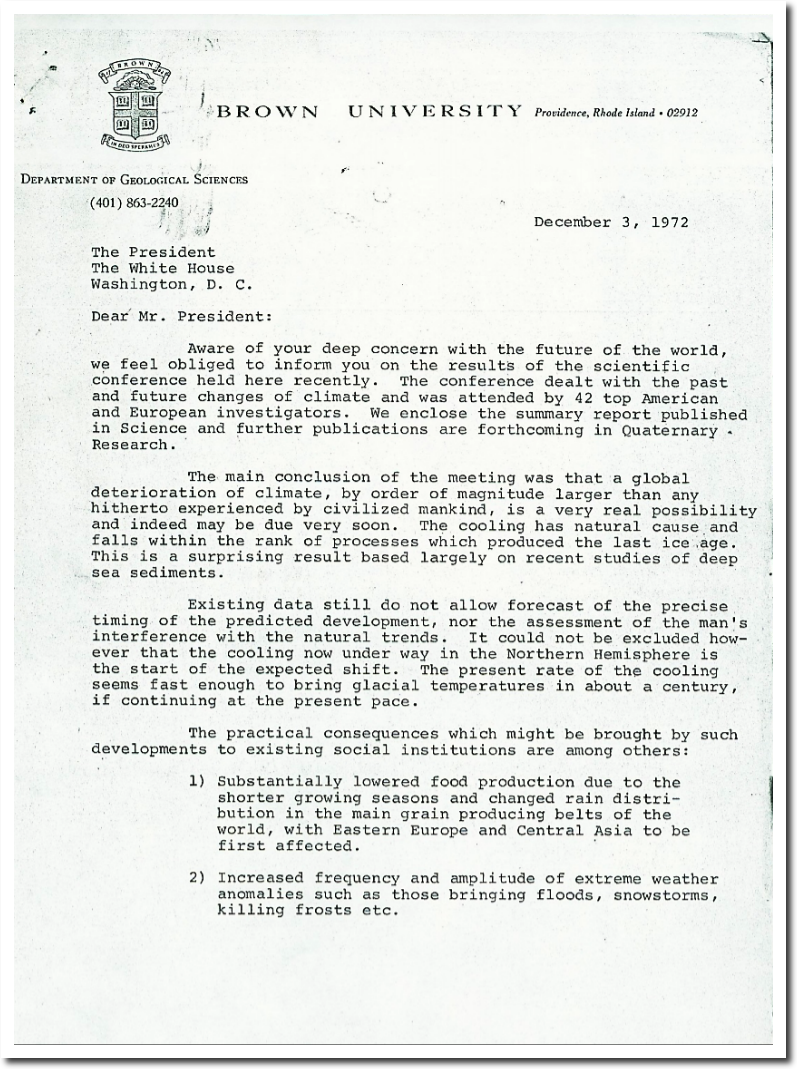
THE ROLE OF NOAA’S CLIMATE PREDICTION CENTER IN THE DEVELOPMENT OF CLIMATE SERVICES
The sea level rise slowdown after 1955 was clearly documented by NASA.
And even in 1982 they were doing junk science. NASA excluded data where the land was rising (like Scandinavia) but used data from places where the land is sinking like the east coast of the United States. This skewed the numbers upwards.
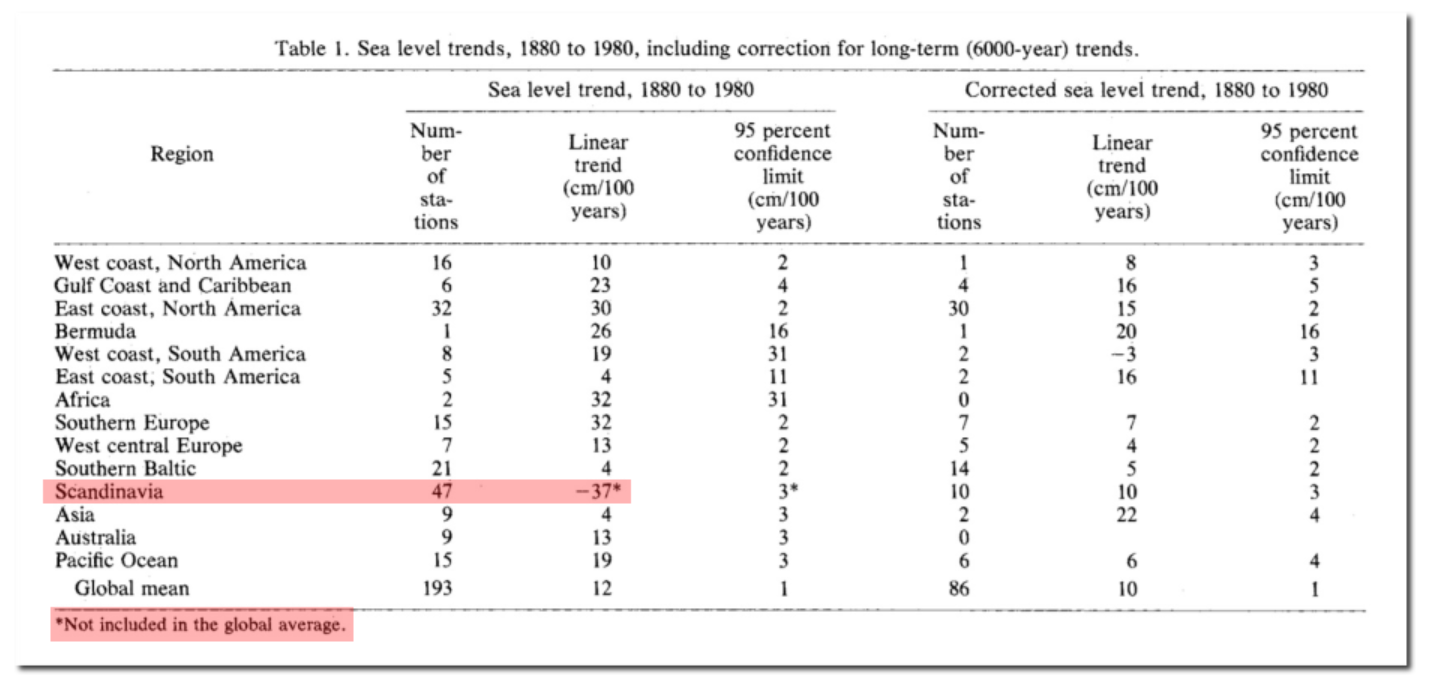
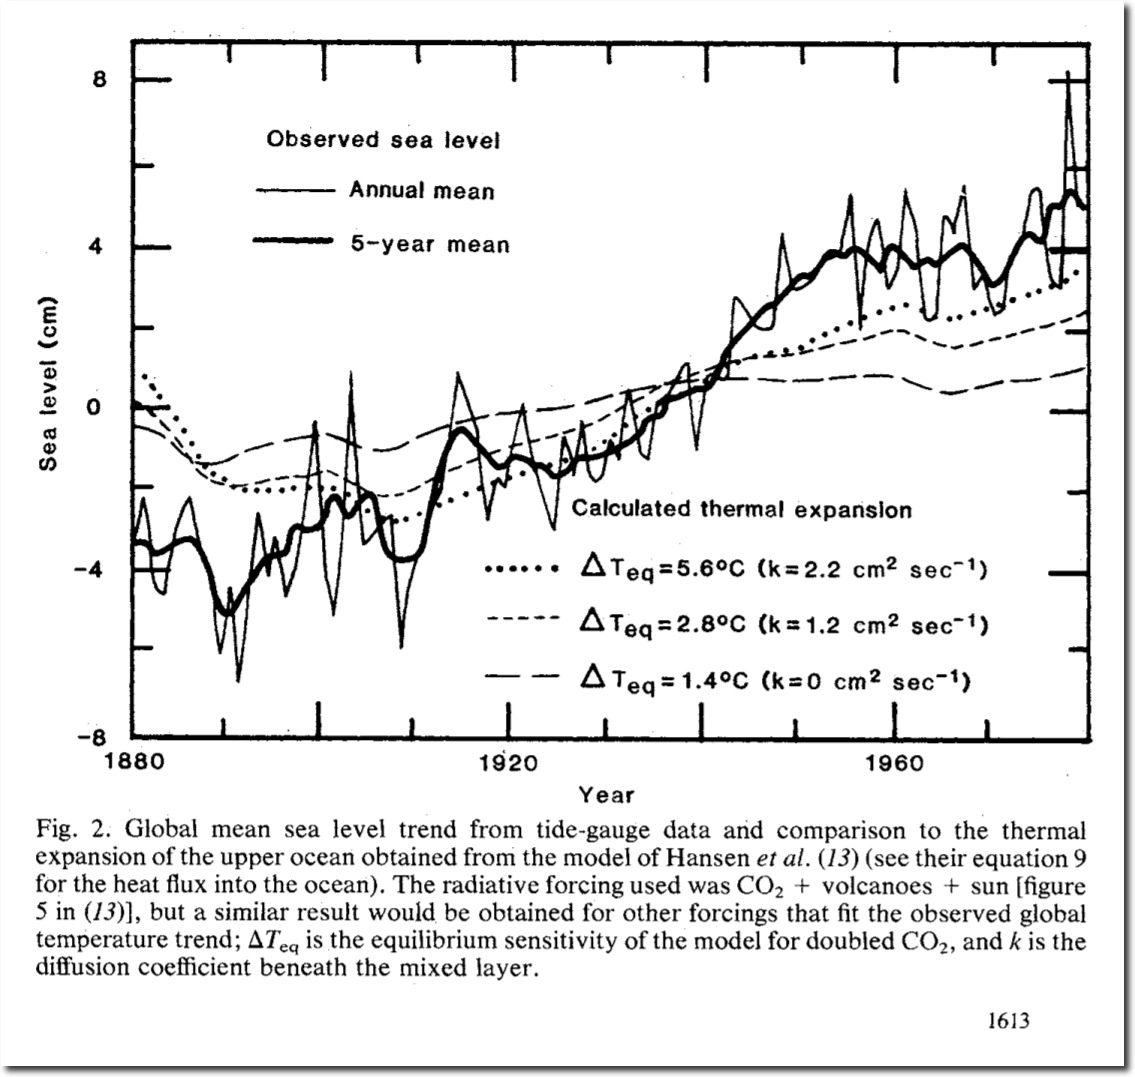
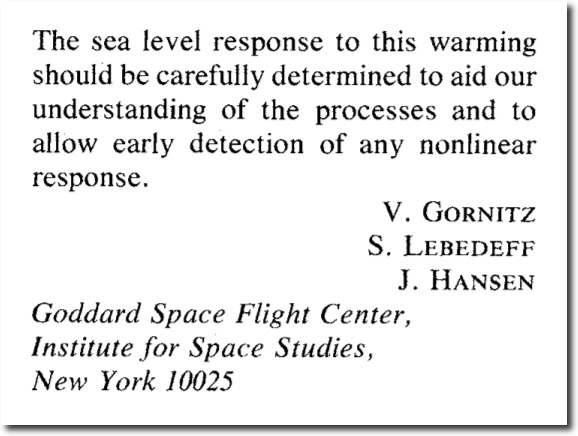
Note Hansen’s comment below about nonlinear response.
1982_Gornitz_go05100g.pdf
If sea level rise rates were accelerating, tide gauge graphs around the world would be non-linear with an upwards curvature. Water seeks a level surface, so any nonlinear “response” would be seen globally. There is no evidence this is occurring.
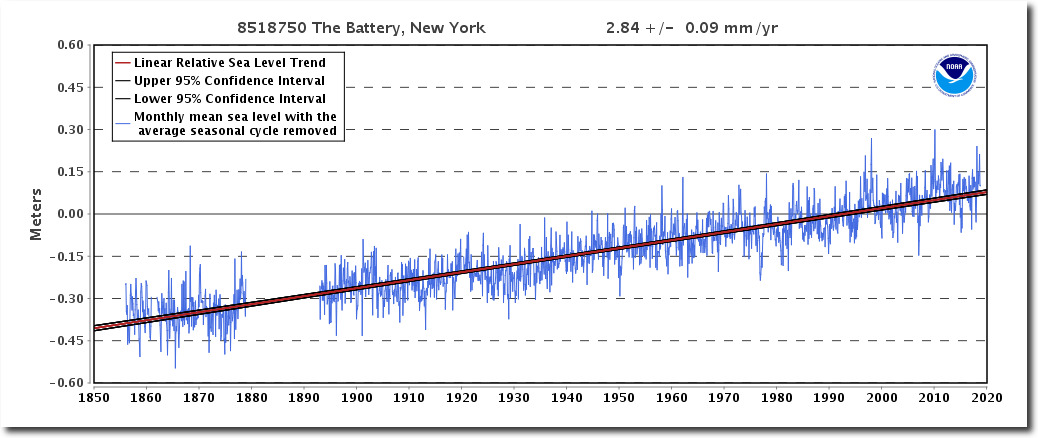
Sea Level Trends – NOAA Tides & Currents
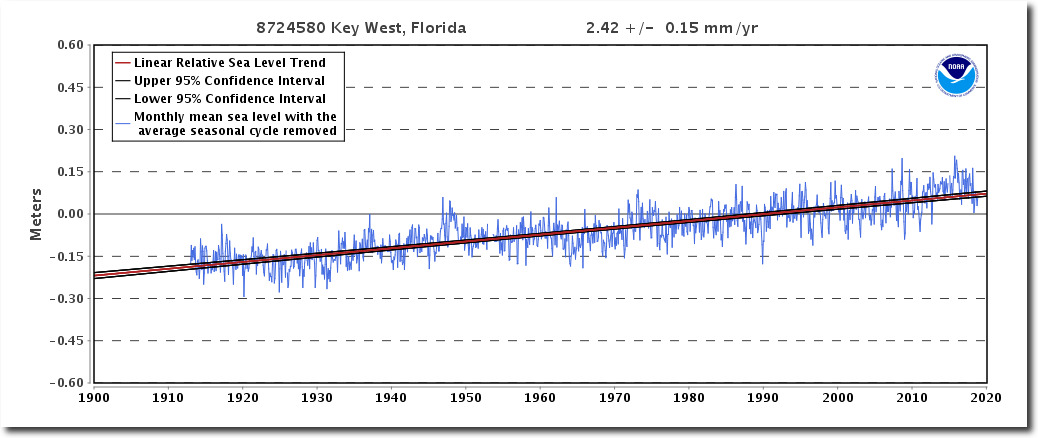
Sea Level Trends – NOAA Tides & Currents
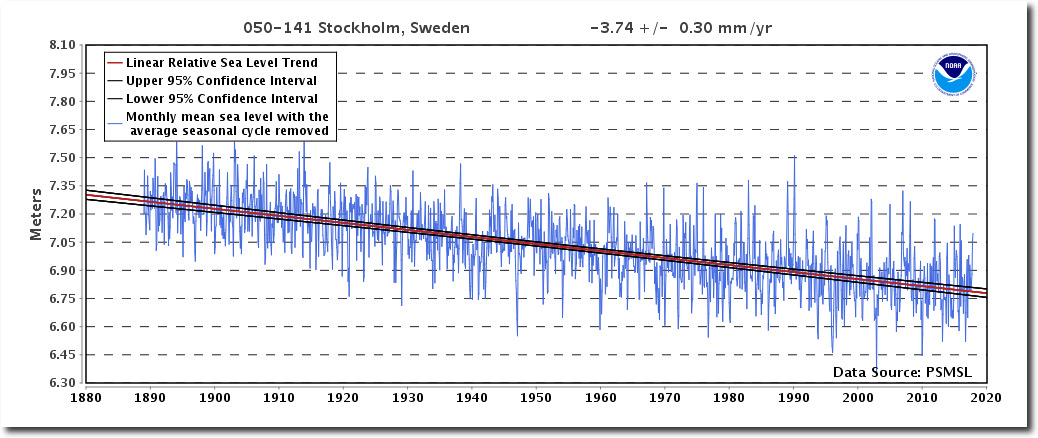
Sea Level Trends – NOAA Tides & Currents
NOAA says “the absolute global sea level rise is believed to be 1.7-1.8 millimeters/year” – about half what NASA is claiming from their satellite data. Sea level has risen 400 feet in the last 20,000 years – almost all of that before 8,000 years ago. It has nothing to do with humans.
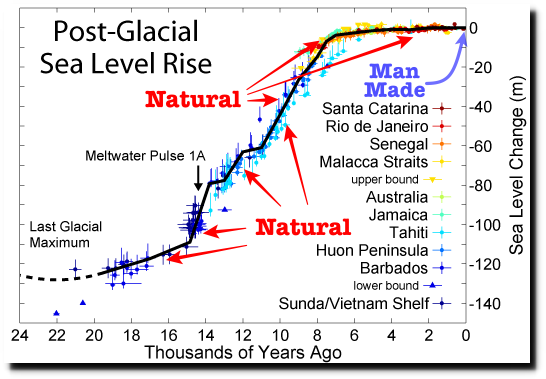
File:Post-Glacial Sea Level.png – Wikimedia Commons
There is no indication that sea level rise is accelerating and no indication that government climate scientists are capable of being honest about anything. Ever.


