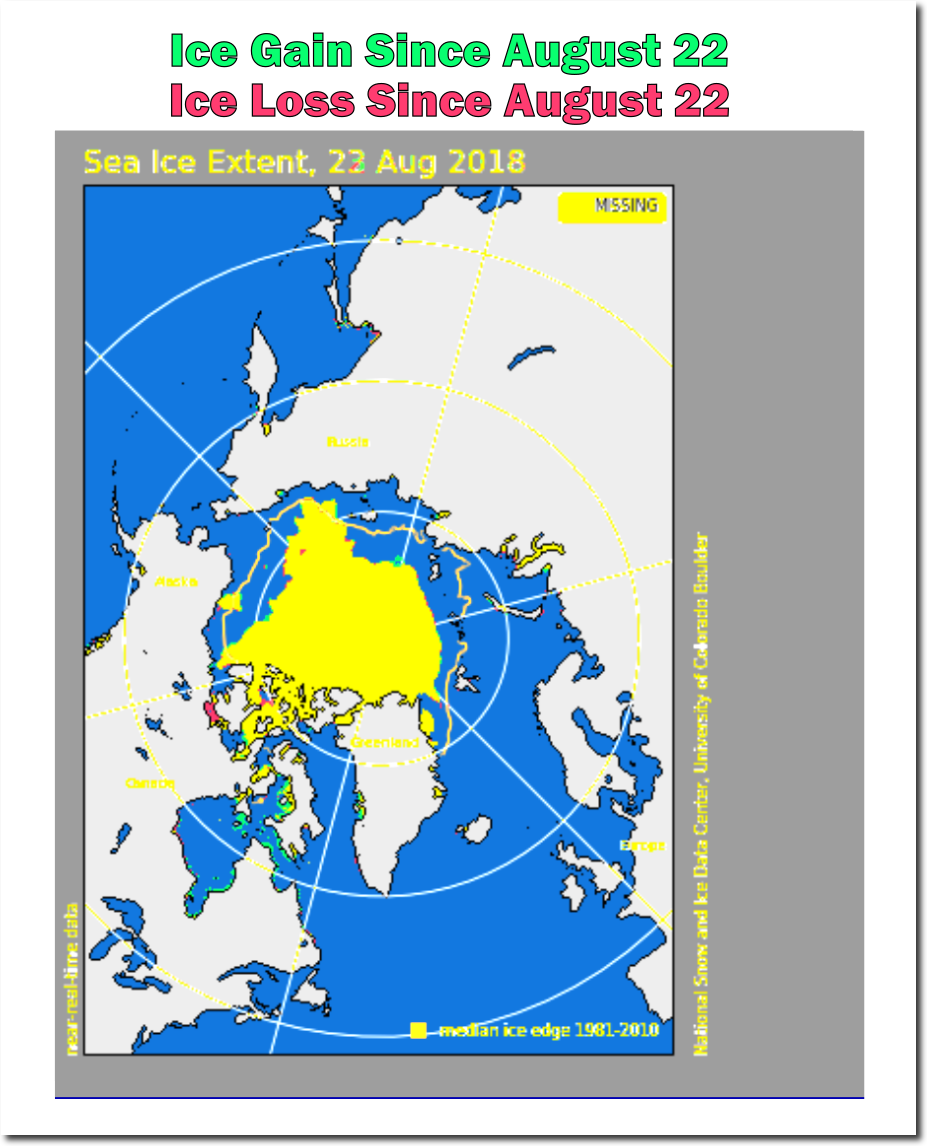
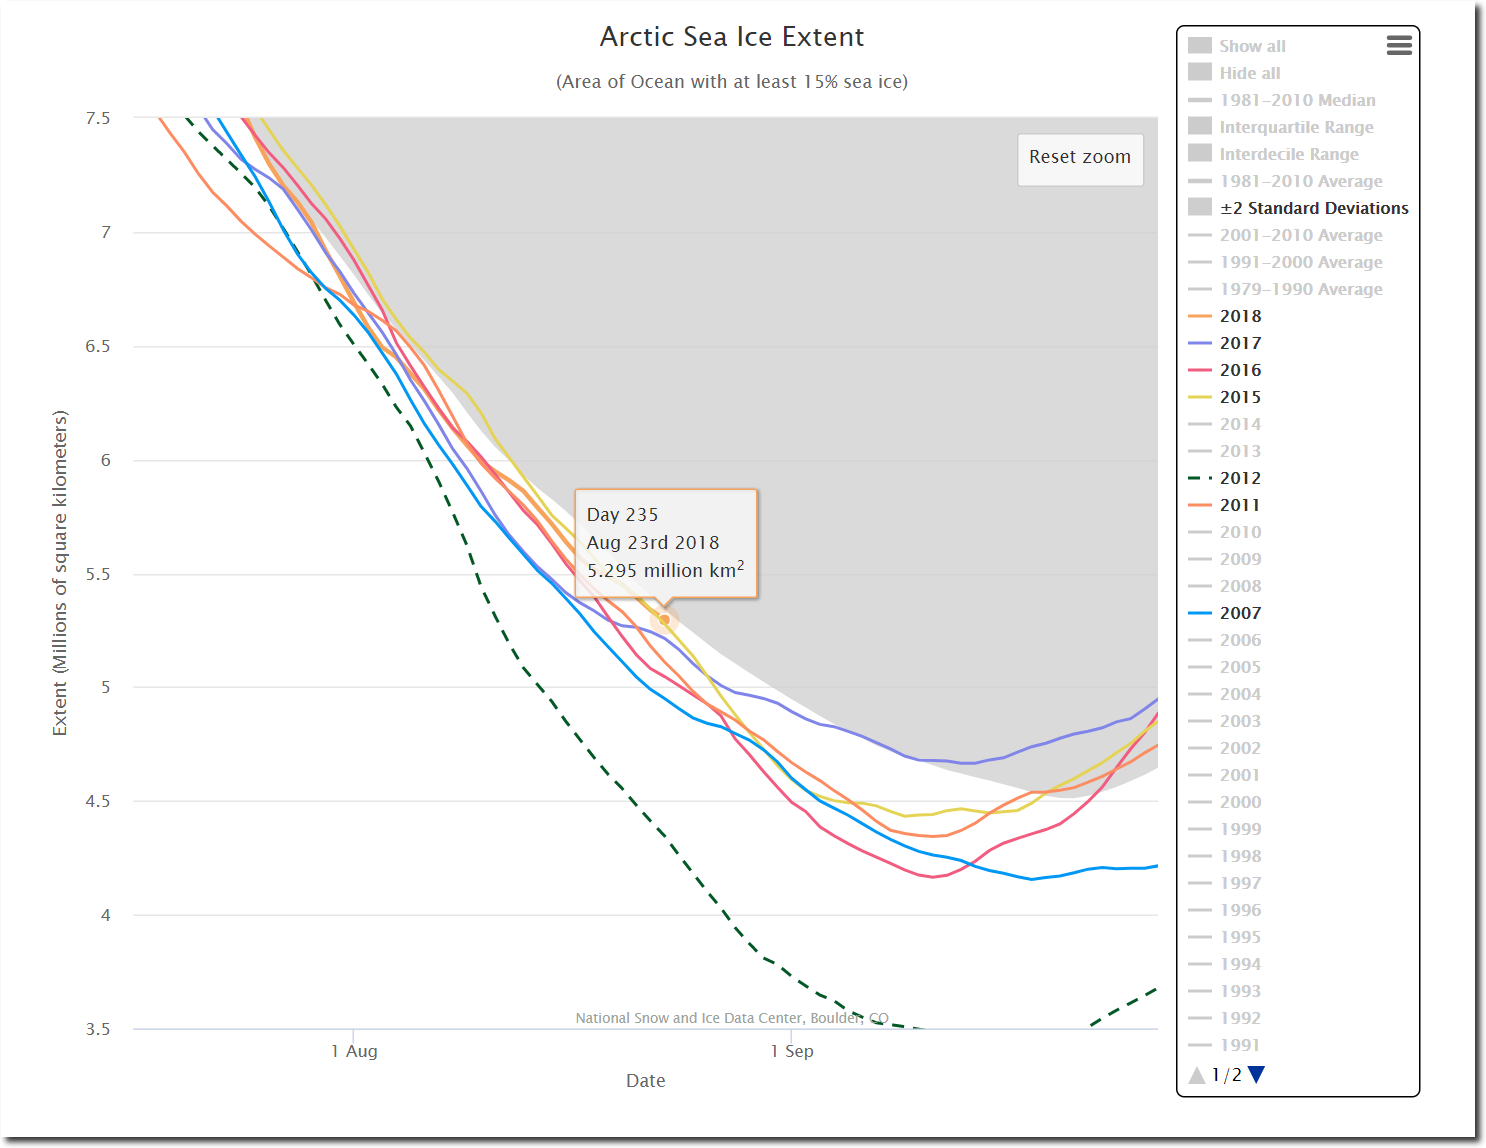
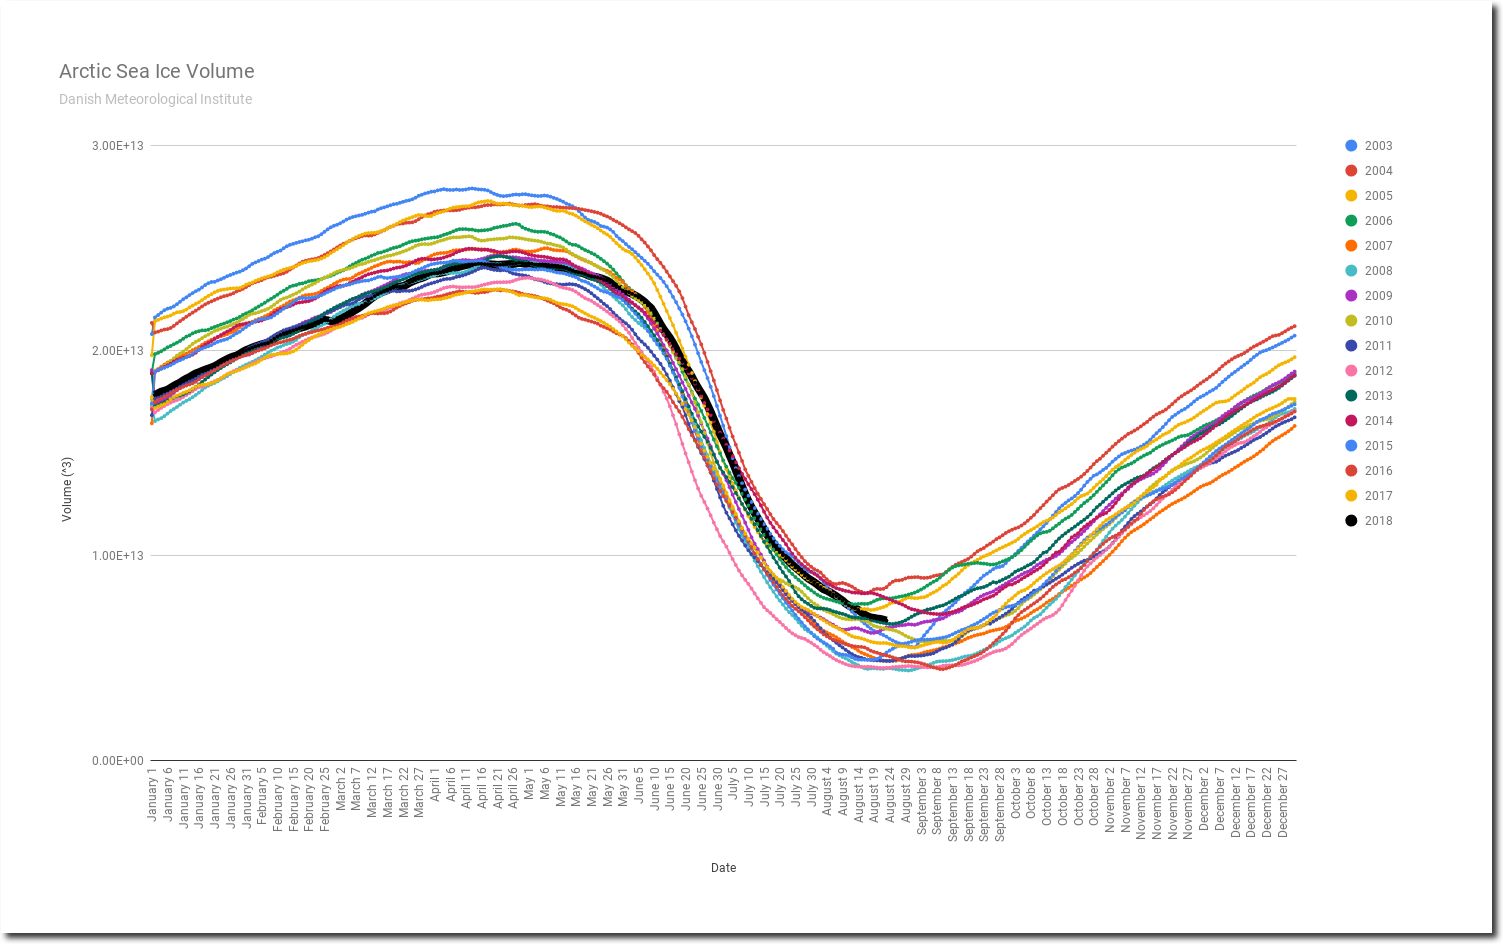
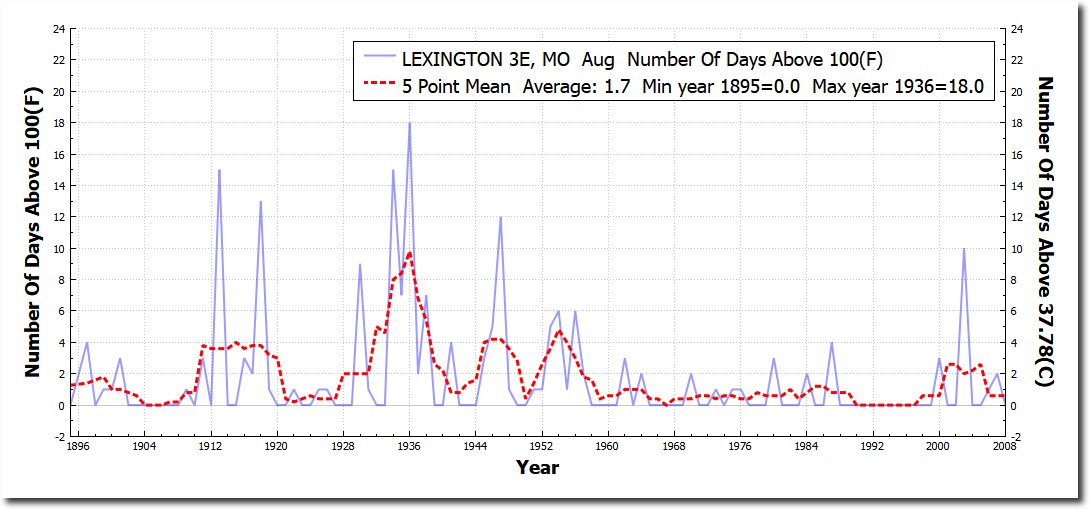
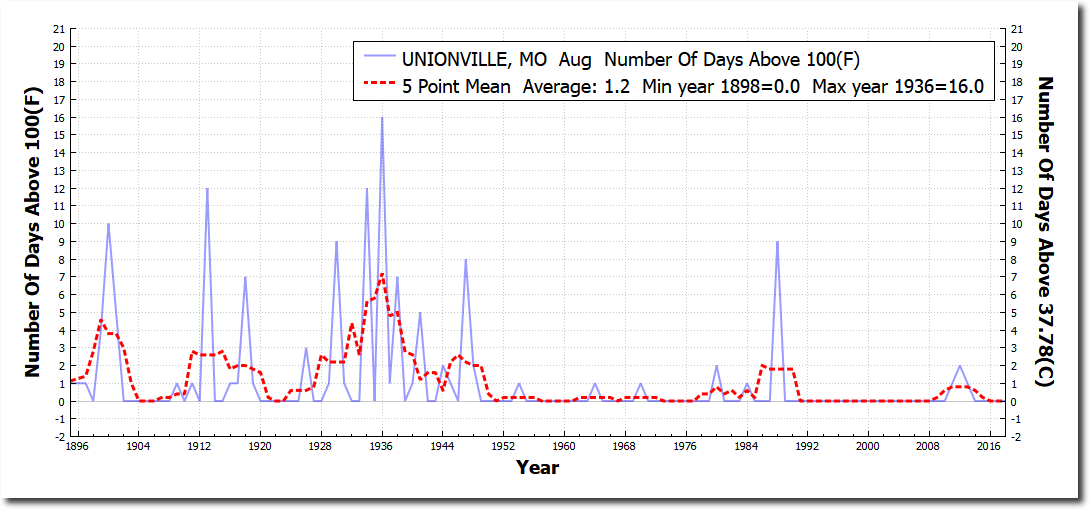
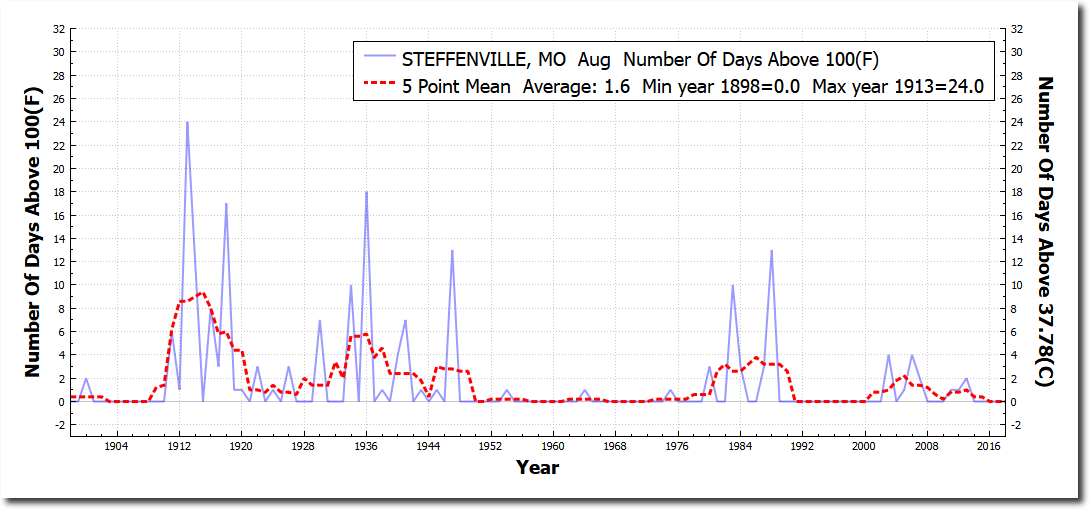
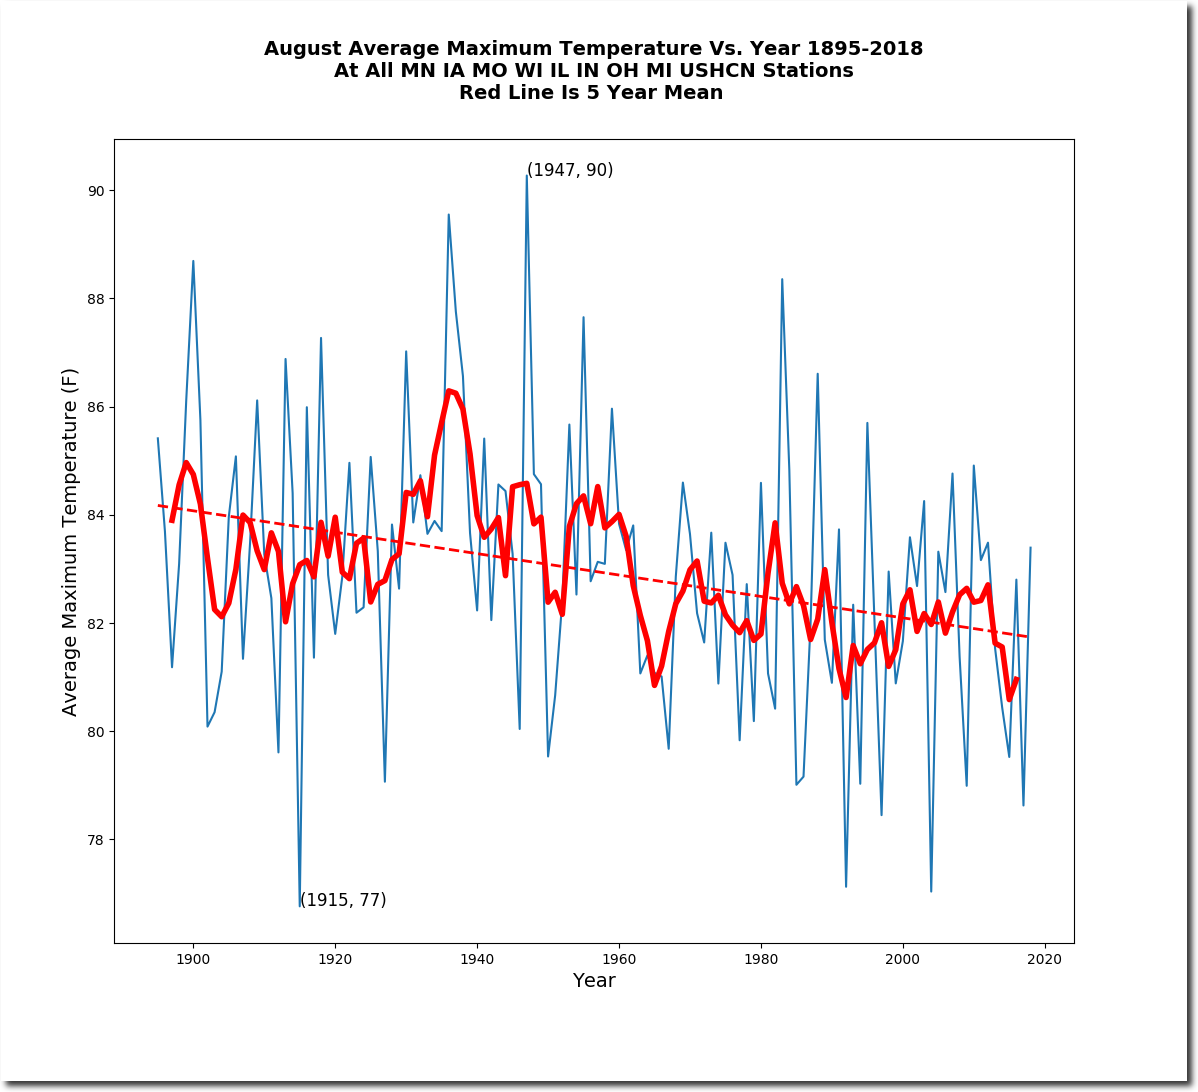
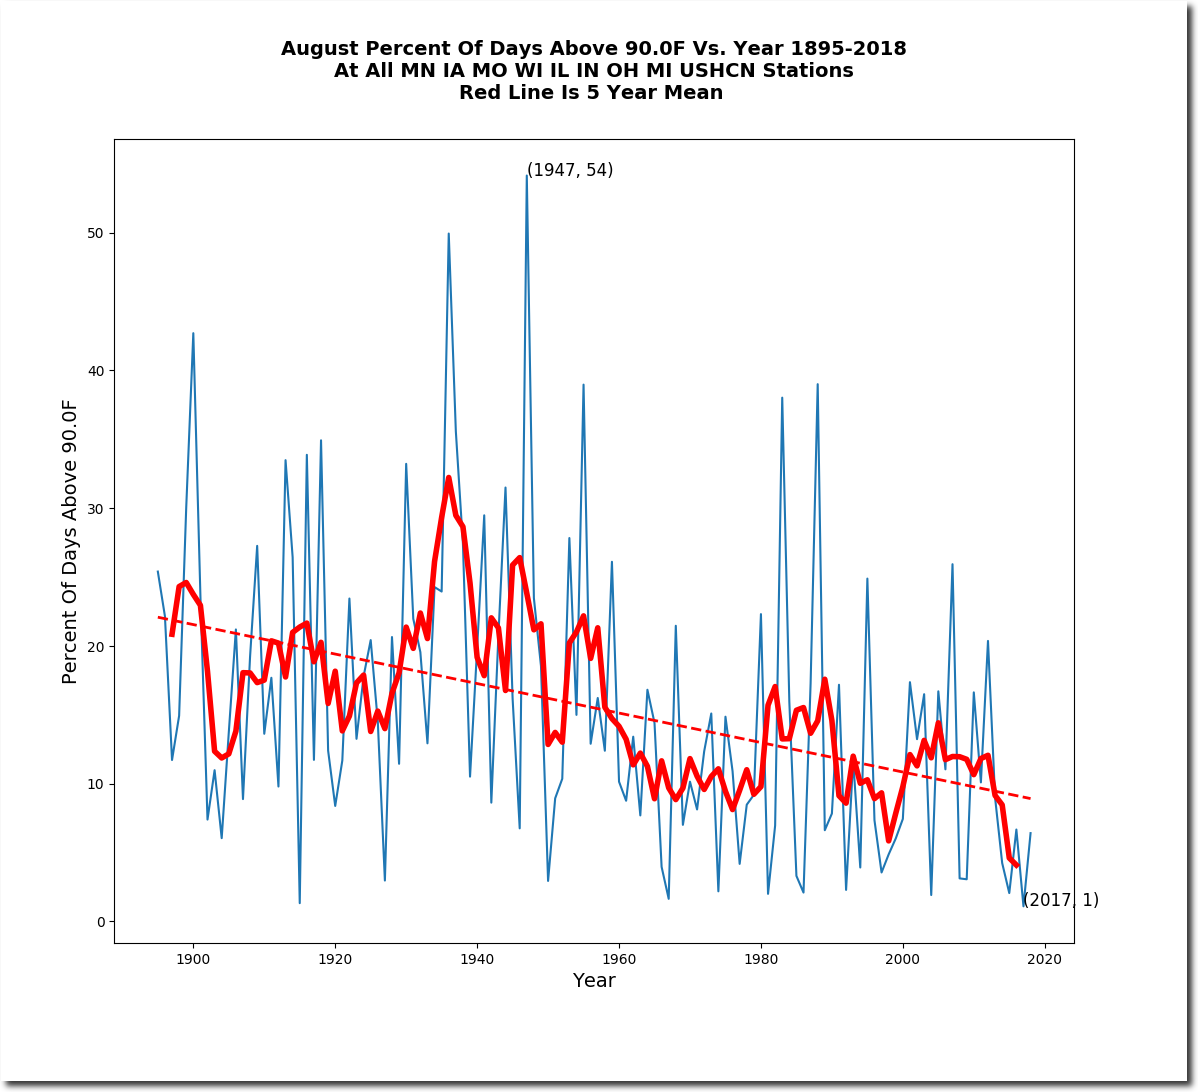
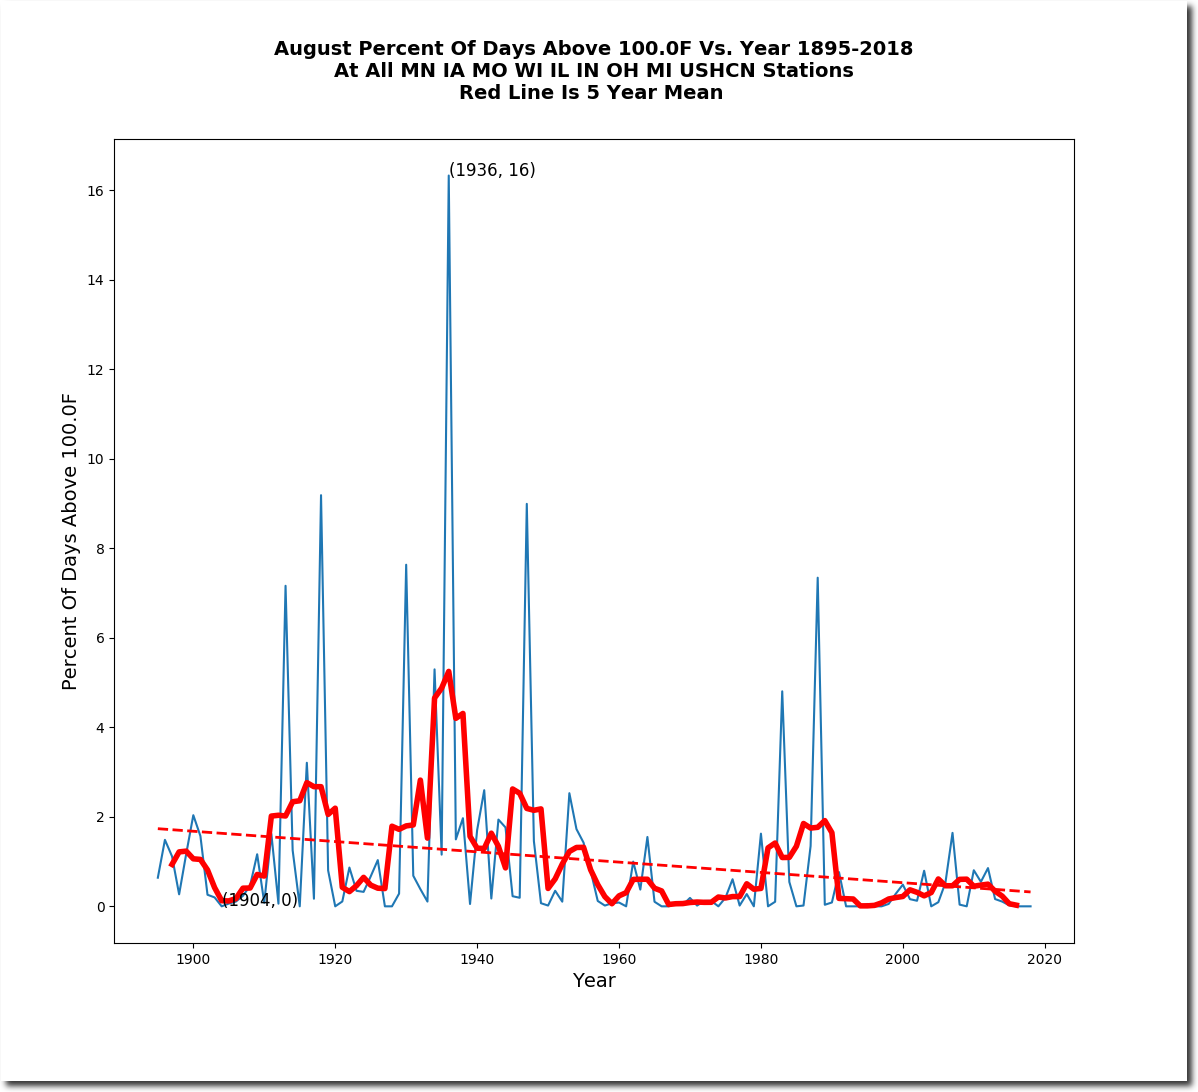
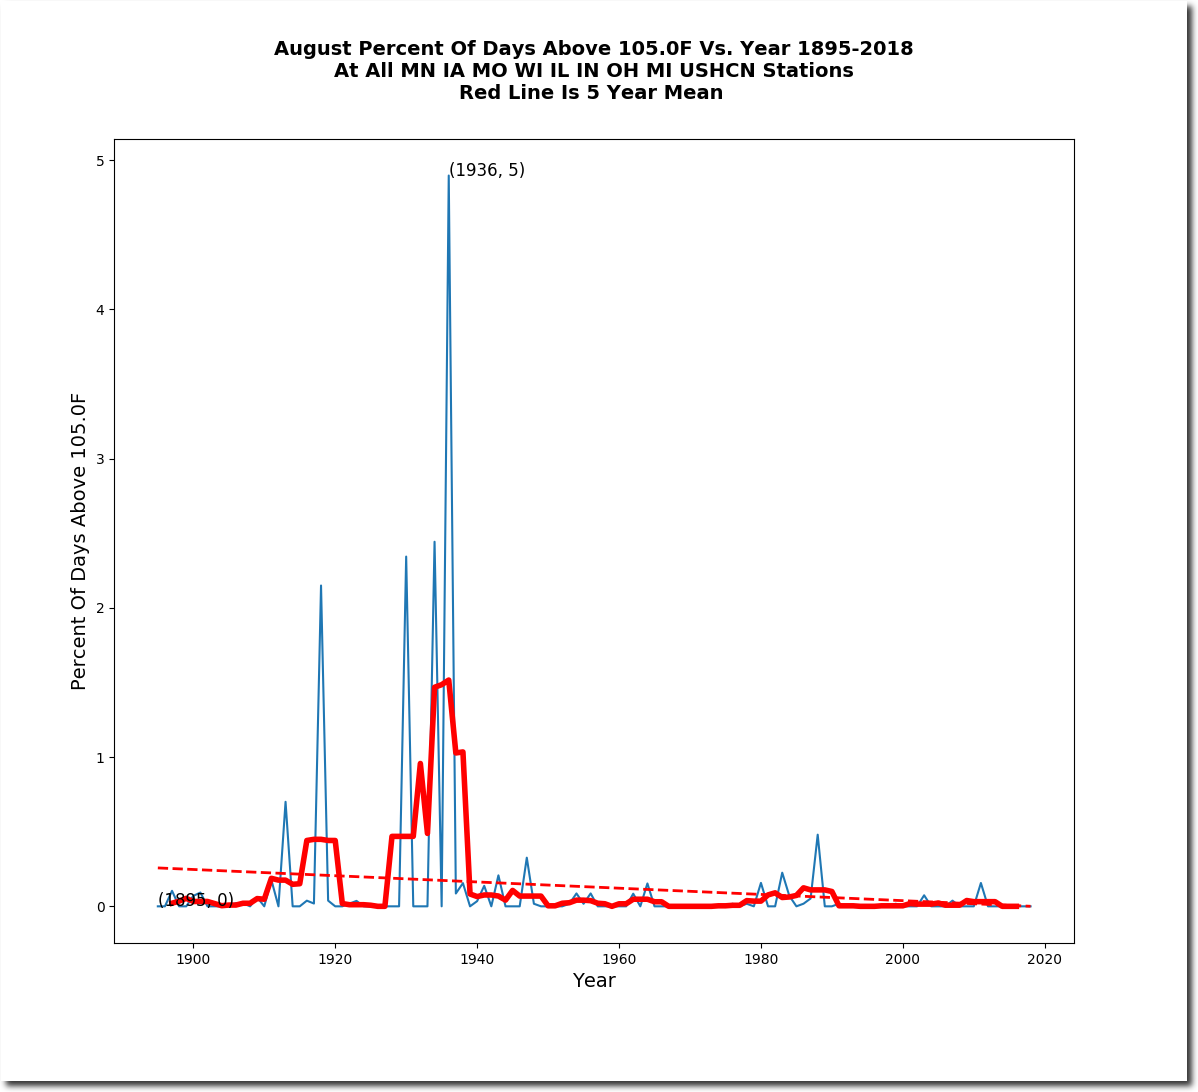
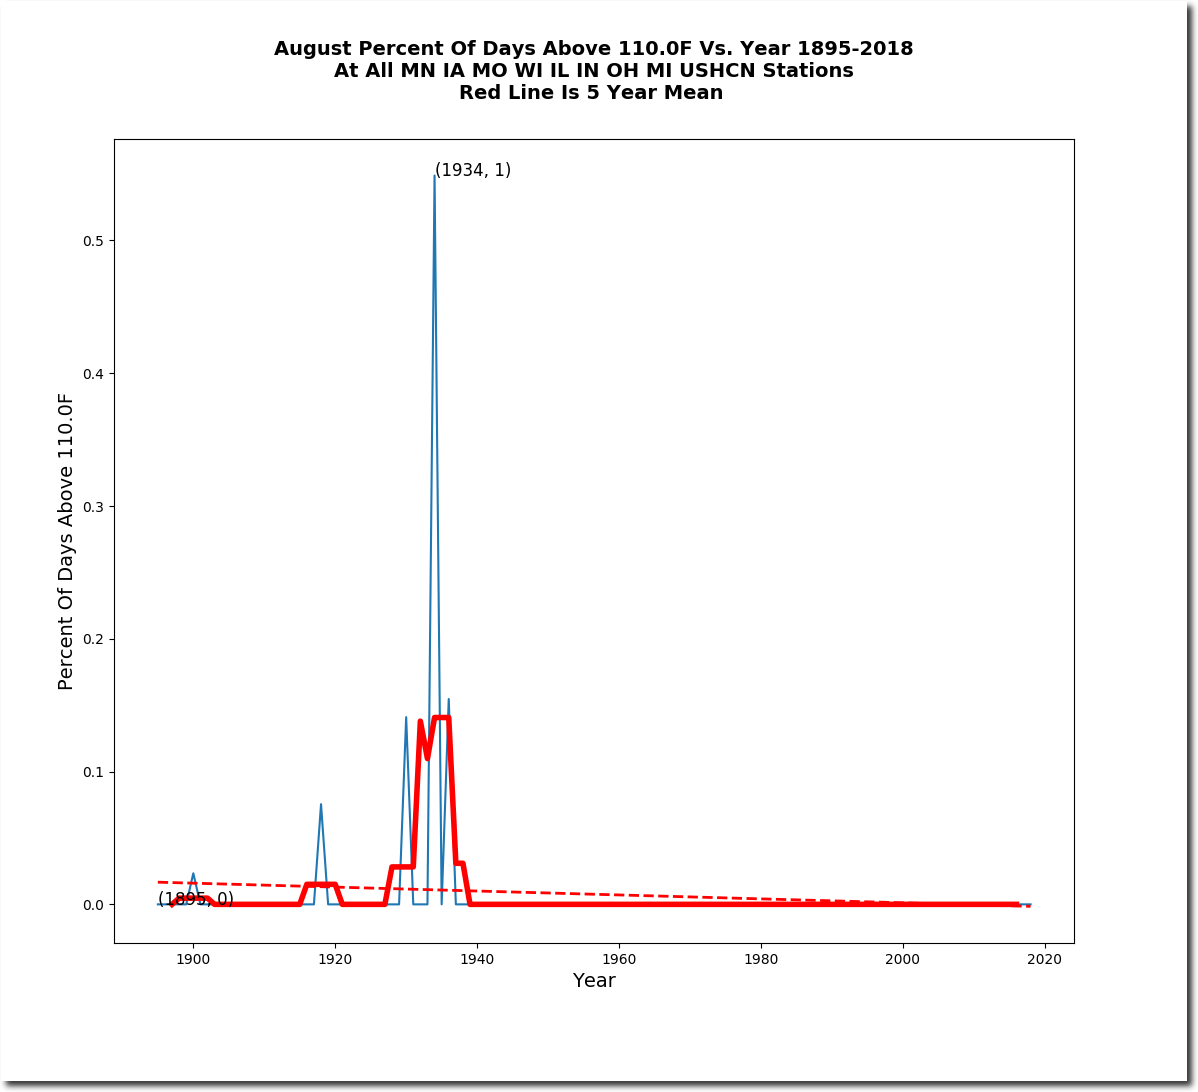
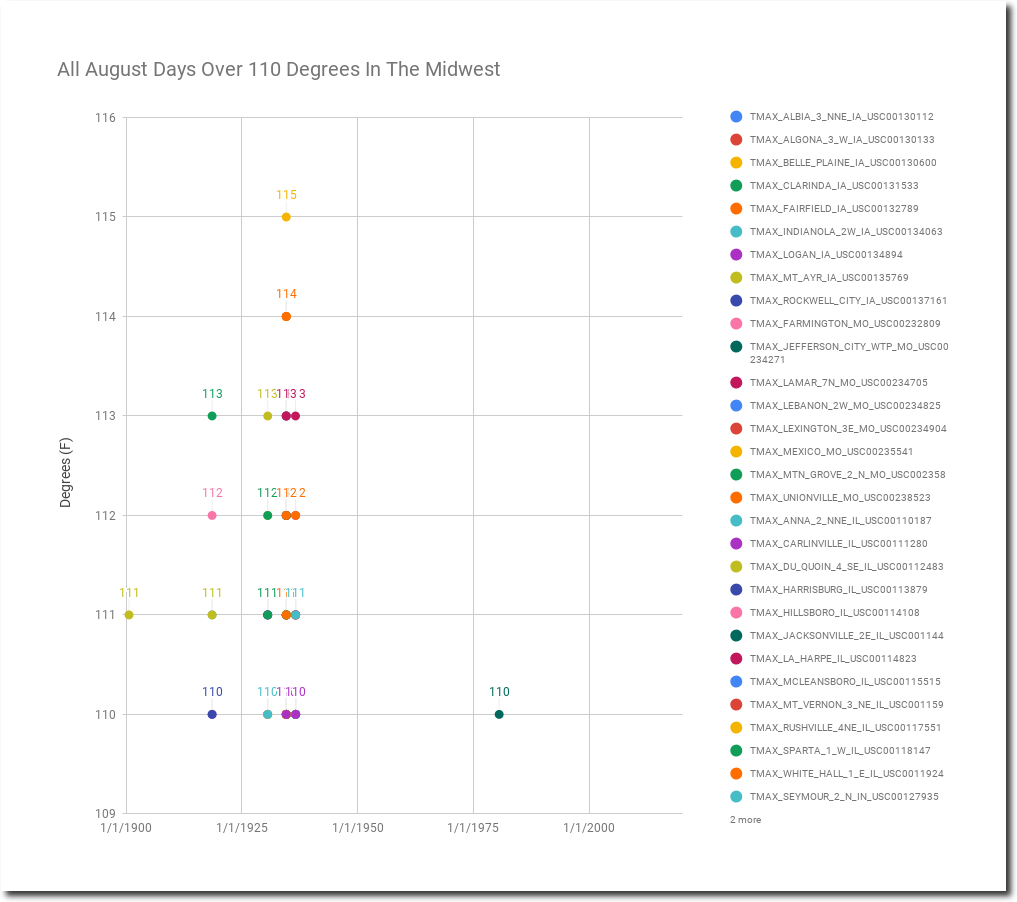
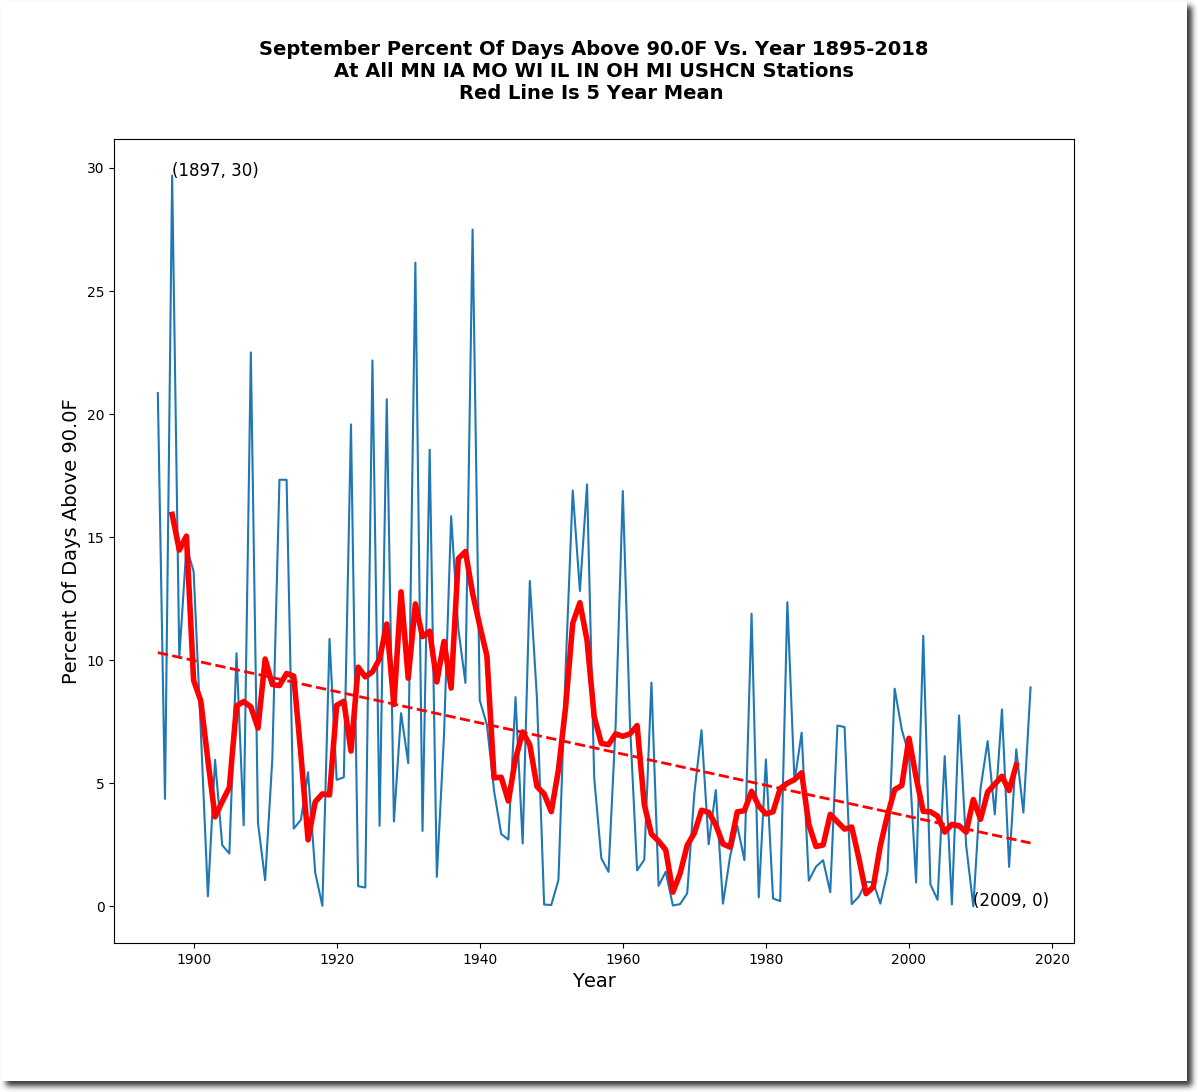
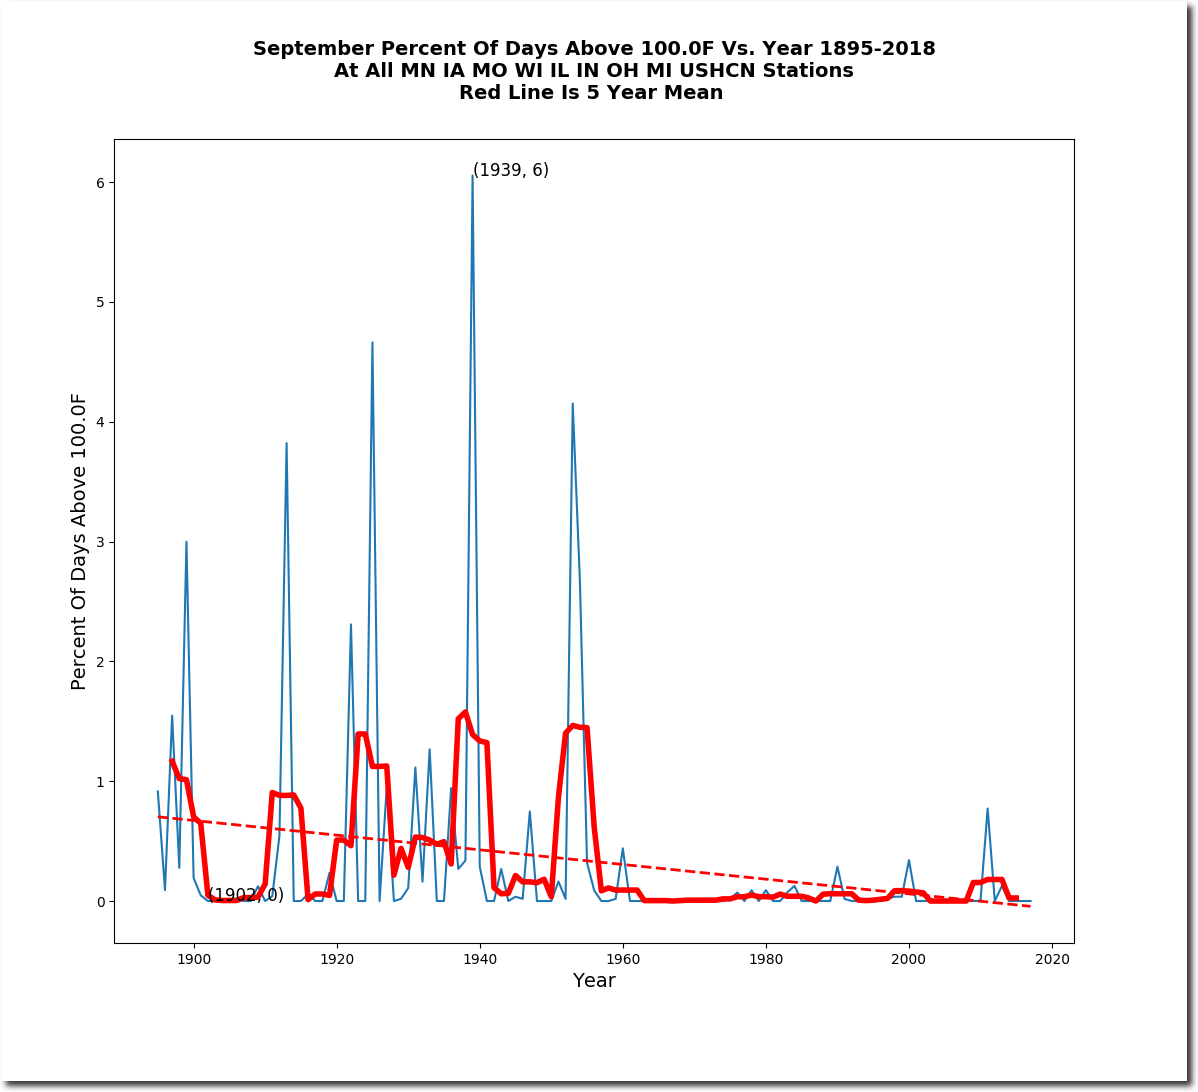
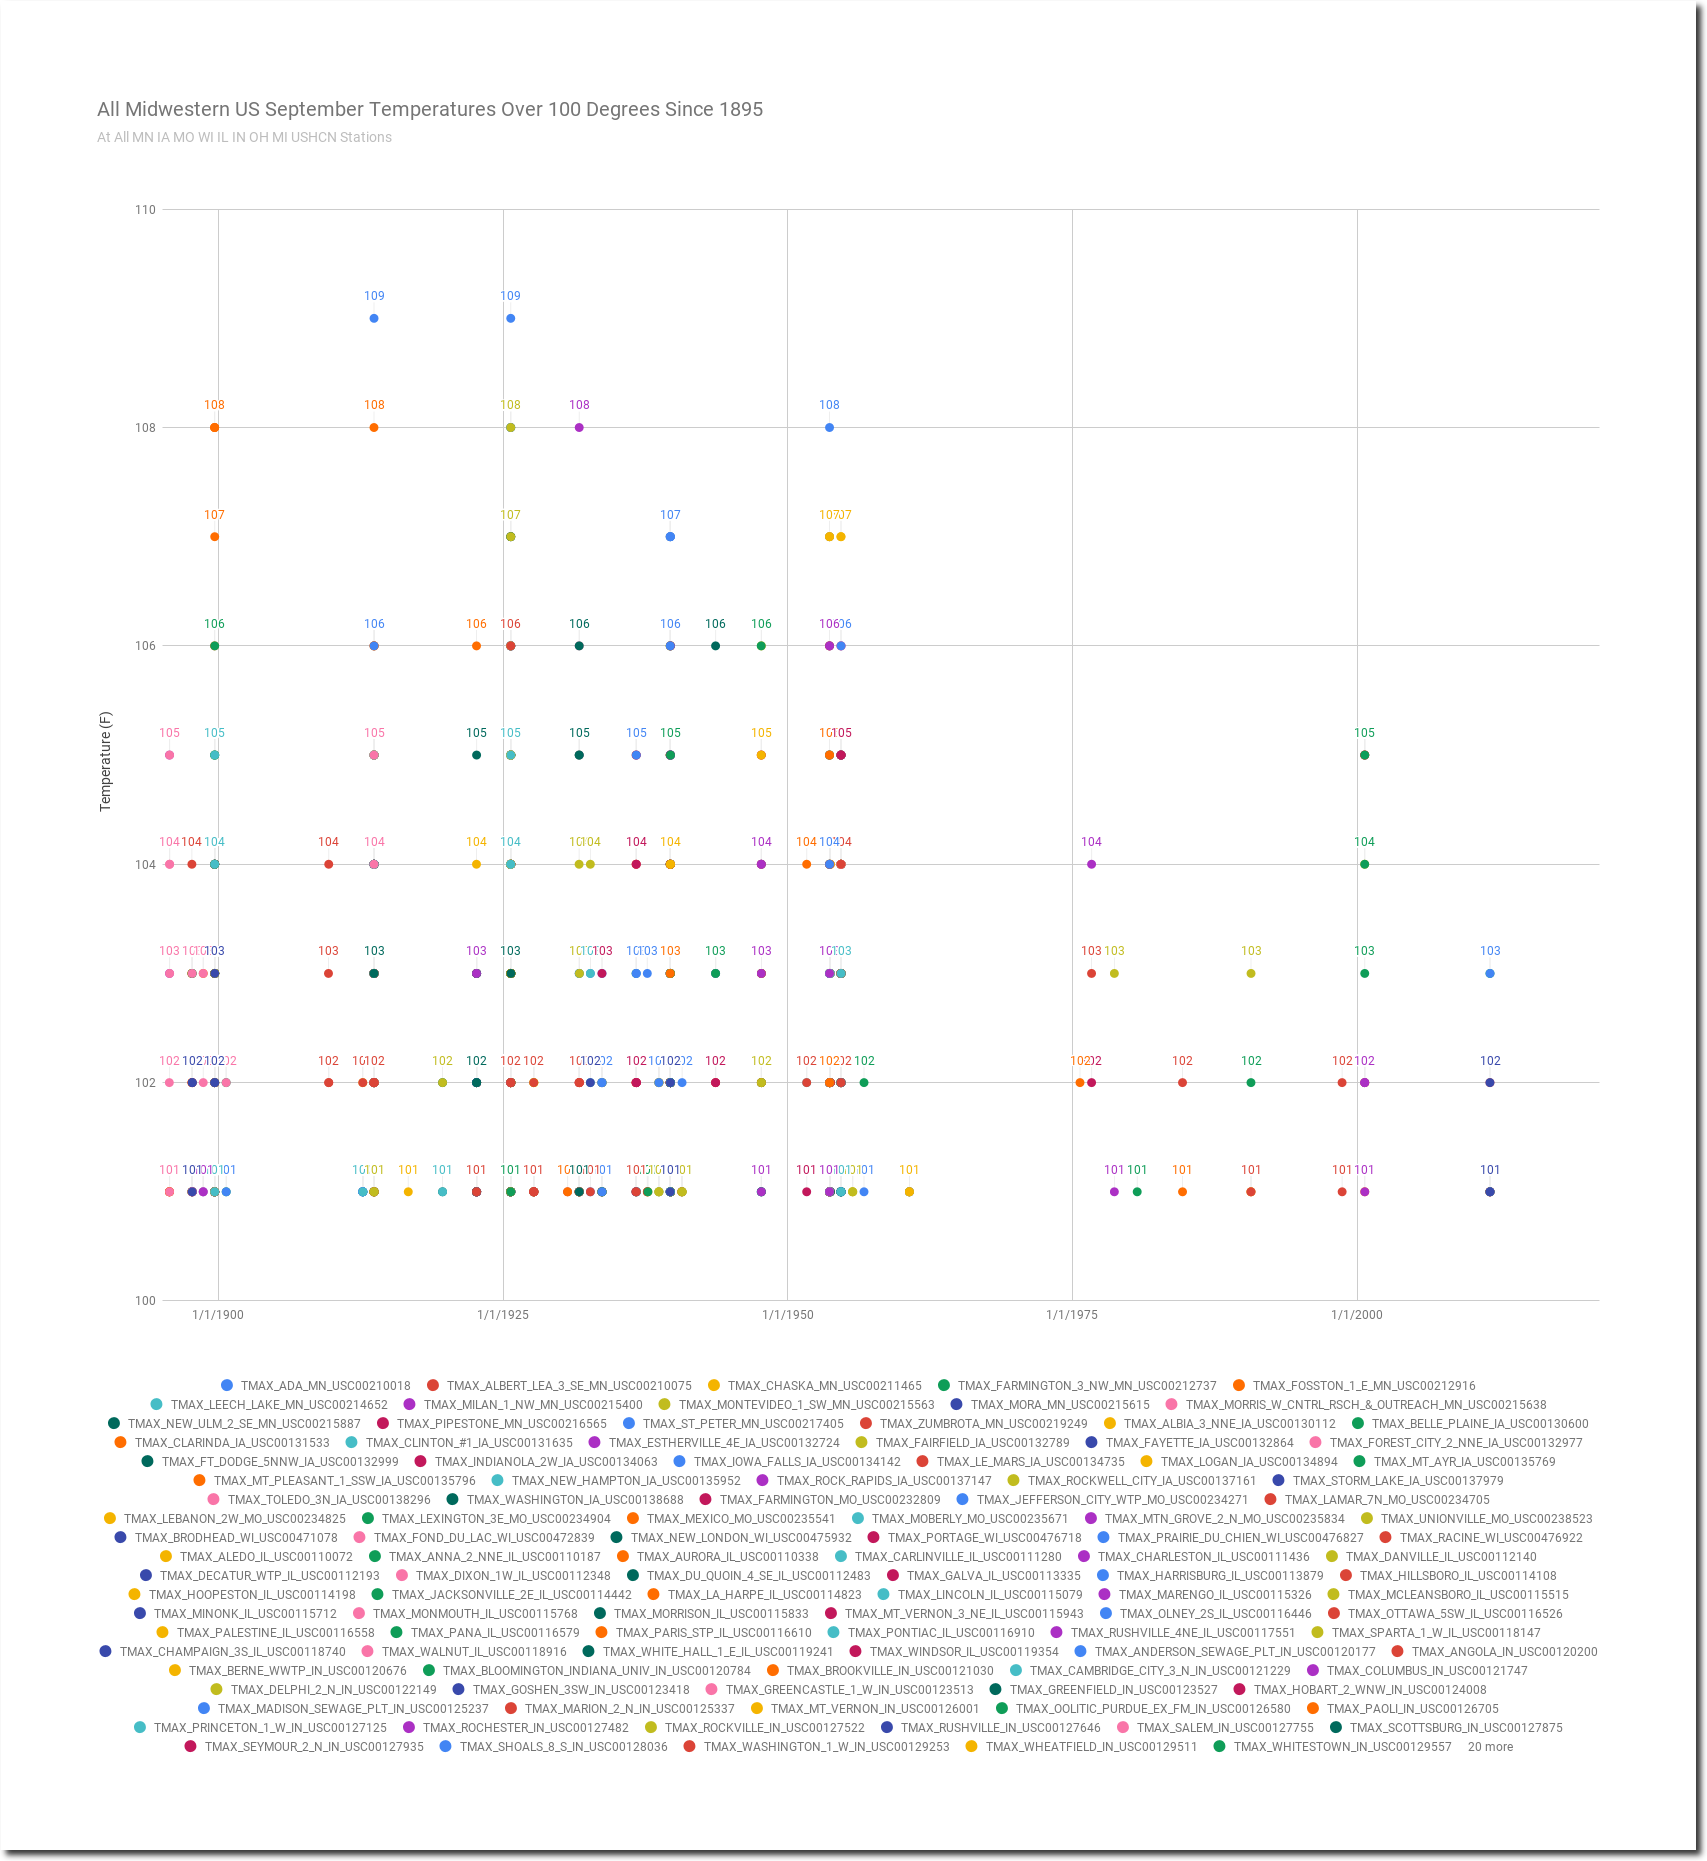
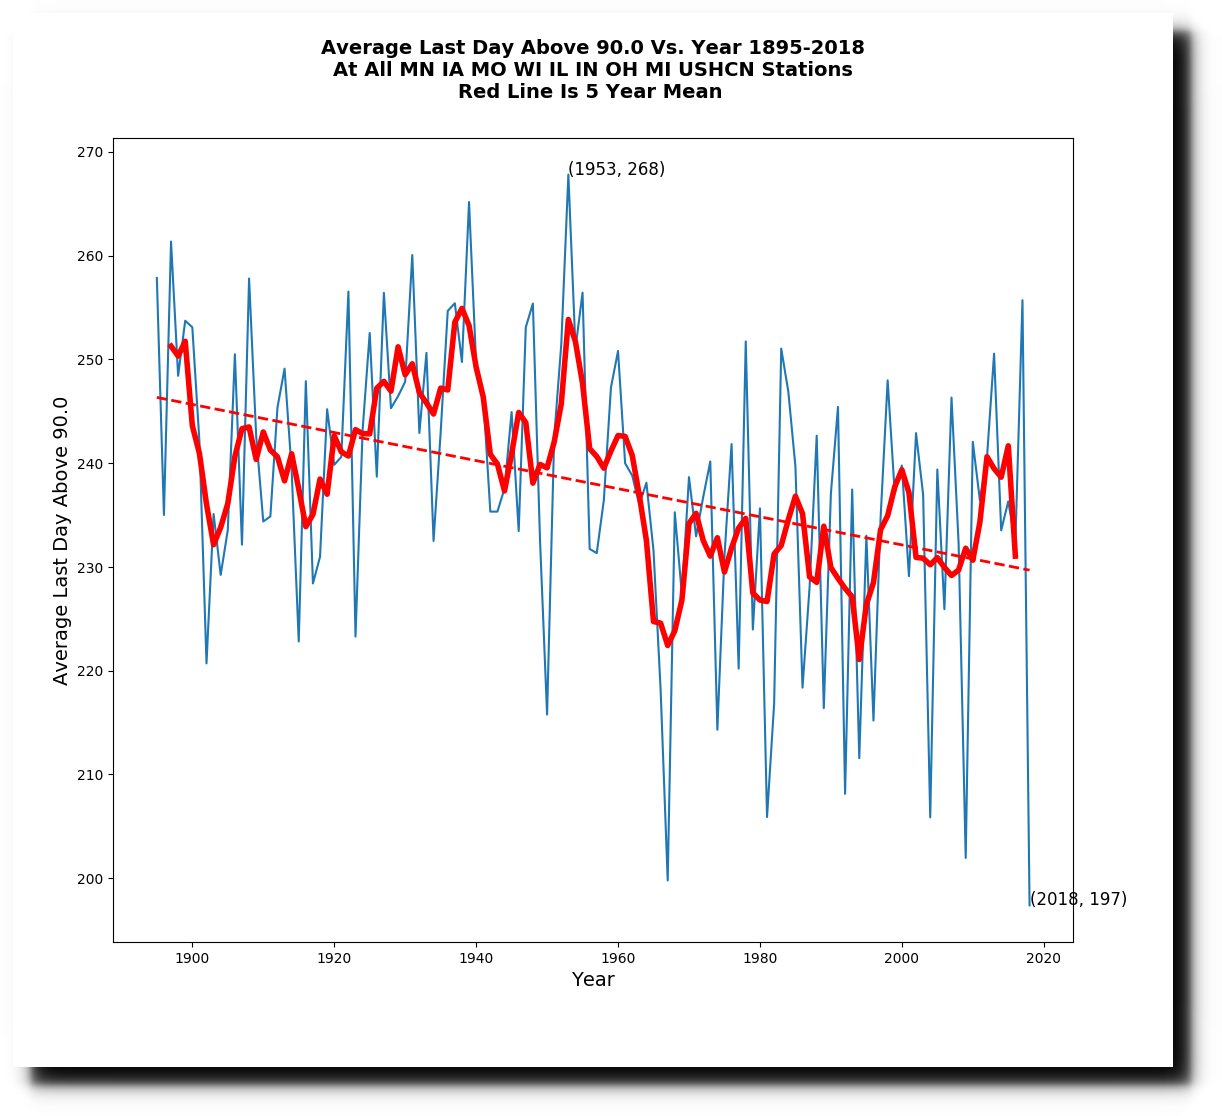
Disrupting the Borg is expensive and time consuming!
Google Search
-
Recent Posts
- One Atomic Bomb Per Hour
- New Video : Analyzing Oil And Gas
- Is Antarctica Melting?
- High Speed Analysis And Visualization
- El Nino To The Rescue?
- Fake News Update
- Growth Of Antarctic Sea Ice
- 65 Years Of Progress!
- El Nino To The Rescue?
- Worst March Drought On Record
- ChartGL Process Control Demo
- The Biggest Money Laundering Scam
- Drought In The Headwaters Of Lake Powell
- Unrealistic Expectations Of Water Availability
- Did Bill Gates Do This?
- Worst March Drought On Record In The US
- The Real Hockey Stick Graph
- Analyzing The Western Water Crisis
- Gaslighting 1924
- “Why Do You Resist?”
- Climate Attribution Model
- Fact Checking NASA
- Fact Checking Grok
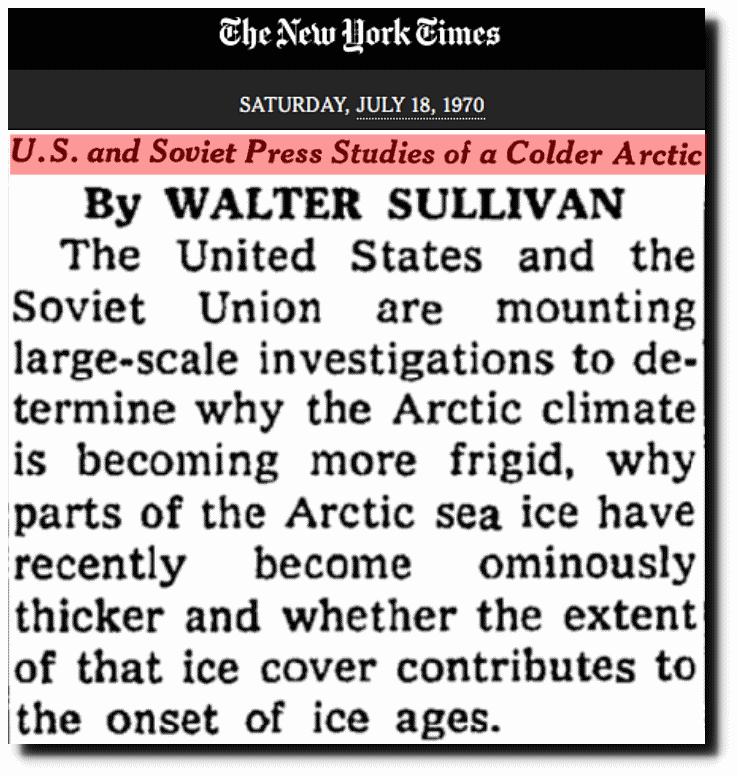
- Fact Checking The New York Times
- New Visitech Features
Recent Comments
- Gordon Vigurs on One Atomic Bomb Per Hour
- Bob G on One Atomic Bomb Per Hour
- Robertvd on One Atomic Bomb Per Hour
- czechlist on One Atomic Bomb Per Hour
- conrad ziefle on One Atomic Bomb Per Hour
- D. Boss on One Atomic Bomb Per Hour
Circles
Posted in Uncategorized
Leave a comment
Arctic Alarmist Meltdown Accelerates
There is essentially no melting occurring in the Arctic Basin.
Index of /DATASETS/NOAA/G02135/north/daily/images/2018/08_Aug/
Ice extent loss has slowed to a crawl, and will soon be “normal”
Charctic Interactive Sea Ice Graph | Arctic Sea Ice News and Analysis
Ice volume loss has also dropped to close to zero.
The ice edge is not much different than it was in 1971.
That was during the global cooling scare, when climate scientists were worried about expanding Arctic ice and a new ice age.
U.S. and Soviet Press Studies of a Colder Arctic – The New York Times
The prophets have failed miserably, but the scam lives on.
Posted in Uncategorized
Leave a comment
The Missouri Heatwave of August 12-27, 1936
From August 12-27, 1936, afternoon temperatures at Lexington, Missouri averaged 106 degrees, peaked at 110 degrees, and were never below 100 degrees.
Unionville, Missouri also averaged 106 degrees, and peaked at 112 degrees.
One hundred degree days were common during August in Missouri prior to 60 years ago, but they rarely happen any more.
Posted in Uncategorized
Leave a comment
Least Extreme Year On Record Continues In The US
The number of daily and all-time record temperatures (maximums and minimums) in the US has been at or near a record low in 2018.
The number of tornadoes has been near a record low. And there have been no hurricanes.
Storm Prediction Center WCM Page
But reality doesn’t have any meaning to climate scienctists or leftists in general.
Posted in Uncategorized
Leave a comment
New Ice-Free Arctic Date
Arctic sea ice volume melt rates have slowed to close to zero, so I am pushing my ice-free Arctic date out to December 23, 2019 at exactly twelve noon.
Posted in Uncategorized
Leave a comment
Plummeting September Temperatures In The Midwest
Summers are getting much shorter in the Midwest, and September is getting much cooler.
In 1897, thirty percent of Midwest summer days were over 90 degrees, but in 2009 there were no 90 degrees readings.
One hundred weather was common during September prior to 60 years ago, but almost never happens now in the Midwest.
Summers in the Midwest end ten days earlier than they did a century ago.
But facts don’t matter to climate alarmists, who lie about essentially everything as their standard operating procedure.
Posted in Uncategorized
Leave a comment
NSIDC Losing Their Ice Cubes
NSIDC shows no ice north of Barrow, AK.
N_20180817_extn_hires_v3.0.png (1461×1740)
But visible satellite imagery shows lots of ice (red) there.
Unlike the fraudsters at NSIDC, the Danish Meteorological Institute correctly shows the ice.
I’ve also observed that NSIDC shows the edge of the ice consistently further back than satellite imagery shows. But when small fractions of a percent make for large differences in propaganda value, NSIDC consistently sides with the needs of propagandists.
Posted in Uncategorized
Leave a comment
The Heatwave Of Autumn 1939
From September 1 to October 9, 1939 – Madison, Indiana afternoons averaged 95 degrees, had thirty-one days over 90 degrees, and eleven days over 100 degrees. On October 8, 1939 is was 100 degrees in Indiana. Imagine the global warming hysteria is this happened now.
September/October afternoon temperatures have dropped more than five degrees over the last century at Madison, Indiana.
The heatwave was coast to coast.
11 Oct 1939, Page 5 – The Indianapolis Star at Newspapers.com
13 Oct 1939, 16 – The Times at Newspapers.com
Summer ends much earlier now than it did a century ago. Many years since 1960 haven’t had any 90 degree days, but prior to that it was very rare for Indiana summers not to reach 90 degrees.
This correlates with much more extensive autumn snow cover over the past 50 years.
Rutgers University Climate Lab :: Global Snow Lab
There is lots of evidence that summers are becoming milder and shorter in the Northern Hemisphere, but that wrecks the multi-billion dollar global warming scam for climate scientists. so they will never tell the truth – about anything.
Posted in Uncategorized
Leave a comment


