15th Hole Strategy

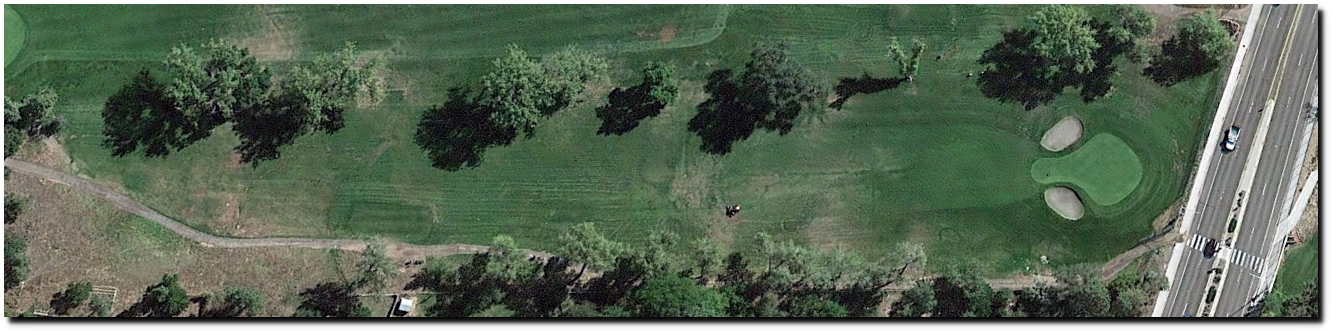
This is the 15th hole at the Los Alamos Golf Course. It is 160 yards downhill. I have been playing this hole for 50 years and still haven’t figured it out.  They normally put the pin near the front of the green, to keep people from hitting cars. The front of the green is less than 20 feet wide, and it is only 30 feet from trap to trap.

Yesterday I thought I hit a perfect shot into a strong wind, and ended up in the trap on the right side. I missed the pin by only ten feet, but left myself with a very difficult second shot out of the trap on to a narrow green, which drops off sharply on the other side.

Unless you are pro, it probably makes sense to play it short and have an easy second shot on to a flat, smooth green, but I still haven’t figured that out yet after 50 years. The good news is that I now get a senior discount.

Posted in Uncategorized | Leave a comment

Plummeting August 21 Temperatures In The Midwest

August 21 used to be a hot day in the Midwest, but has cooled dramatically over the last century. There hasn’t been a 100 degree day in the Midwest in 15 years, but they used to be quite common. On this date in 1900, Du Quoin, Illinois was 111 degrees.

On this date in 1955, the average afternoon temperature in the Midwest was 95 degrees. Average afternoon temperatures have dropped three degrees since the 19th century.

On this date in 1955, 85% of the Midwest was over 90 degrees.

Prior to 1960, summer used to last about ten days longer in the Midwest than it does now.

Midwest summers also start about five days later now than they did in the 19th century.

The frequency of hot days is down more than 50% over the past century.

The “Union of Concerned Scientists” claims the exact opposite, because their agenda has nothing to do with science or reality.

Global Warming in the Midwest | Union of Concerned Scientists

Posted in Uncategorized | Leave a comment

More New Mexicans

Posted in Uncategorized | Leave a comment

More Spectacular Climate Nonsense From The Capital Weather Gang

The Washington Post Capital Weather Gang are constantly working to outdo themselves in the fake news climate hysteria department.  Their latest claim is that July was California’s hottest month ever recorded.

On fire: July was California’s hottest month ever recorded – The Washington Post

Average maximum temperatures in California this July weren’t in the top ten, and were four degrees cooler than 1931.

The frequency of hot days wasn’t in the top ten either.

Minimum temperatures were the least cold, but most people don’t consider 64 degrees to be “hot.” However, the warmth in minimum temperatures is most likely due to urban heat island effects around the thermometers, rather than climate.

But the junk science is worse than it seems.  California’s two hottest stations do not have any data prior to 1940 in the GHCN database, so they need to be removed to do a fair comparison vs. 1931.  When Needles and Death Valley are removed, California July temperatures are dropping sharply and this year was not much above average. July 2018 was five degrees cooler than 1931.

This sort of nonsense is standard practice for the Capital Weather Gang, who claimed the Arctic was “super hot” on a day when temperatures made it up to 0C for a few hours in a small region near the North Pole.

Posted in Uncategorized | Leave a comment

New Mexico Colors

Posted in Uncategorized | Leave a comment

Death Valley To Reach The Boiling Point Next Spring

From December 22, 2017 to July 30, 2018, Death Valley, CA warmed at a rate of 102 degrees per year. Using the universally accepted climate science linear extrapolation, Death Valley should reach the boiling point of water* during late May of next year.

  • Important disclaimer : Being below sea level, Death Valley water boils at a higher temperature than 100C. This pushes the boiling point date back a week or two.

Having said that, it should also be noted that Death Valley cooled at a rate of 145 degrees per year from August 27 to December 30 last year. This is undoubtedly one of the many benefits of California carbon taxes.

Posted in Uncategorized | Leave a comment

In Climate Science, No Correlation Is Causation

In the US, the frequency of 95F (35C) days has dropped sharply since the 1930’s.

There is some correlation between the frequency of 95 degree days, and the average annual maximum temperature.

There is good correlation between the frequency of hot days and the average summer maximum temperature.

Not surprisingly, the frequency of 95 degree days correlates very well with the frequency of 90 degrees days.

There is perfect correlation between the frequency of 95 degree days, and the frequency of 95 degree days.

However, there is no correlation between the frequency of hot days and atmospheric CO2. If anything, there is anti-correlation.

So which one do climate scientists latch on to? The only relationship which shows anti-correlation. Climate science is a 100% fact-free venture, and the biggest clown show on Earth.

Posted in Uncategorized | Leave a comment

New Ice-Free Arctic Forecast

Arctic sea ice melt dropped to its lowest level since May 12 yesterday, and now the Arctic won’t be ice-free until July 20 of next year, 12:01 am.

Spreadsheet    Data

For the third day in a row, there has been almost no change in Arctic sea ice extent.

Index of /DATASETS/NOAA/G02135/north/daily/images/2018/08_Aug/

I’m sad to report that the prophets have failed. The Arctic will not be ice-free in 2014 or 2018 as they promised.

The Argus-Press – Google News Archive Search

Gore: Polar ice cap may disappear by summer 2014

Posted in Uncategorized | Leave a comment

Bumble Bee

Posted in Uncategorized | Leave a comment

California’s Fake Temperature Record

Using my new tool set, I am homing in on what is wrong with the California temperature record.

NOAA Data

The first problem is just their usual data tampering, which doubles the slope.  This is what the raw data looks like.

But the real dirty trick is that they successively added four hot stations over time, which pushed the temperature up on the right side of the graph. Brawley was added in 1910, Blythe was added in 1913, Needles was added in 1940, and Death Valley was added in 1961. If those stations are removed, then California maximum temperatures show no trend.

The animations below show how the successive additions of those four stations completely changed the California temperature graphs, and perverted science.

Minimum temperatures have increased, and I suspect this is primarily due to Urban Heat Island effects.  I will be looking at this more soon.

The spike in 2014 was due to the El Nino, and primarily affected winter temperatures.  Without the four hot stations corrupting the trend, California summers have cooled sharply since the 1920’s.

Posted in Uncategorized | Leave a comment