
The Totos get their summer haircuts tomorrow.


The Totos get their summer haircuts tomorrow.
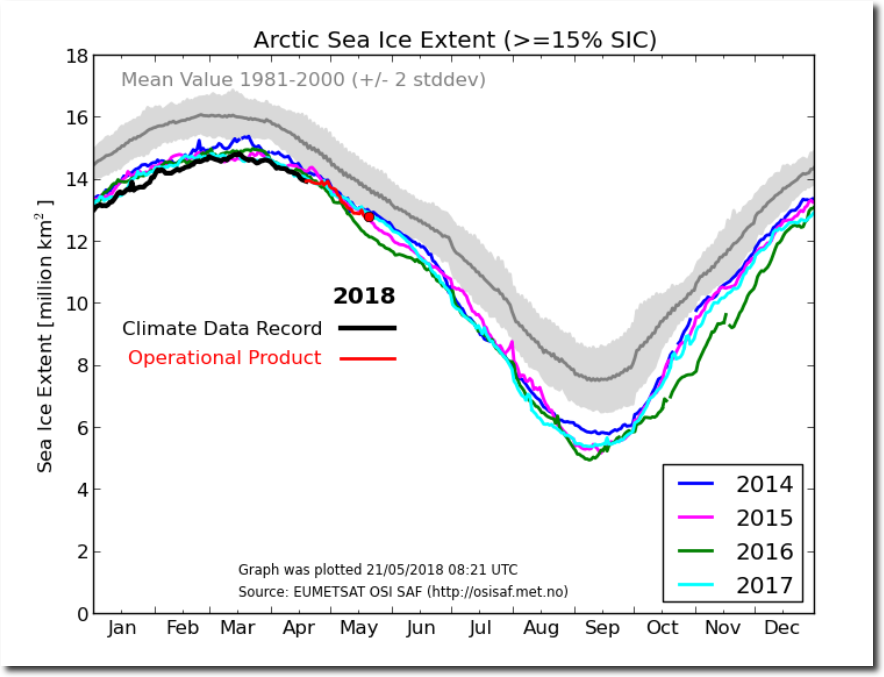
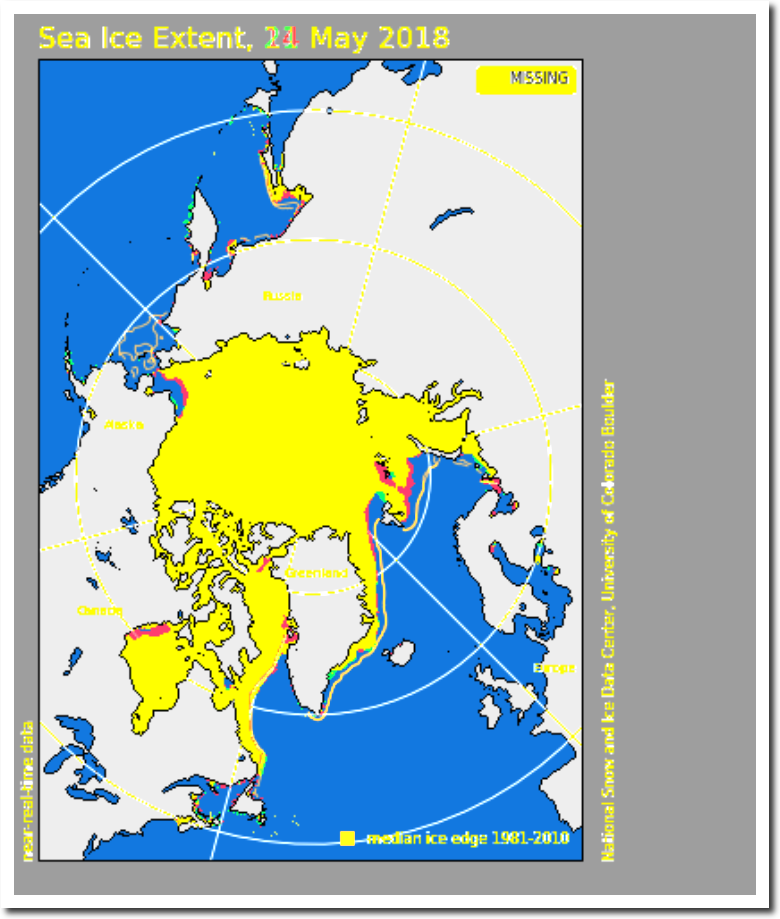
As I predicted at the beginning of the month, Arctic melt has been very slow this month and both volume and extent of Arctic sea ice are close to “normal.”
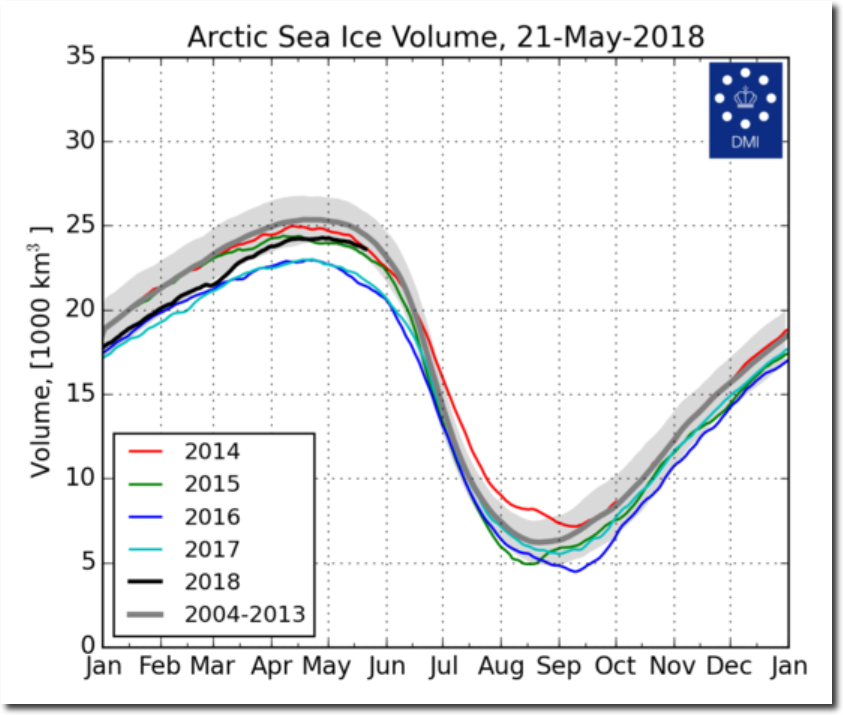
FullSize_CICE_combine_thick_SM_EN_20180521.png (1337×1113)
Ocean and Ice Services | Danmarks Meteorologiske Institut
There has been 1.7% ice extent loss over the past week.
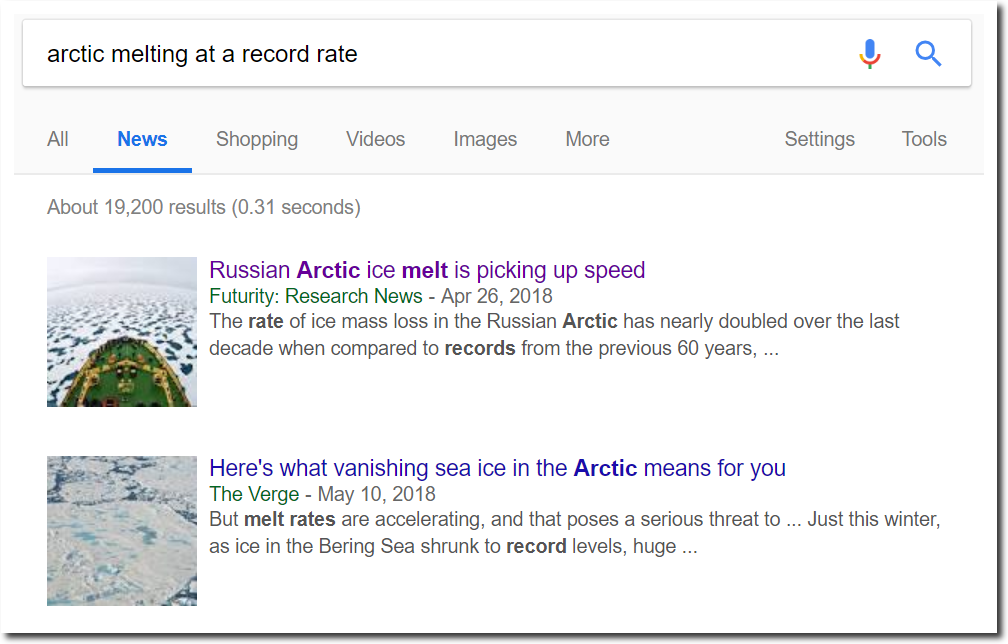
Meanwhile, the press is full of stories how the Arctic is melting at a record rate.
Since the year 1910. May 22nd temperatures at Lincoln, Virginia have dropped nearly 10 degrees. Lincoln is the closest Virginia USHCN station to Washington DC. On this date in 1911, Lincoln was 102 degrees. Today’s forecast maximum at Lincoln is 76 degrees.
Since the year 1900. May 22nd temperatures at Glenville, West Virginia have dropped more than ten degrees. On this date in 1902 it was 98 degrees at Glenville. Today’s forecast maximum is 75 degrees, twenty-three degrees cooler than 1902.
Prior to 40 years ago, 90 degree temperatures were common in Iowa on May 22, including 101 degrees at Logan, Iowa on May 22, 1925. Every location in Iowa was over 90 degrees that day. There haven’t been any 90 degree temperatures in Iowa on May 22 for over 40 years.
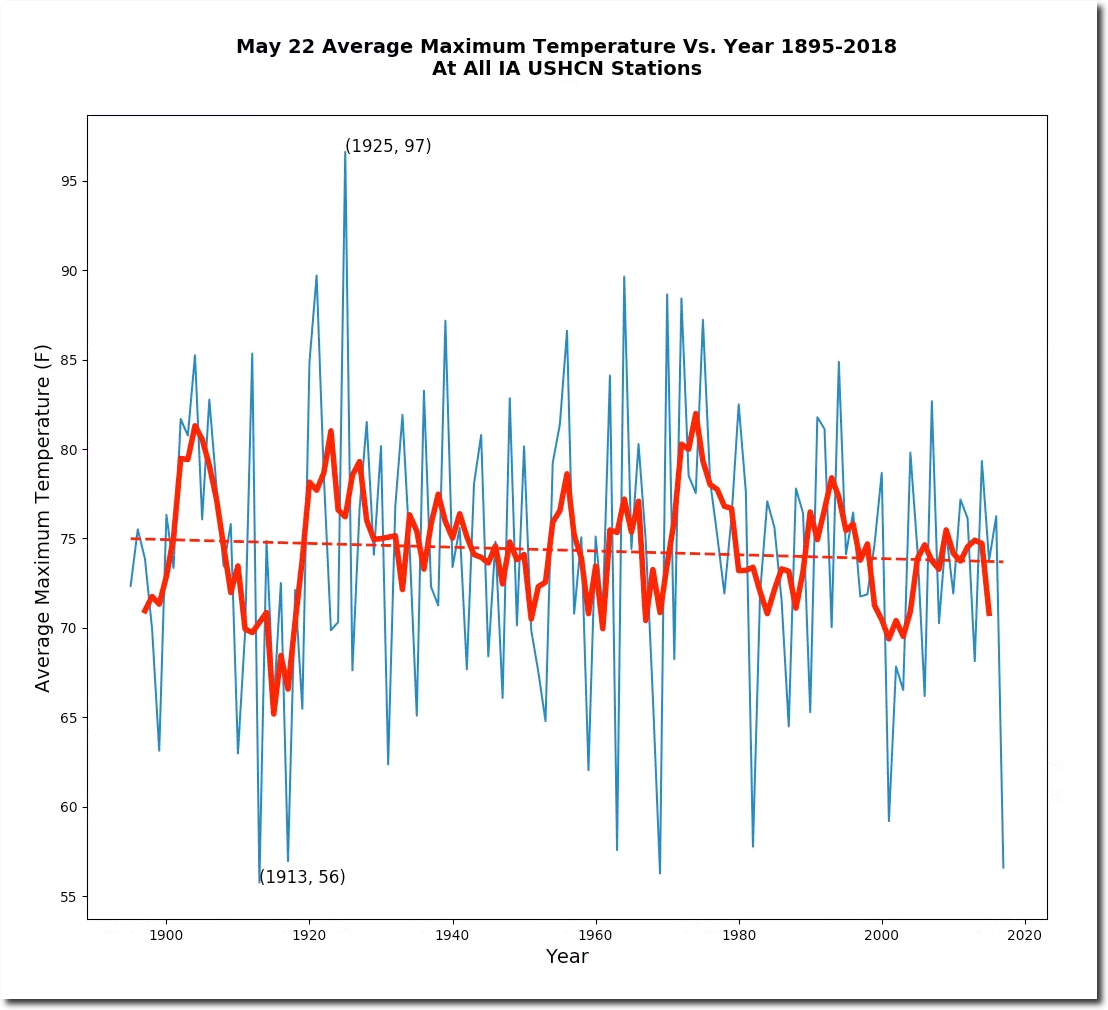
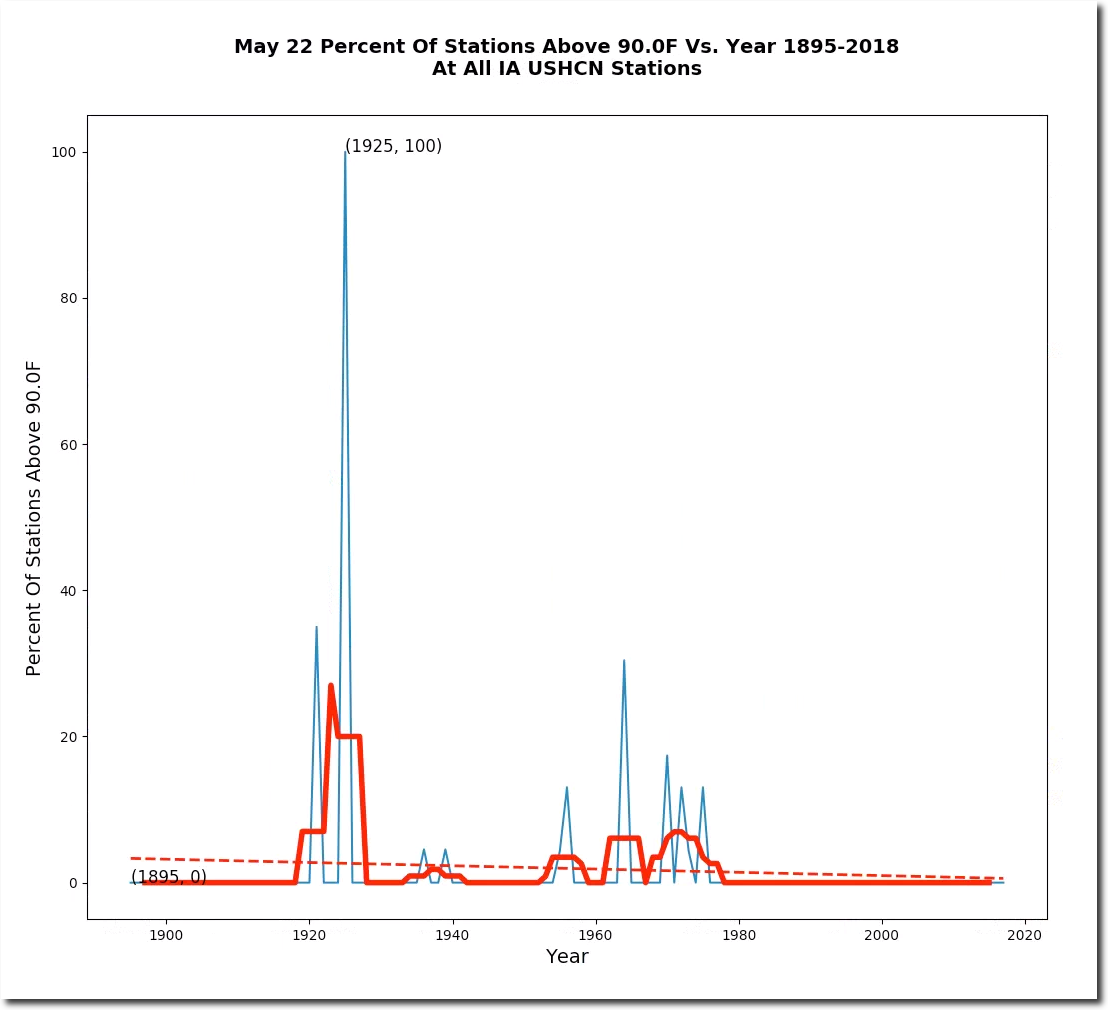
It was even hotter in Illinois on May 22, 1925 – when Danville reached 103 degrees.
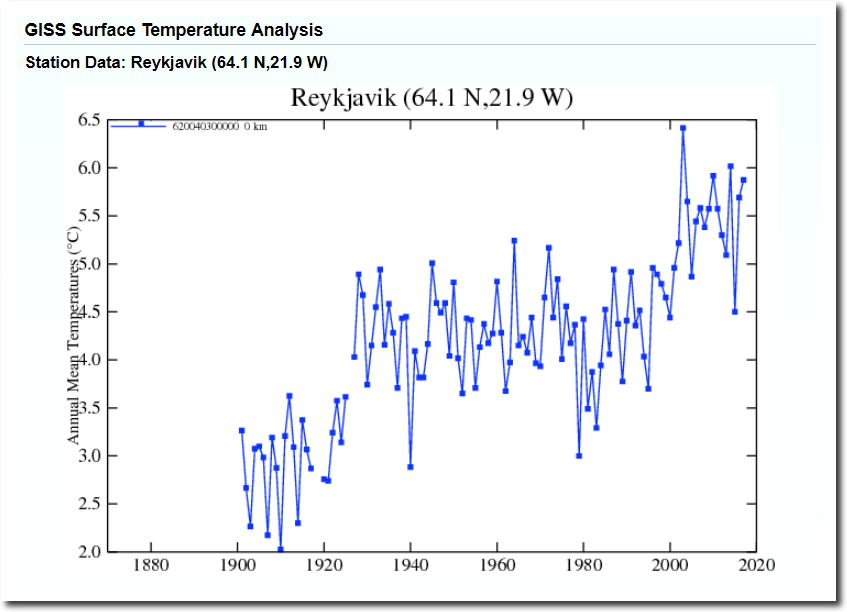
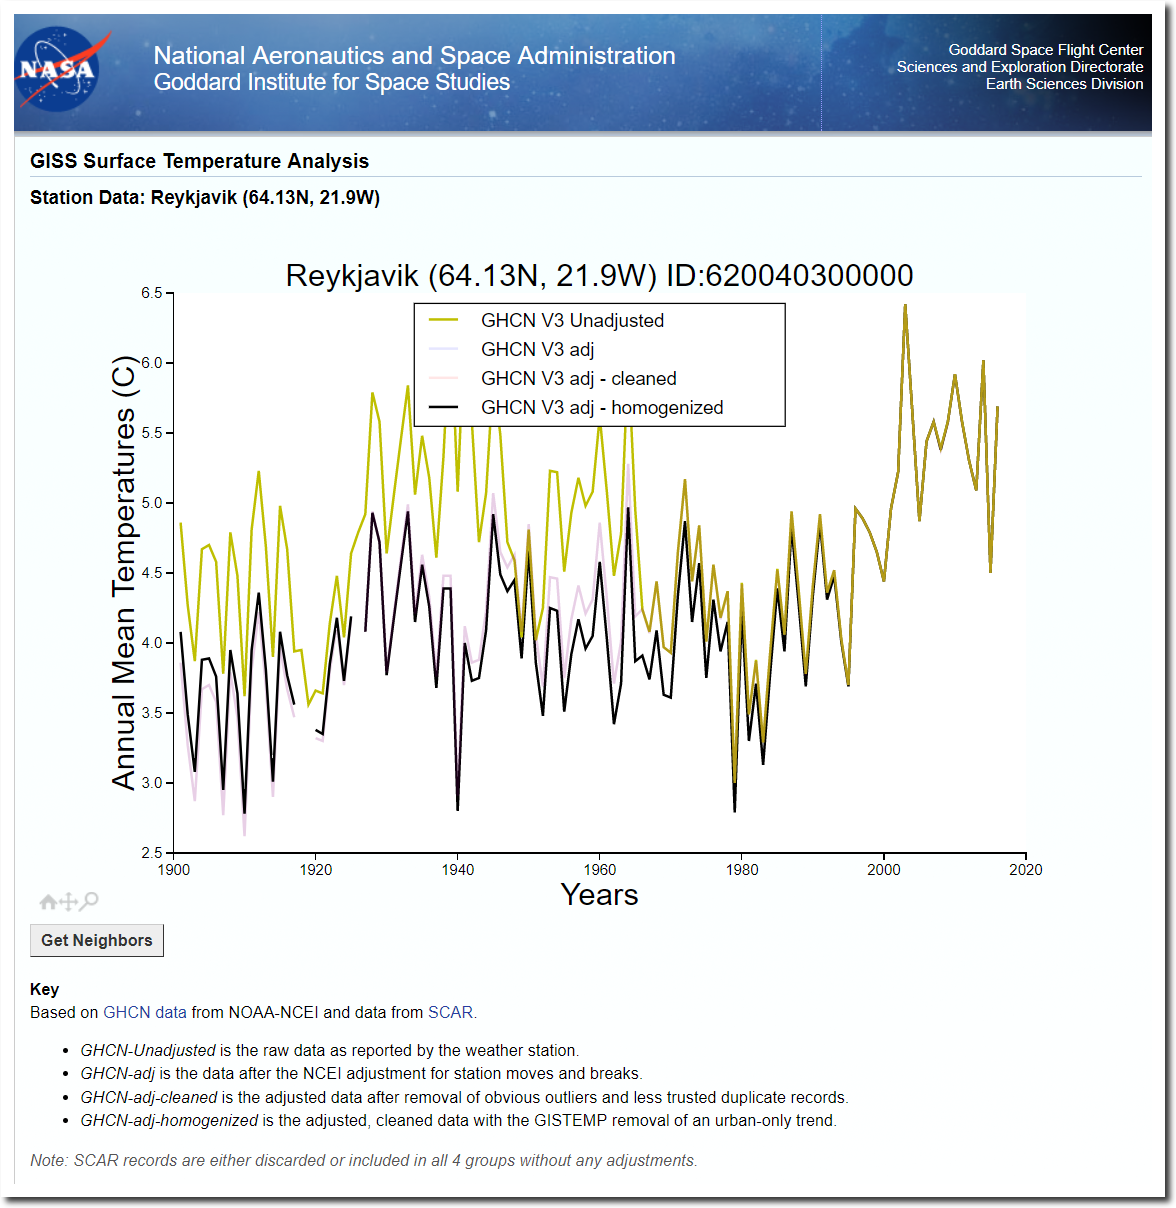
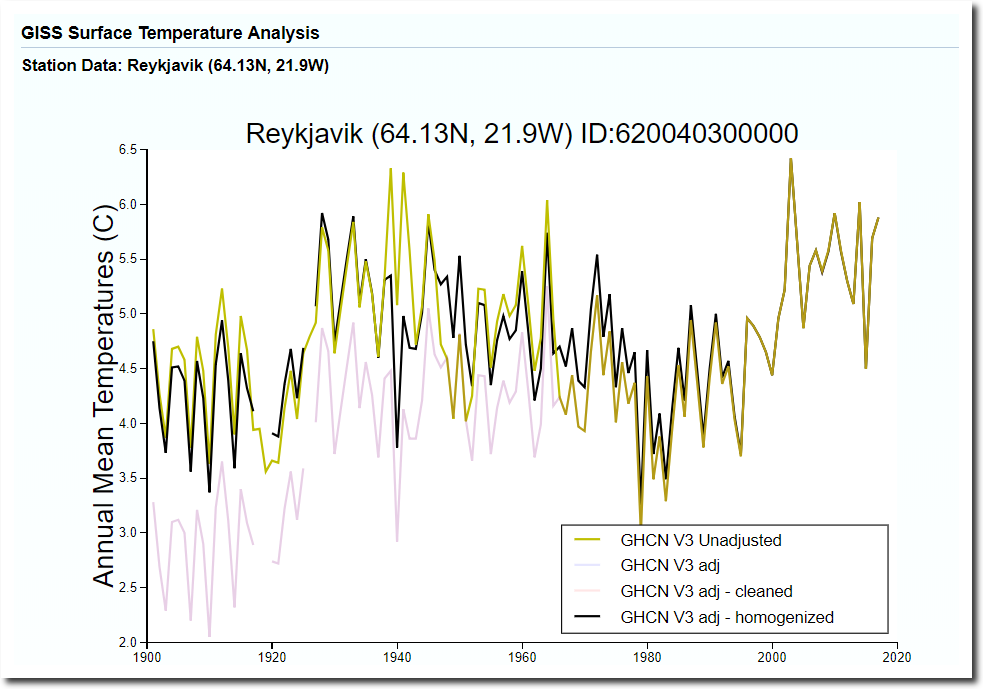
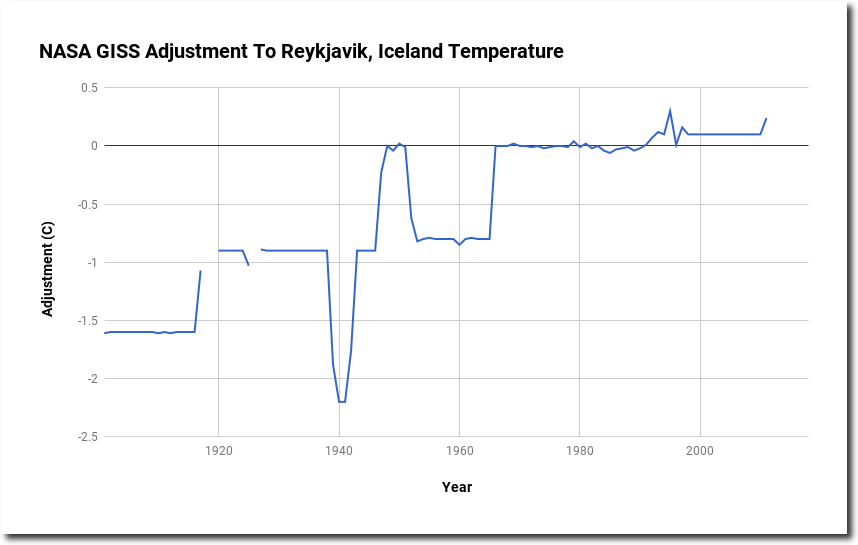
Settled science at NASA means constantly rewriting the past. Here are a few of the NASA Reykjavik, Iceland temperature graphs I have captured over the past six years.
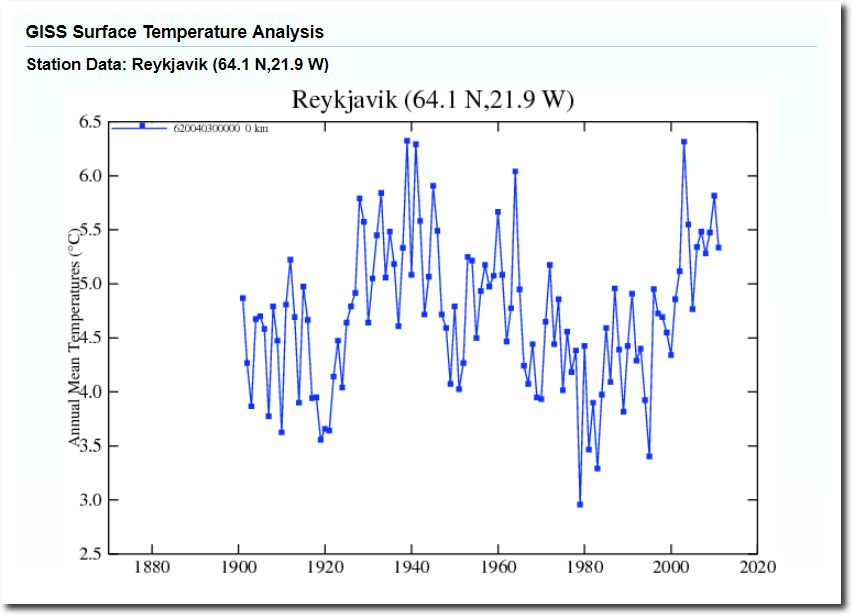
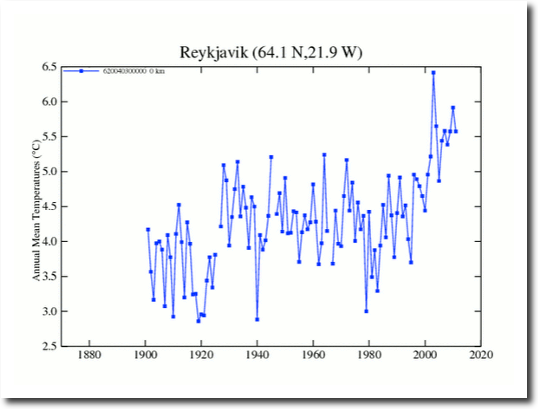
October 2017 V3 Measured Vs Homogenized
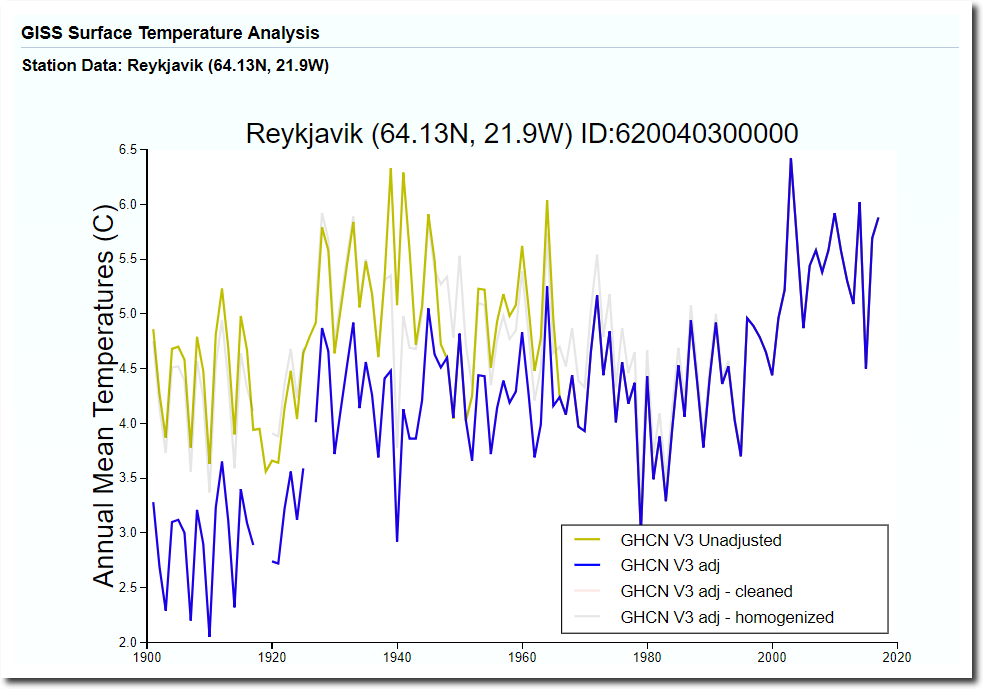
May 2018 Measured Vs. Adjusted
Before they tamper with the data, NASA’s “Common Sense Climate Index” shows the capital of Greenland much warmer from 1920 to 1960 than it is now.
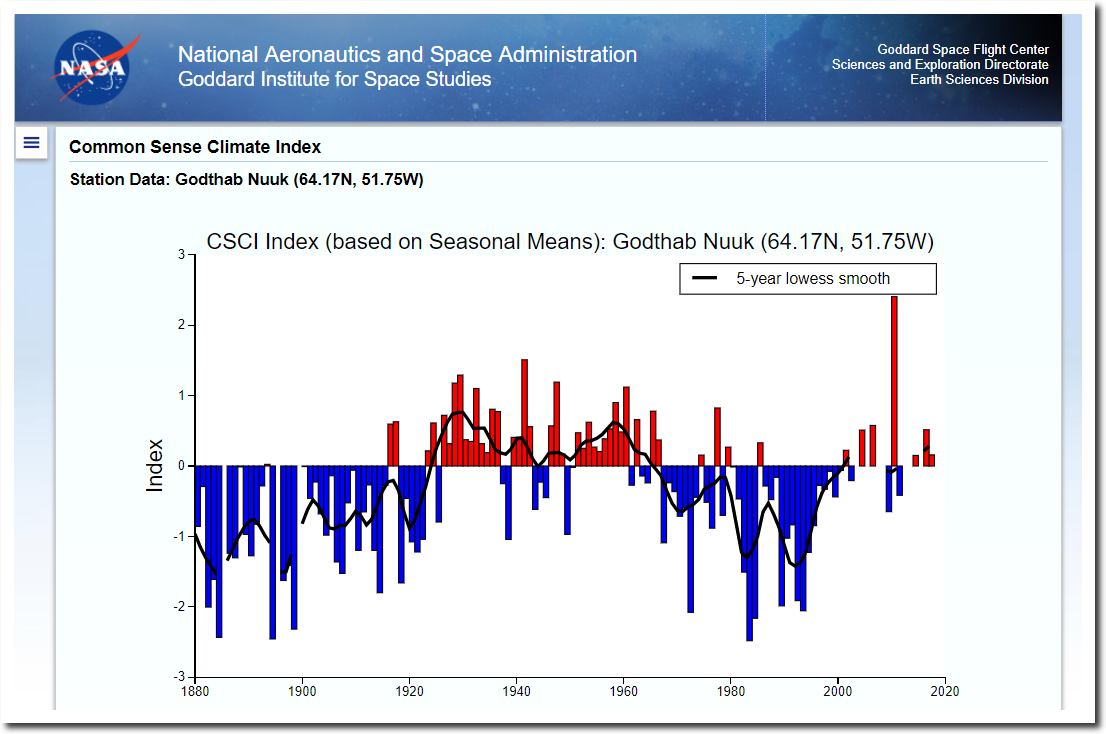
Data.GISS: Common Sense Climate Index
After data tampering, NASA has warmed up recent temperatures to be just as warm as 80 years ago,
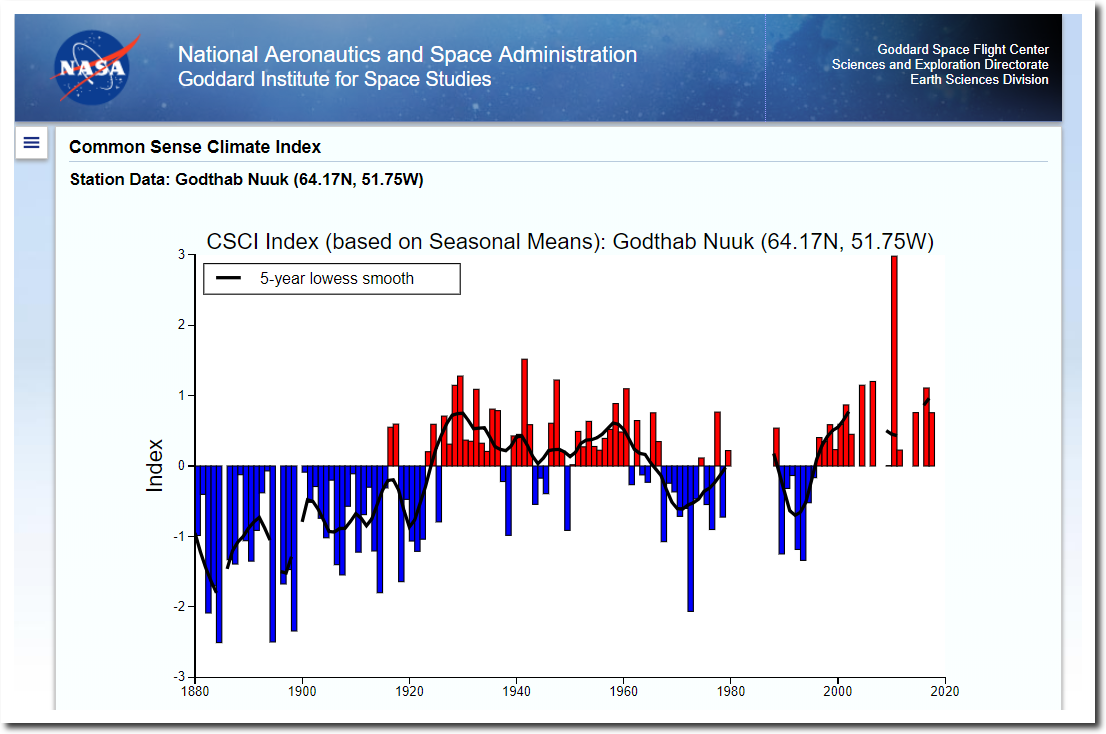
Data.GISS: Common Sense Climate Index
The historical record shows that common sense has no place in Gavin Schmidt’s office.
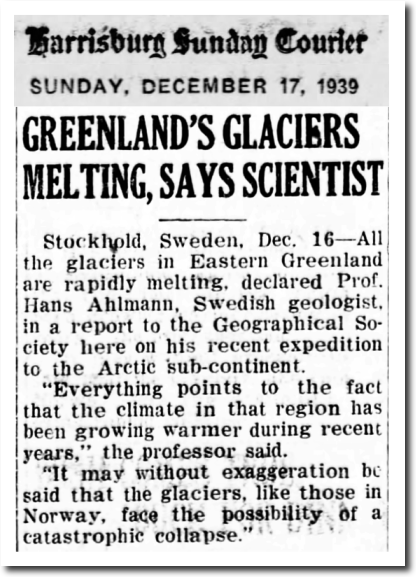
17 Dec 1939, Page 15 – Harrisburg Sunday Courier at Newspapers.com

The Arctic melt season in more than one-third over. Over the past week ice extent loss (red below) was 1.5%.
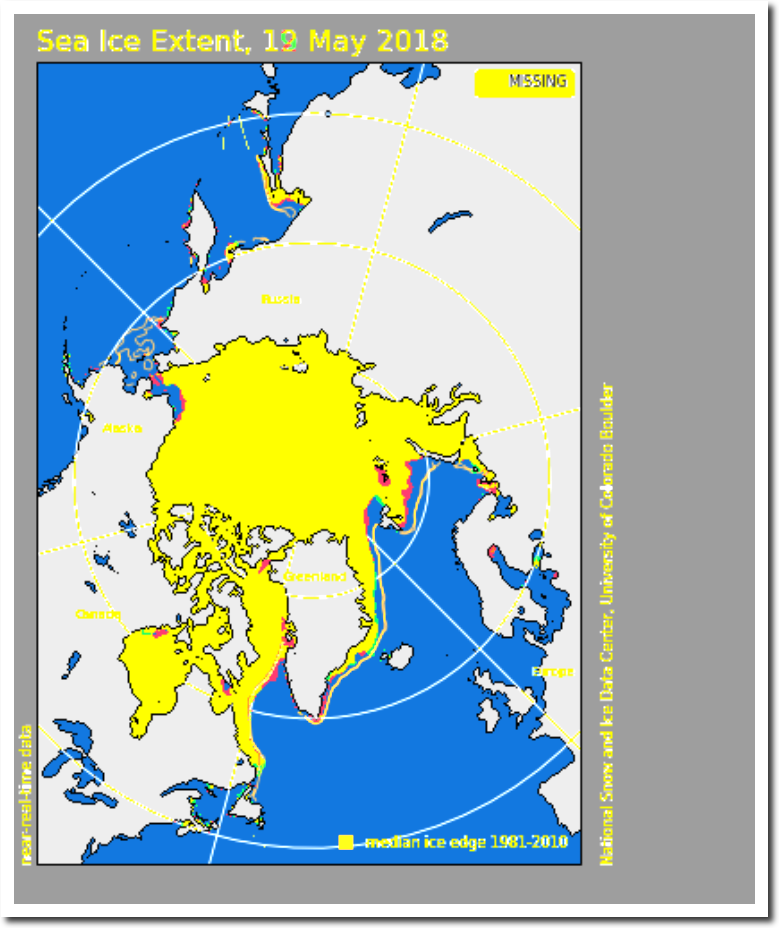
Arctic sea ice volume is normal. hardly changing, and tied for highest in the past four years.

FullSize_CICE_combine_thick_SM_EN_20180519.png (1337×1113)
Meanwhile, climate scientists continue to parrot the same lies and fraud they have been committing for decades, claiming that multi-year ice is disappearing.
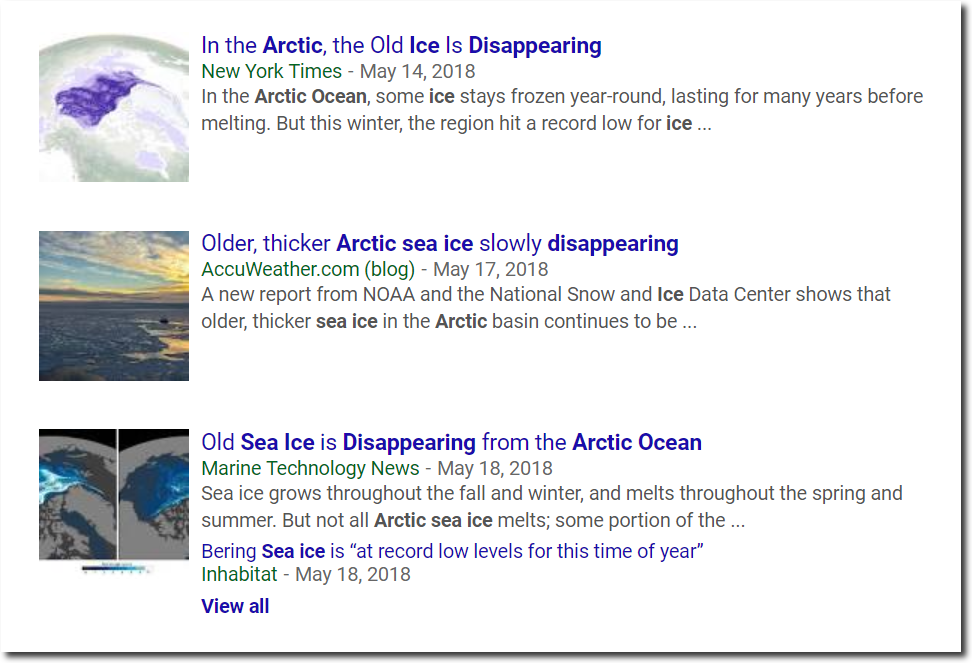
Nine years ago they said the multi-year ice was gone. How can something which has been gone for almost a decade be disappearing now?
Climate experts claim that Greenland is melting down at a record rate, and even faster than they thought.
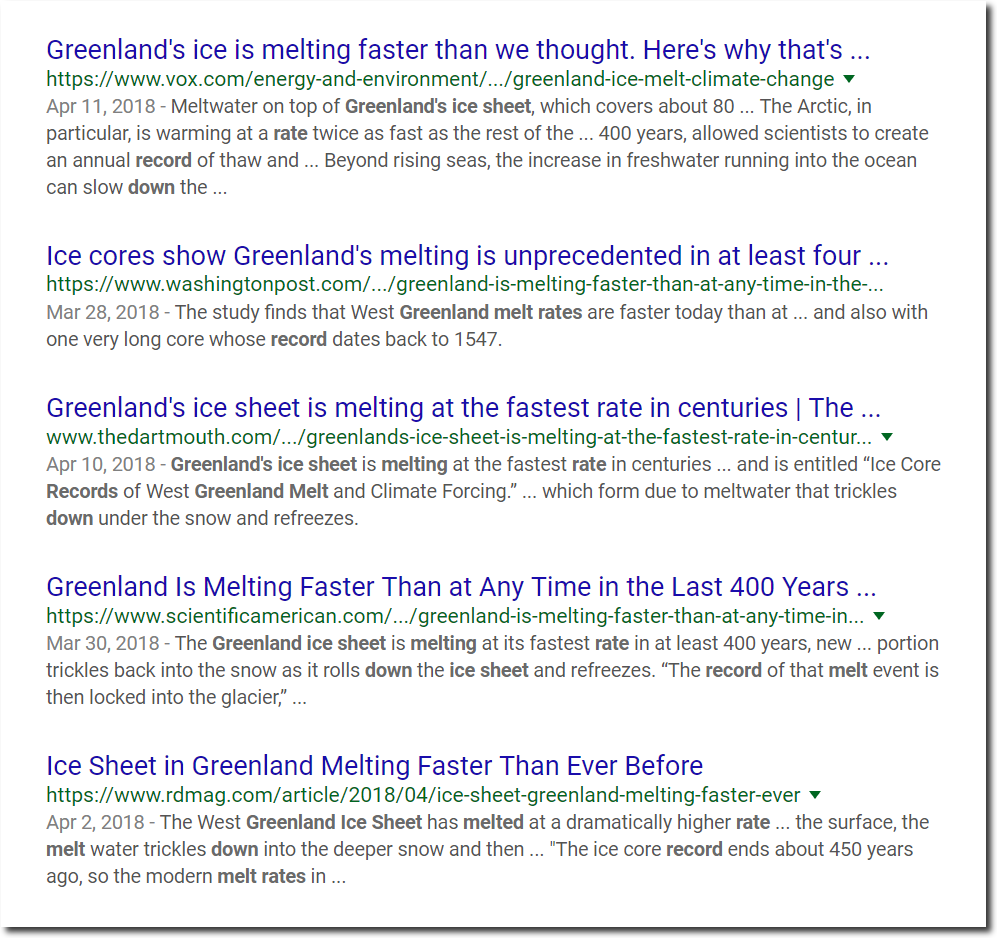
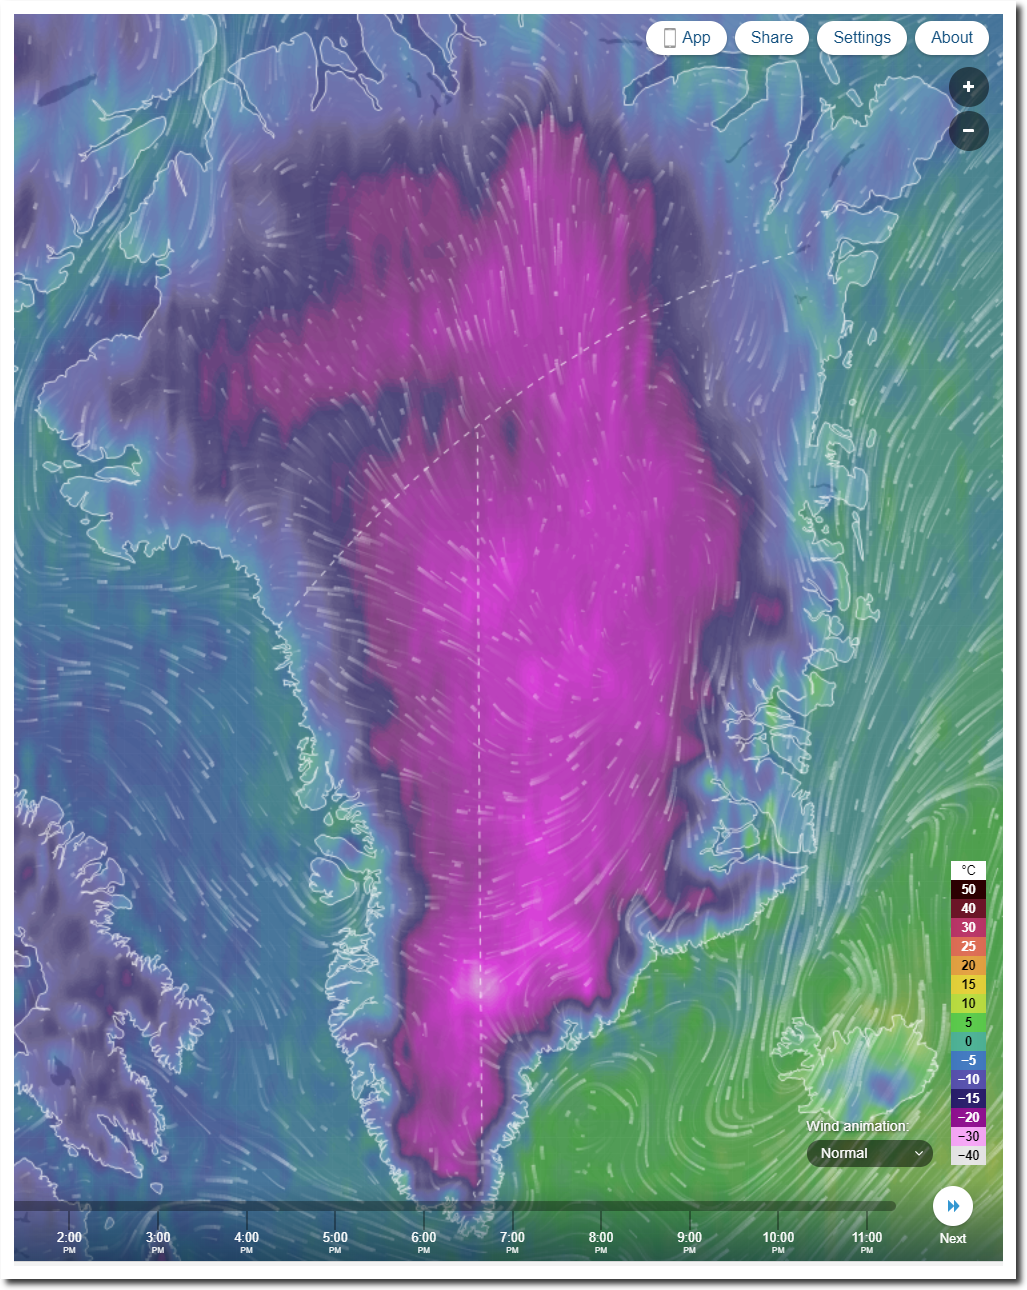
The reality is that Greenland isn’t melting down at all. Greenland is extremely cold.
Since September 1, Greenland’s surface has gained 550 billion tons of new ice. Daily melt has been below normal almost every day this year.
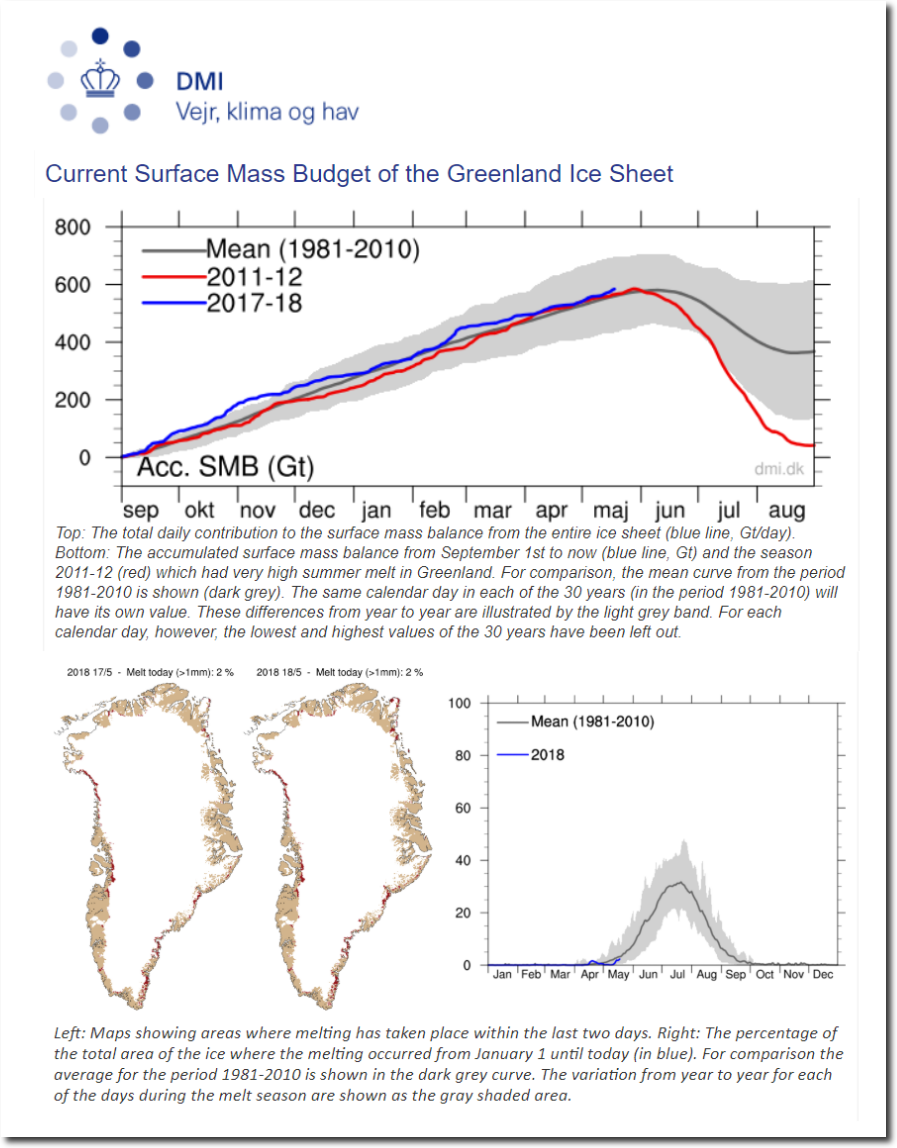
Greenland Ice Sheet Surface Mass Budget: DMI
Last year, Greenland’s surface gained 550 billion tons of new ice.
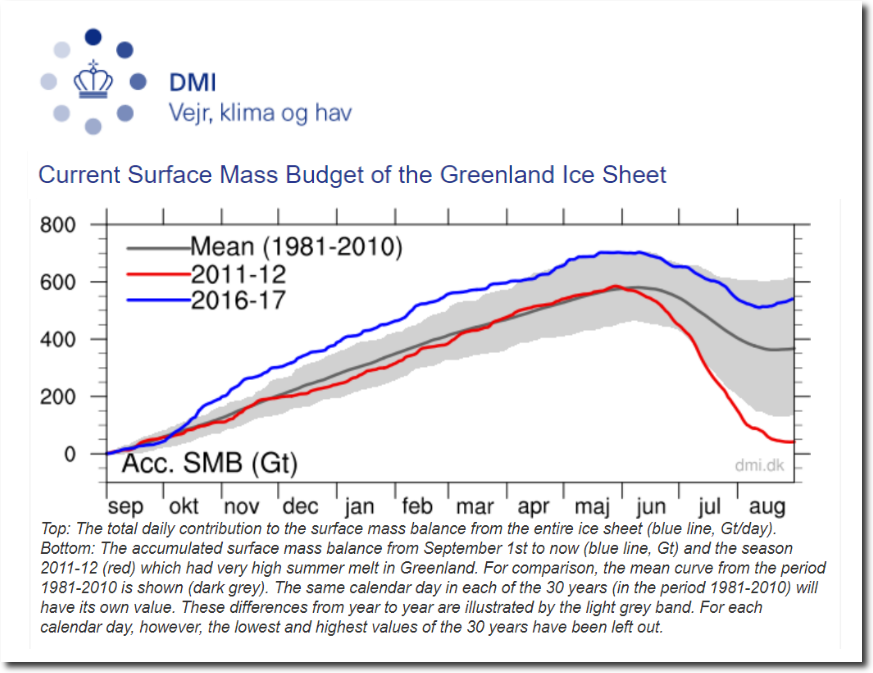
Greenland Ice Sheet Surface Mass Budget: DMI
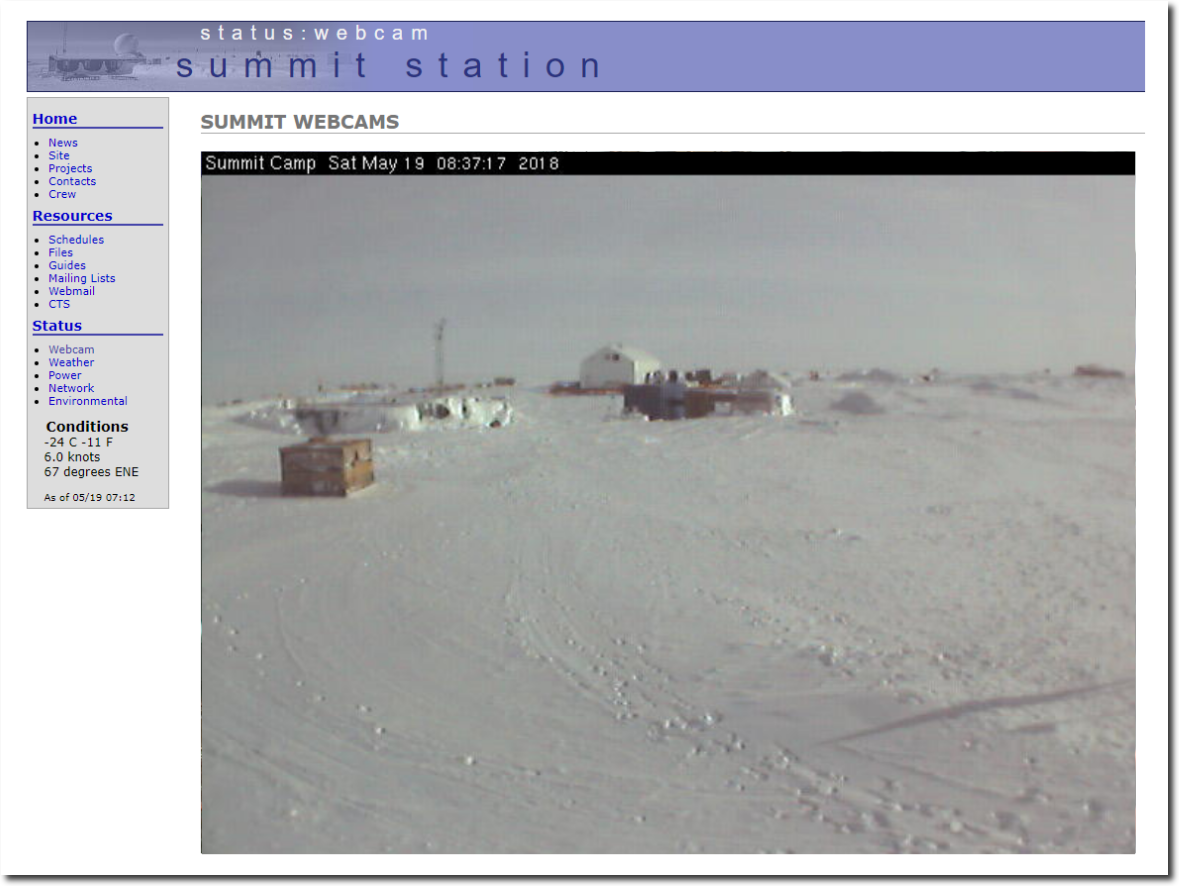
Both coasts of Greenland are cold and covered with snow.
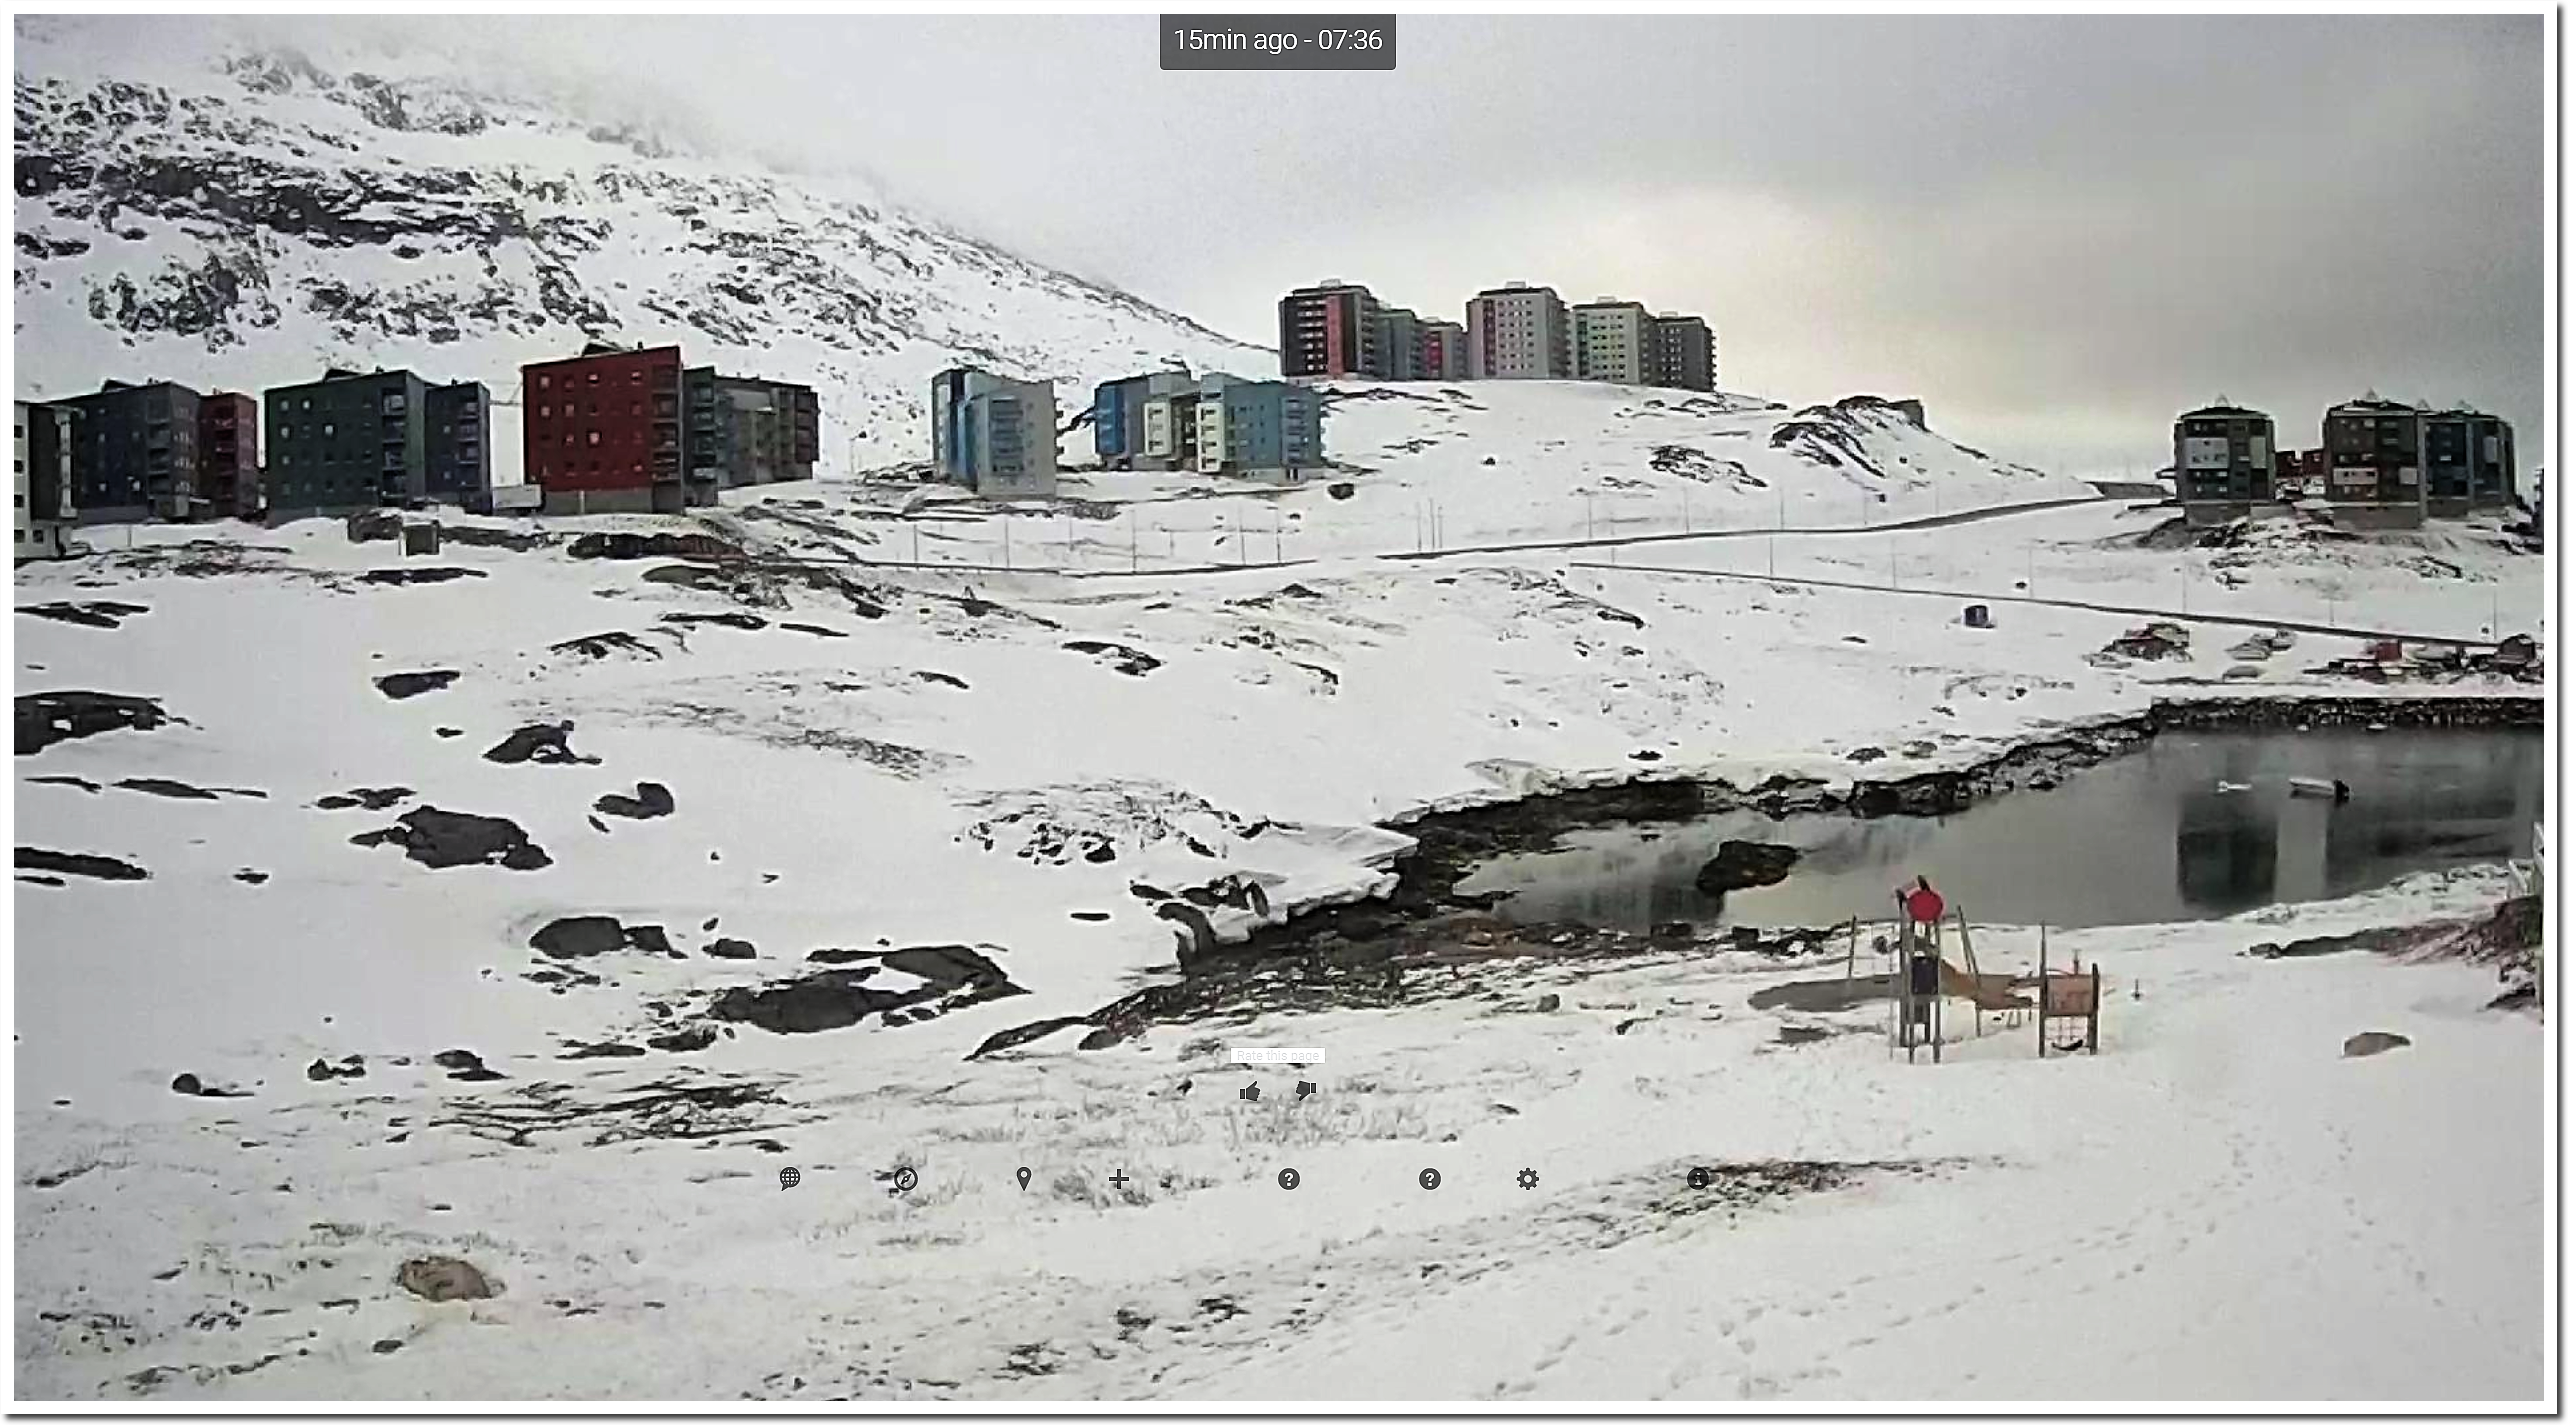

Temperatures are below freezing across the entire island.
Even the fraudsters at NOAA admit that Greenland gained ice last year.
Greenland Ice Sheet’s 2017 weigh-in suggests a small increase in ice mass | NOAA Climate.gov
Greenland’s largest glaciers are expanding.
Greenland’s glaciers weren’t always growing though. Eighty years ago they were melting rapidly and facing catastrophic collapse.
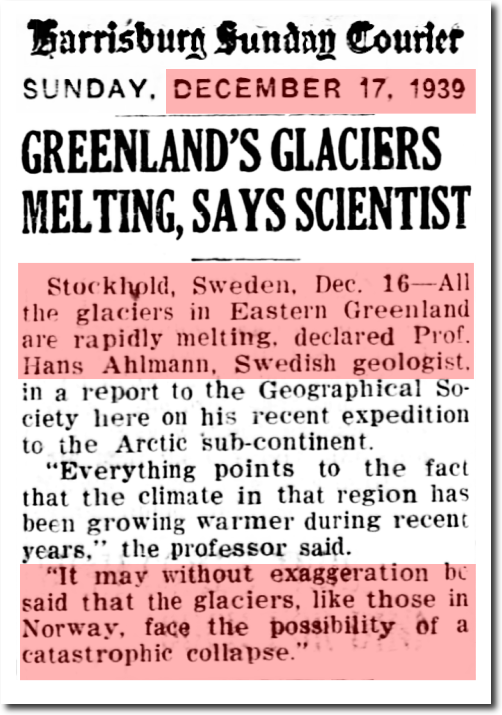
17 Dec 1939, Page 15 – Harrisburg Sunday Courier at Newspapers.com
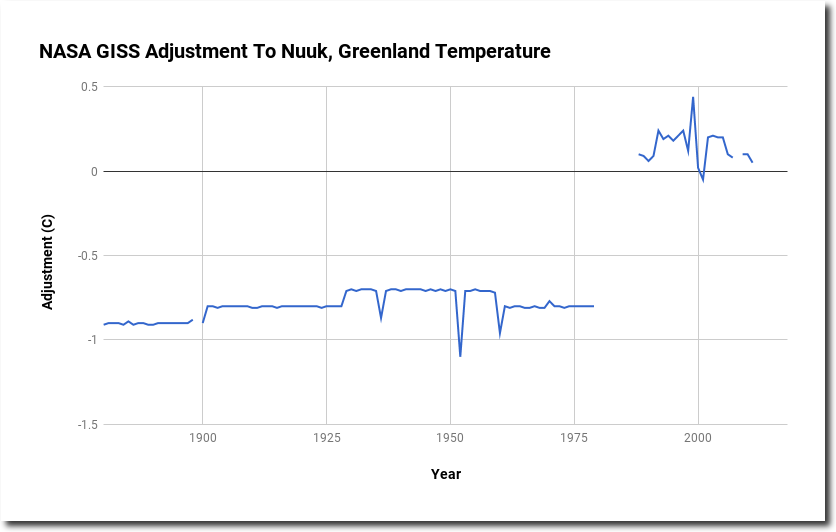
This prior warmth wrecked the global warming scam, so NASA and NOAA simply erased it.
NASA accomplished this fraud by increasing temperatures for almost all years above 350 PPM CO2, and decreasing temperatures for all years below 350 PPM.
They did the same thing at the capital of Iceland, although recent homogenization changes have brought it closer to the measured data.
The level of incessant lies and fraud from the climate science community has gone off-scale. These people are desperate to keep the funding for their scam alive.

