
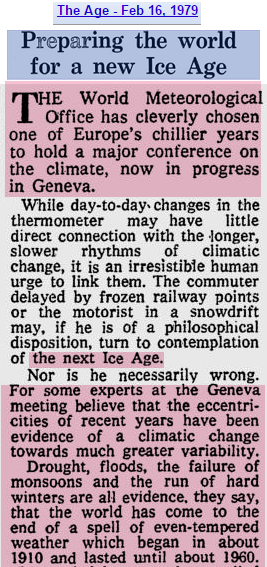
In 1979, the UN WMO was pushing the global cooling scam, and blamed droughts, floods and climate change on it.
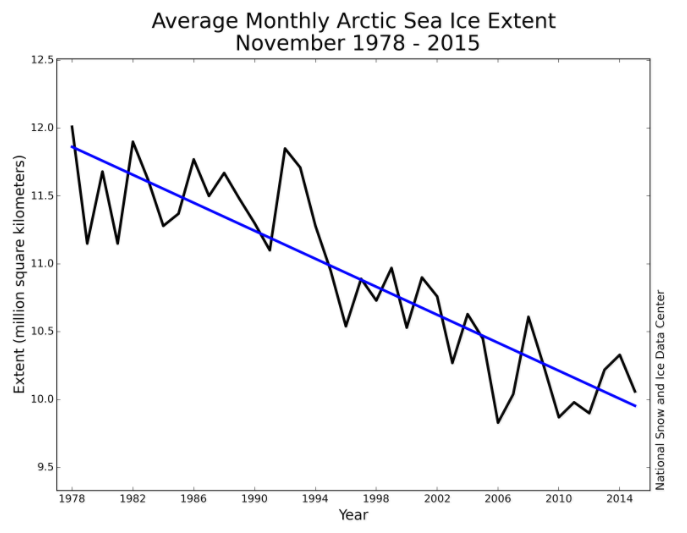
Climate scientists now cleverly start their graphs in 1979, and ignore earlier data.
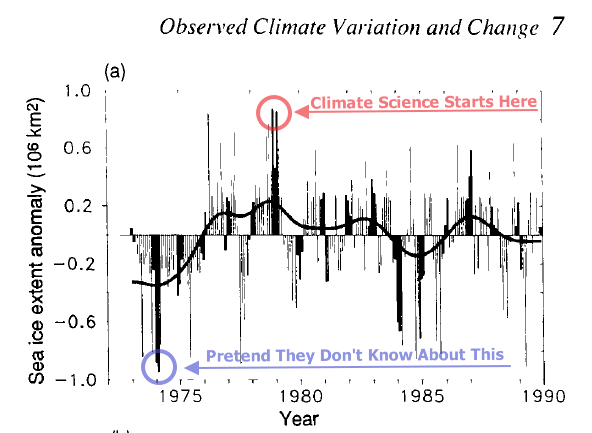
The 1990 IPCC report showed sea ice data back to 1973, which scientists have since erased.

Maybe a bit OT , but this article also highlights the COOLING from 1940-1980
http://www.dailywire.com/news/2071/most-comprehensive-assault-global-warming-ever-mike-van-biezen
Thanks Andy, that Professor did a huge amount of work. Glad he could get his hands on the original data.
Thank you, Steven, for giving the UN its due credit for several decades of climate propaganda.
You and your readers may appreciate Professor Nils-Axel Mörner’s paper in the Journal of Religious Studies, Buddhism and Living entitled: “The New Religion of Global Warming and its Misconception in Science.” – See more at:
http://crescopublications.org/journals/jbl/JBL-1-001.pdf
If I wanted to perpetuate a Hoax… I’d conveniently baseline at 1979 too… Deny previous cooling… And pay $$ massive grant money ONLY to those who.promote the scam….
Once started… I’d use this propaganda to enact my extreme left wing social policy.. On a global level…
But.. Since I’m not a huge control freak and narcissist.. I’m just interested in TRUTH and Real Science…
Great work digging up all these lies and hypocrisy Steven..
The information on this thread is terrific +10
Tony, you might want to add the wording also.
Changes and fluctuations in Arctic sea ice extent have been analysed by Mysak and Manak (1989); they find no long term trends in sea-ice extent between 1953 and 1984 in a number of Arctic ocean regions but substantial decadal time scale variability was evident in the Atlantic sector. These variations were found to be consistent with the development, movement and decay of the “Great Salinity Anomaly” noted in Section 7.7. Sea-ice conditions are now reported regularly in marine synoptic observations, as well as by special reconnaissance flights, and coastal radar. Especially importantly, satellite observations have been used to map sea-ice extent routinely since the early 1970s. The American Navy Joint Ice Center has produced weekly charts which have been digitised by NOAA. These data are summarized in Figure 7.20 which is based on analyses carried out on a 1° latitude x 2.5° longitude grid. Sea-ice is defined to be present when its concentration exceeds 10% (Ropelewski, 1983). Since about 1976 the areal extent of sea-ice in the Northern Hemisphere has varied about a constant climatological level but in 1972-1975 sea-ice extent was significantly less.
http://ipcc.ch/ipccreports/far/wg_I/ipcc_far_wg_I_chapter_07.pdf
About where we are now.
Great info to add.