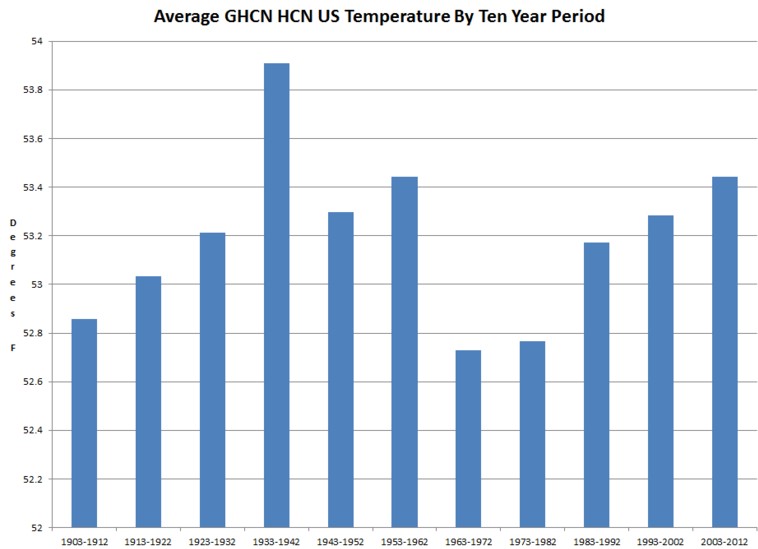
Untampered NOAA thermometer data shows that the past decade tied for the second hottest with the 1950s, and was much cooler than the 1930s. The pattern of warming is nearly identical to the first half of the last century.
Disrupting the Borg is expensive and time consuming!
Google Search
-
Recent Posts
- Gaslighting 1924
- “Why Do You Resist?”
- Climate Attribution Model
- Fact Checking NASA
- Fact Checking Grok
- Fact Checking The New York Times
- New Visitech Features
- Ice-Free Arctic By 2014
- Debt-Free US Treasury Forecast
- Analyzing Big City Crime (Part 2)
- Analyzing Big City Crime
- UK Migration Caused By Global Warming
- Climate Attribution In Greece
- “Brown: ’50 days to save world'”
- The Catastrophic Influence of Bovine Methane Emissions on Extraterrestrial Climate Patterns
- Posting On X
- Seventeen Years Of Fun
- The Importance Of Good Tools
- Temperature Shifts At Blue Hill, MA
- CO2²
- Time Of Observation Bias
- Climate Scamming For Profit
- Climate Scamming For Profit
- Back To The Future
- “records going back to 1961”
Recent Comments
- Bob G on Gaslighting 1924
- John Francis on “Why Do You Resist?”
- conrad ziefle on Gaslighting 1924
- Bob G on Gaslighting 1924
- Bob G on Gaslighting 1924
- Bob G on Gaslighting 1924
- conrad ziefle on Gaslighting 1924
- Bob G on Gaslighting 1924
- Bob G on Gaslighting 1924
- arn on Gaslighting 1924


And on January 15, 1932
Up to 2 inches of snow whitened the Los Angeles basin of California. The Los Angeles Civic Center reported an inch of snow, and even the beaches of Santa Monica were whitened with snow, in what proved to be a record snowstorm for the Los Angeles area.
Also 18 inches fell at Julian, 17 inches at Mt. Laguna, 14 inches at Cuyamaca, and 6 inches at Descanso, CA.
Remarkably in some winters it gets real cold even in the 1930s.
That was natural cold, but now we experience man made heat induced cold.
True.
The 1930s had some naturally weird weather.
Weird weather now is caused by republican gun owners being paid by exxon to think bad thoughts.
I want a bumper sticker that says that last one…
Watch out for bad data Steve… I’m noticing a few months with extra figures in the data, like “1127” instead of “112” (meaning 11.2°C)… I just happened to notice that when my macros bombed. There is a quality flag that is marked that I happened to pull in as well when doing monthly averages. I guess I’ll have to go back now and eliminate all of those and treat those as missing data.
What are you doing with the occasional missing day or bad quality point? I’m thinking I will set a limit of, say 2 missing or bad days per month. If it isn’t better than that I might throw the whole year out. Either that or or I might fill them in with an average of days close in time. Lots of bad data out there. 2012 especially. I’m wondering if missing days are being planted. October on is a mess.
Hi Steve,
When you say, “Untampered NOAA thermometer data”, are you refering to data before their early October 2012 conversion from USHCN Ver 2.0 to 2.5?
Tom Harris
No, that is a very small part of it. It is the adjustments going back to 2000.
So, the USHCN adjustments since 2000 are not valid in your experience? It would be great if you could lay out what they did since then and why it is not valid. Or have you already?
The adjustments they are doing are much larger than what they document
http://stevengoddard.wordpress.com/2013/01/12/noaa-temperature-fraud-expands-part-3/
What about the rest of the world?