Paul Homewood did some analysis of 100 degree days in the US last year.
NOAA Deception Over 2012 Heatwave « NOT A LOT OF PEOPLE KNOW THAT
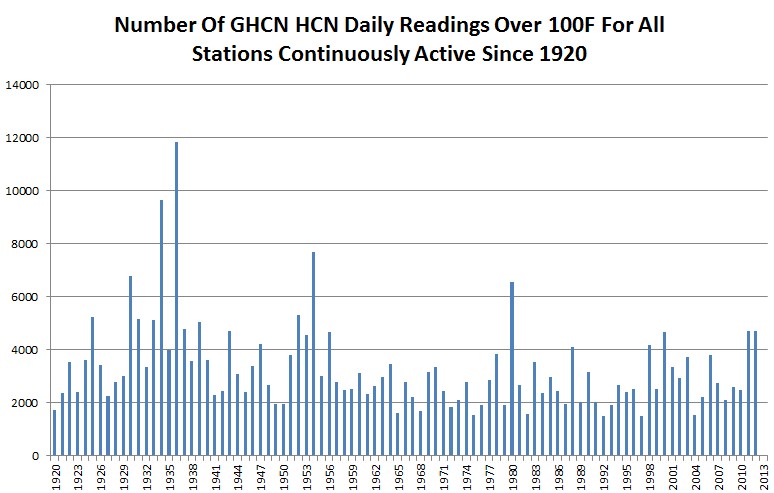
I expanded on that with a count of all 100 degree days at all GHCN HCN stations which have been continuously active since at least 1920. Last year didn’t rank in the top ten, and all of the top ten hottest summers occurred with CO2 below 350 PPM. There were almost 3X as many 100 degree readings in 1936 as there were in 2012.
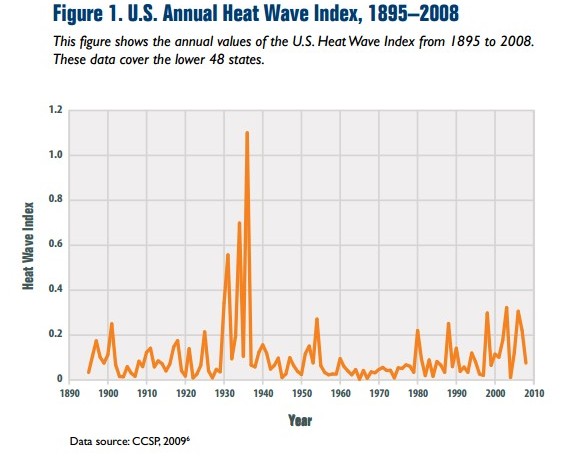
Note the similarity to the EPA graph below
www.epa.gov/climate/climatechange/pdfs/print_heat-waves.pdf
Bottom line – NOAA is attempting to defraud the public.


Good garden variety heat last summer.
Please provide a link to the data source from which the above graph, “Number of GHCN HCN Daily Readings Over 100F For All Stations Continually Active Since 1920” was generated.