


NCDC says that 1930s were the driest years, much drier than the present.
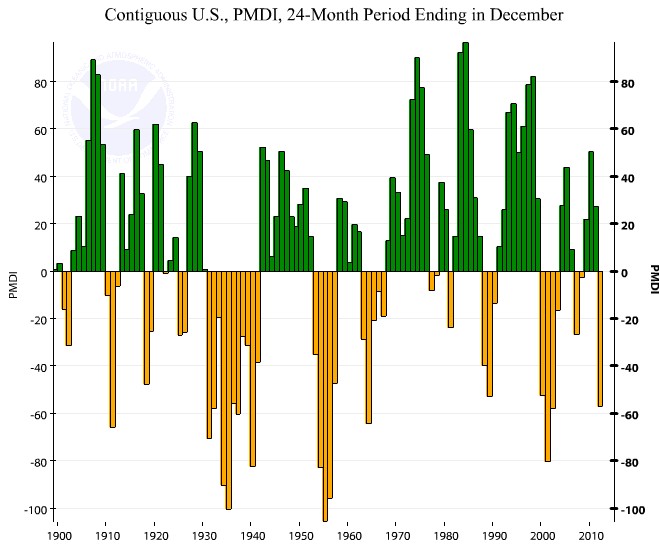
Contiguous U.S., Palmer Modified Drought Index (PMDI), 24-Month Period Ending in December, 1896-2012
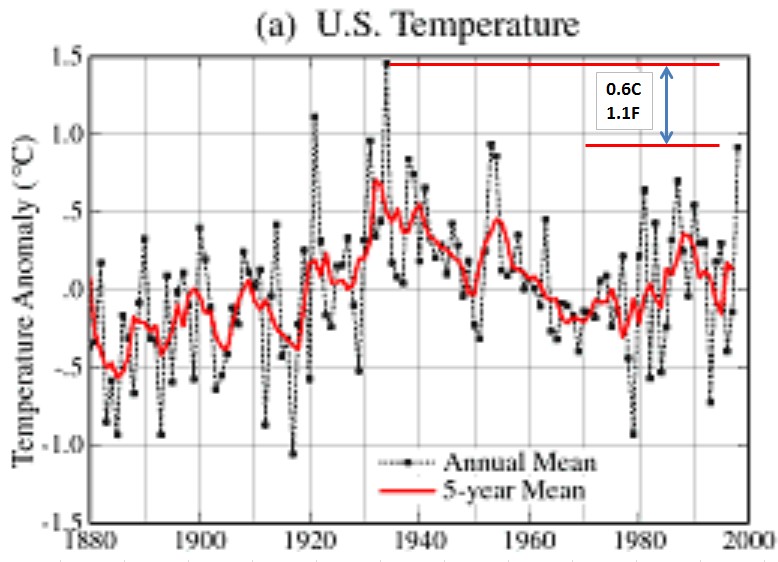
The EPA says that the 1930s were the hottest years

www.epa.gov/climate/climatechange/pdfs/print_heat-waves.pdf
NASA used to say that the 1930s were the hottest years, before they altered their data.
NASA GISS: Science Briefs: Whither U.S. Climate?
Hansen used to say that the 1930s were the hottest and driest years.
Empirical evidence does not lend much support to the notion that climate is headed precipitately toward more extreme heat and drought. The drought of 1999 covered a smaller area than the 1988 drought, when the Mississippi almost dried up. And 1988 was a temporary inconvenience as compared with repeated droughts during the 1930s “Dust Bowl” that caused an exodus from the prairies, as chronicled in Steinbeck’s Grapes of Wrath.
in the U.S. there has been little temperature change in the past 50 years, the time of rapidly increasing greenhouse gases — in fact, there was a slight cooling throughout much of the country
People who lived in the 1930s didn’t have any doubt.
![]()


![]()


http://news.google.com/newspapers


http://news.google.com/newspapers


http://news.google.com/newspapers

12 Apr 1935 – DUST BLAST AGAIN SWEEPS MID-WEST U.S.A. Last Hop…

29 Mar 1935 – CAUGHT IN DROUGHT CLUTCHES. Mountainous Columns …


Meanwhile The New York Times is blaming extreme cold weather on global warming:
“China is enduring its coldest winter in nearly 30 years… Eastern Russia is so freezing — minus 50 degrees Fahrenheit, and counting — that the traffic lights recently stopped working in the city of Yakutsk.”
http://www.nytimes.com/2013/01/11/science/earth/extreme-weather-grows-in-frequency-and-intensity-around-world.html?_r=1&pagewanted=all&
My dad, on a history vacation, sent me this:
“2 inches of snow on the ground this morning in Bethlehem. Not going anywhere. Everything stops. No school. No shops. No taxi. No walking. Everyone stays home.”
That’s what I thought. It was hotter in the thirties. So what’s the problem now? Nothing.
An another thing. All those WWF ads running about the vanishing Arctic Ice are bull, and they also fail to mention the record levels of Antarctic sea ice last year. And regarding the scourge of Polar Bear overpopulation check this unsettling 2 minute video out (caged filmmaker squares off with Polar Bear that wants to eat him): http://dvice.com/archives/2013/01/video-of-the-da-60.php
WWF, Greenpiss, Sealrria Clubers, are all the same. 😆
The average 10 year old has no knowledge of the 1930’s and thus is susceptible to brainwashing.
I see a strong correlation between the dry years and the hotter years. Could it be as simple as when there is less precipitation there are less cloudy days so your temperatures are higher due to more sunshine. 2012 was one of those, less rain, less t’storms, more sunny days, more heat. That simple. The jet-stream controls all this. Temps. and weather usually balance out if you look at the entire surface. If it is extreme in one way or another in one place it is usually as extreme in an opposite way in another local, it all balances out, just not in the same location. My research has found a direct relationship between surface changes from man that has changed the temperature differentiations from a century ago. In my opinion it is even wrong to compare data over the last century since there has been so many changes on the face of the Earth,ie; urbanization (however, the Earth land mass is still only 3% urbanized), pavement (nearly enough to cover Florida if you put it all together), reforestation ( in 1920 much of the Eastern 1/3 of the country was reduced to 20-30% forest, much of that has been reforested, Vermont went from 20% to 80% today), the huge corn crop (96 million acres in 2012)–25 million for ethanol for fuel–that much corn transpires enough to fill Lake Champlain 11/4 times, approx. 9 trillion gals. Think that could have added to the rain from hurricane Irene Aug.2011? Contrails from air traffic creates clouds which alters cloud cover when temp. and rel.-humidity are right. Even the amount and composition of the dust in the atmosphere and where it settles. Without attributing certain amounts of climate changes to each possible contributor and only to CO2 is a false conclusion when studying climate change. There is much more I could say about this but this may make someone think a little about alternative contributors to the changes occuring today. Good Night [email protected]