
Essentially all climate data has been tampered with and inflated over the last decade.
In the 1990 IPCC report, they showed 10 cm rise in sea level over the previous century.
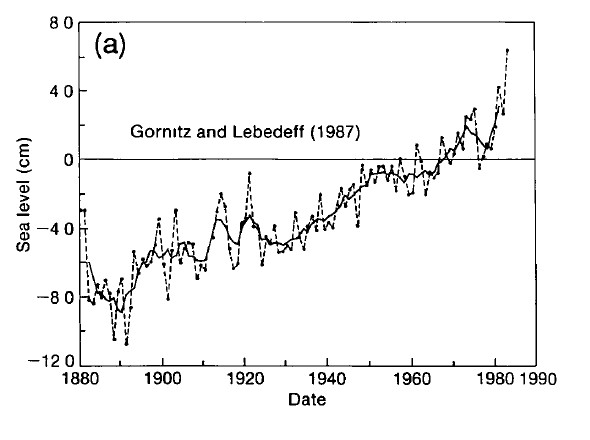
But recent literature propaganda shows almost double that rise over the same time period.
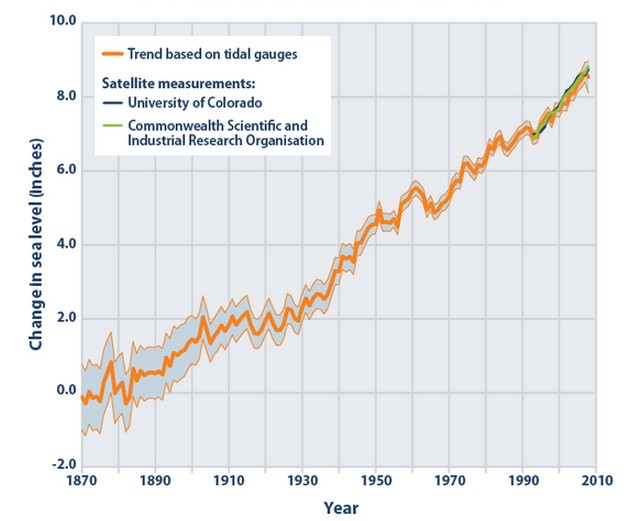
The graph below superimposes the current tampered data, on top of the 1990 IPCC data. Note that the current cheat begins at about 1920, and increases over time.
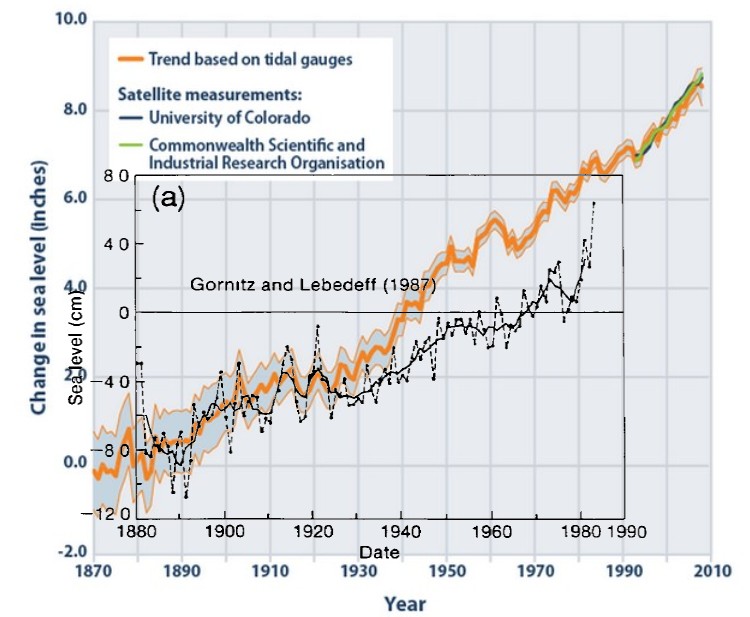
The historical tide gauge data hasn’t changed – just the willingness of the climate science community to prostitute themselves for money.
President Obama says that anyone who doesn’t believe these scumbags is an enemy of the state, and that he is willing to wreck the Constitution over their fraudulent data.
Call up your Congressman today.

We’ll all virtually die – virtually boiling away in the hypothetical hot water.
This post made me do just a little research and find another on WUWT (from Sept. 13, 2012; “Sea Level Acceleration: Not so Fast Recently”, http://wattsupwiththat.com/2012/09/13/sea-level-acceleration-not-so-fast-recently/ ), with an interesting bar graph showing decadal rises included. The peak was 1996-2005 at about 3.9 mm/yr; for the decade 2002-2011, that has dropped linearly to abour 2.25 mm/yr.
Call me crazy, but those values don’t seem to agree with NOAA.
Reblogged this on The Next Grand Minimum.
Lets rack our heads deeply about the sea level data. Let’s keep analyzing and putting the data in spreadsheets and super computers, reworking and revising, figuring and refiguring.. until the cows come home. And hopefully someday we can get to the bottom of what the sea level actually is.
OR, we could just go down to the beach. And take a look! A crazy idea.
I think you know what I’m expecting you to see.. as far as the sea. The sea level hasn’t changed, in terms of what you can see, it hasn’t changed in decades. Find confirmation from real people, or yourself if you’re old enough. Or real photos. Before and after. Decades. The same.
Now wait. It hasn’t changed in terms of what you can see, but it has changed, because the data shows that it has. Yeah, right.
What do you do when your superduper computer models and readouts don’t jibe with real-world observations? Ignore or dismiss reality? It seems so in the world of climatology, which is fast approaching the status of “junk science.”
As Nobel Prize physicist Richard P. Feynman once wrote: “It doesn’t matter how beautiful your theory is, it doesn’t matter how smart you are. If it doesn’t agree with experiment, it’s wrong.”
Eric, I have lived in San Diego and been going to the beachs and bay here for 56 years. I remember the tide pools well for the past 46 of them. I have observed zero change here. Not sure I would have noticed a few inches either way, but I have seen none.
La Jolla Cove hasn’t changed in 140 years
Neither has Fort Denison in Sydney Harbour.
Maybe the latest propaganda is intentionally mixing up metric and imperial measurements after 1920 to get the chicken littles to start clucking?
It’s still a mystery why this evidence doesn’t find itself presented as ‘exhibit A’ M’Lud. The silence and refusal to investigate these claims from our so-called leaders is deafening.They cannot close their eyes forever.
It is only a mystery if you think that our so-called leaders are working for our common good. Once you admit that they are part of the scam, the lack of action is perfectly understandable.
Quite so, however in every generation there’s supposed to be an Elliot Ness or Frank Serpico, who eventually bust the institutional corruption. Where are todays hero’s?
I can vouch for Sydney foreshore as well. Used to play in the rock pools as a child. 40 years later the rock pools are still there exactly as they’ve always been. But given the tides, there could be an inch or two difference. Hard to say. If things are changing they are changing incredibly slowly.
Here’s a good one I saw recently (note the last line on the image of the page):
http://blogs.news.com.au/images/uploads/climatedept2.png
http://kiallfrost.com.au/bar-beach-panoramic-landscape-photos-bar-beach-photo-newcastle-landscape-photos/
This iconic scene from the car park at Bar Beach, Newcastle hasn’t changed in over 50 years apart from the old surf clubhouse being removed. The concrete bar and the rocks adjacent have not changed at all. The high tide water level is the same. The headland from where the picture is taken has erosion of the soft shales and mudstones due to wind. I first went there when I was 5 and it’s the same.
If rapid sea level rise was a problem, the suburbs of Dixon Park, the Junction, Hamilton South and Merewether would be stuffed (50,000 people). Sea level rise is either not happening or is so miniscule it’s not a problem, so the people living there are some of the luckiest people in the world. It’s also one of the best beaches in the world, clean water and clean sand. Check it out sometime.
The sea levels in the Pacific around Tuvalu and Kiribati only show rises in the recent record (since 1992) because of the massive El Niño in 1998 which reduces the sea level in the Western Pacific. Before and after this El Niño, the level is pretty stable. Ie almost no trend at all. The official BOM data actually shows a slight negative trend in these two locations since 2000/2001.
https://eyesonbrowne.wordpress.com/2012/11/26/is-tuvalu-sinking-yet/
JTF
http://ptwc.weather.gov/
This is dangerous sea level rise in the Pacific, especially number 2 in the Solomon Islands
I wish I could remember the climate book I read, but the author was a geologist and he discussed this in geological terms and times. He made a number of interesting points:
1. More than 85% of volcanoes are under water. Nobody has a clue what they are doing; how they warm the ocean, how many different gasses are dissolving into the ocean waters at the tremendous pressures or how they change the shape of the sea floor.
2. Because of plate tectonics and other actions, the seafloor shape is constantly changing. Imagine a bowl of soup as you change the shape of the interior of the bowl. Will the level rise or fall?
3. Because of the same shape changes, the sea may appear to be rising, but it is really the land falling. This gives the climate zealots ammunition to feed to a clueless, corrupt and compromised media to report “sea level rise”. Of course, other areas of the planet are rising, leading to sea level “falling”, but that piece never gets reported.
4. Much of the “rising sea level” has nothing to do with ice melting. It is thermal expansion driven by external warming, an EFFECT, not a CAUSE. This is most likely caused by the changing solar magnetic field, which in turn causes changes in cloud coverage, which in turn most likely causes most of the warming, or cooling observed (as opposed to conjured up in defective climate models). This is detailed in The Chilling Stars by Henrik Svensmark and confirmed (but hidden) last year in an experiment at CERN.
Gary
I see your 40 to 60 years and raise you to 1698
Check out these maps From – A New Mapp of Carolina ’1698? – http://dc.lib.unc.edu/cdm4/item_viewer.php?CISOROOT=/ncmaps&CISOPTR=115&CISOBOX=1&REC=5
And – An Accurate Map of North and South Carolina With Their Indian Frontiers, Shewing in a distinct manner all the Mountains, Rivers, Swamps, Marshes, Bays, Creeks, Harbours, Sandbanks and Soundings on the Coasts, ’1775? – http://dc.lib.unc.edu/cdm4/item_viewer.php?CISOROOT=/ncmaps&CISOPTR=125&CISOBOX=1&REC=15
Both from NC Map
Compare with google maps – with Abermarle Sound, NC
With 300 years you can still see the same features.