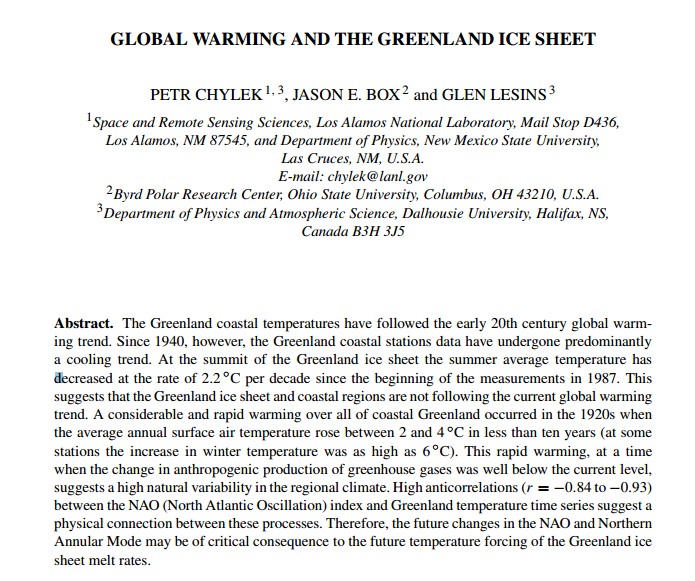
Since 1940, however, the Greenland coastal stations data have undergone predominantly a cooling trend. At the summit of the Greenland ice sheet the summer average temperature has decreased at the rate of 2.2?C per decade since the beginning of the measurements in 1987. This suggests that the Greenland ice sheet and coastal regions are not following the current global warming trend
Disrupting the Borg is expensive and time consuming!
Google Search
-
Recent Posts
- One Atomic Bomb Per Hour
- New Video : Analyzing Oil And Gas
- Is Antarctica Melting?
- High Speed Analysis And Visualization
- El Nino To The Rescue?
- Fake News Update
- Growth Of Antarctic Sea Ice
- 65 Years Of Progress!
- El Nino To The Rescue?
- Worst March Drought On Record
- ChartGL Process Control Demo
- The Biggest Money Laundering Scam
- Drought In The Headwaters Of Lake Powell
- Unrealistic Expectations Of Water Availability
- Did Bill Gates Do This?
- Worst March Drought On Record In The US
- The Real Hockey Stick Graph
- Analyzing The Western Water Crisis
- Gaslighting 1924
- “Why Do You Resist?”
- Climate Attribution Model
- Fact Checking NASA
- Fact Checking Grok
- Fact Checking The New York Times
- New Visitech Features
Recent Comments
- Bob G on One Atomic Bomb Per Hour
- Crispin Pemberton-Pigott on One Atomic Bomb Per Hour
- william on 65 Years Of Progress!
- arn on One Atomic Bomb Per Hour
- Gordon Vigurs on One Atomic Bomb Per Hour
- Bob G on One Atomic Bomb Per Hour


Typo Correction:
“…are not following the imaginary global warming trend.”
There. All good now.
Looks like the winter rules will stay in effect on the golf course for a while longer.
Nothing to see here, move along, move along………
Well, only till NASA-GISS, start fornicating with the temperature records, then watch those temps raise. With NASA-GISS, there always a heat wave cumming.
Reblogged this on CACA.
Damn! Damn! Damn!
Saint Al of the Gore
Steve, isn’t it disingenuous to post a dozen year old paper that avoids recent warming? Try more recent info such as:
http://data.giss.nasa.gov/cgi-bin/gistemp/show_station.cgi?id=431043600000&dt=1&ds=14
or
http://www.meltfactor.org/blog/?p=294
Does this report account for the massive increased scaling of geo-engineering in recent years? Just curious.