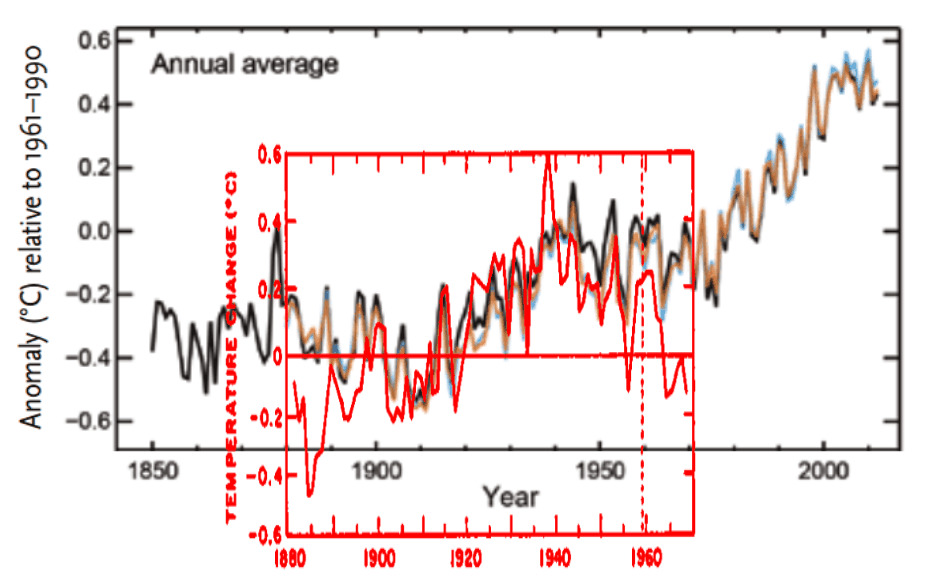
The National Academy of Sciences just released a new temperature graph (black and brown) which has been massively altered since their 1975 report (red.) Note that they have eliminated most of the 1940-1970 cooling.
dels.nas.edu/resources/static-assets/exec-office-other/climate-change-full.pdf
https://ia801806.us.archive.org/7/items/understandingcli00unit/understandingcli00unit.pdf
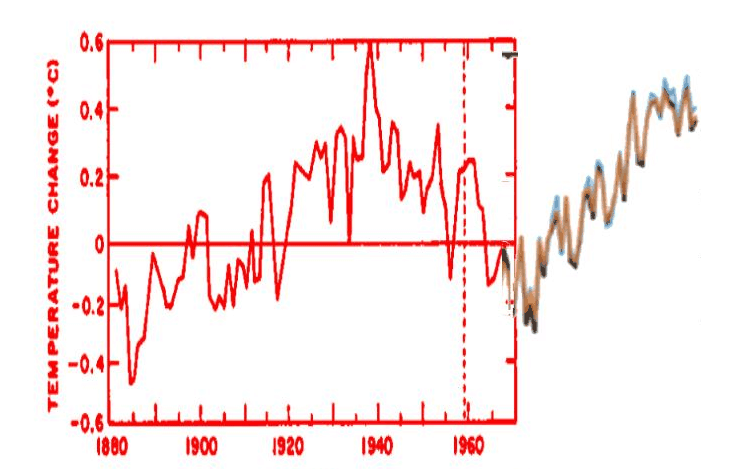
Here is why the have to eliminate the the 1940-1970 cooling and the 1940 spike. The next graph appends the post 1970 2014 data to the 1975 data, normalized to 1968. If they didn’t tamper with the data, there is no global warming since 1940.
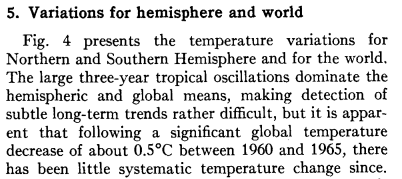
In 1978, NOAA reported 0.5C global cooling from 1960-1965. NAS has almost completely erased that.
journals.ametsoc.org/doi/pdf/10.1175/1520-0493(1978)106<0755%3AGTVSMA>2.0.CO%3B2
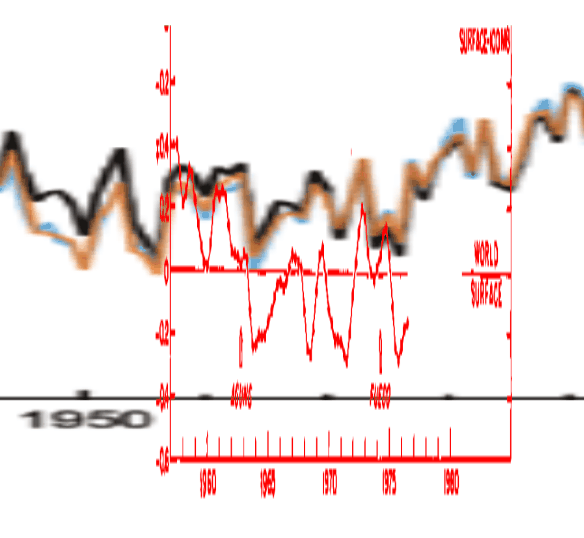
This graph shows the 1978 NOAA data in red, and the 2014 NAS data in black/brown. NAS has warmed 1965-1975 temperatures by about 0.3C.


I wouldn’t expect anything better from an organization that would hire admitted fraudster Peter Gleick as their climate ethicist. National Academy of Seance
These Global Warming fanatics certainly do have a religious fever that they are willing to do anything, say anything, deny anything and promote any wild and absurd claim that refutes facts that they can see with their own eyes. NON scientists that is exactly what this biggest HOAX on ”man-made global warming, global cooling and climate change, etc..,” it is a RELIGION TO THEM. These Green Nazis REALY DO BELIEVE IT, will lie for it, mislead because of it, fake data, forge readings, change the historical record and burn anyone at the stake that does not follow their faith. The MSM, CNN, ABC, NBC, CBS, MSNBC, NYT, NPR, Washington Post, New York Times and PBS covers for it’s obvious failures. The only funny thing will be to see how they spin, lie, obfuscate and mislead to continue the ruse and hoax. What arrogance, audacity and pretentiousness to ignore the facts, that you accused others of doing. These people are WRONG, and just will not admit it.
A couple years late, I know, but I believe it was the AGU, not the NAS, which chose fraudster, thief, liar & likely forger Peter Gleick as their chief scientific ethicist:
https://stevengoddard.wordpress.com/2012/09/16/ten-months-since-peter-gleick-named-head-of-agu-ethicks/
In their defense, they picked him a few months before his committed identity theft, defamation & forgery, to smear Heartland. But to their everlasting discredit, they did not immediately expel him from his membership in the organization, nor even fire him from his position as ethics chairman.
Gleick’s crimes didn’t seem to hurt his career. He was subsequently rewarded for his crimes by National Geographic‘s ScienceBlog subsidiary, where he’s now their resident “scientist, innovator, and communicator” on global water, environment, climate,
identity theft, fraud, character assassination, and forgery, and by Huffington Post, too.It’s just the congregation, and litany.
What is the official reason for the changes?
They don’t even acknowledge that the changes have occurred, much less give a reason for them.
NOAA has been “adjusting” the data and is quite upfront about it:
http://jennifermarohasy.com/blog/2009/06/how-the-us-temperature-record-is-adjusted/
http://www.ncdc.noaa.gov/oa/climate/research/ushcn/ushcn.html
http://stevengoddard.wordpress.com/data-tampering-at-ushcngiss/
http://www.sustainableoregon.com/data_adjustments.html
Interisting, has anyone besides you pointed this out?
Steve McIntyre and John Daly
In the 1960s NOAA director and air pilot during WWII; Joseph Fletcher, summarised the situation since 1940 (in 1970) [from: http://www.ocean-climate.com/g-global-cooling-from-1940-1970/ ]
as follows:
___”From about 1880 to 1940 the general but irregular trend was towards growing strength of global atmospheric circulation, northward displacement of the polar fronts, in both atmosphere and the ocean, northward displacement of the ice boundary in both Arctic and Antarctica, weaker developments of anticyclones over the continents and more northwards cyclone paths. These dramatic changes were reflected by a dramatic warming of the arctic and of the North Atlantic, and aridity of the south central part of North America and Eurasia . Conversely, recent decades have exhibited opposite trends: weakening planetary circulation southwards shifts of ice boundaries and cyclone paths and sharp cooling and different rain pattern over the continents”.
Excellent source material.
ITCS!
It’s The Cycles, Silly!
That page seems to have moved to:
http://www.seaclimate.com/g/g1.html
…and in a book, here.
As a historian, I am very happy to see people like Steve dig through the source material to uncover the truth. Keep up the great work.
On the other hand, I am appalled to see so-called scientists use adjusted data that differs from previously published data without even having a footnote explaining the changes. This is both bad science and bad history.
In “Climate of Extremes”, Professor Michaels (once State Climatologist for Virginia) explains that the raw field data is notoriously flawed and EVERYBODY adjusts the data. For example, some weather stations consistently report temperatures high or lower than other stations only a few miles away. So EVERYBODY corrects the data before they do any analysis. This is why other climate scientists and meteorologists want to see Mann’s corrected data sets. No other analyst can reproduce the hockey stick using any normal correction procedures, which suggests that the Warmists are intentionally removing data points that are accurately recorded. This is roughly the same as throwing out the guinea pigs that die after being injected with a test drug.
It suits their narrative, Michael, to not supply footnotes explaining the changes. But you know this without me telling you!
Can’t somebody issue and FOI to have access to the original data, the updated data, the data quality statements and the supporting documentation for (some/all) of the changes?
That’s been repeated tried. The Warmists consistently refuse to comply. And since they’re all being paid by government grants (or salaries), they do NOT own the data. Data produced at public expense is owned by the citizenry.
Ahh, the data is not theirs, but rather is from other official sources. That is who should provide the supporting documentation.
It might not be their data, but any good scientist (or historian) would verify the information before using it, especially if it was contradicted by other information.
Well, Steve, they are finally admitting it. (The other Penn State alleged or convicted felon did just say so).
Buit it was merely a “A Coinkadinky”. Peter, Michael, and another of your choosing (name your third stooge here) were just “Victims of Soycumstance”.
Nyuk, nyuk, nyuk!
Reblogged this on Power To The People and commented:
The National Academy of Science should rename themselves as The National Academy of Science Disinformation.
If they were financial graphs, the IRS would skin them alive.
When multi-trillion dollar policies worldwide are being based on this crap, it’s time to be held accountable.
Everything ?????? ??? ??????? ?? is ????? ???? ?? ?????? ??? fine. The ????? ??????? ???? Government ?????? ???? knows ????? ????? ??? best ?????.
Too true. There are a number of alarmists and government apparatchiks who should be behind bars as well. 😉
OT but on a similar theme.
http://www.bom.gov.au/climate/enso/
There is something wrong with all the ENSO model forecasts used by the BOM which includes NOAA and numerous other northern hemisphere organisations.
Every single one of them forecasts a rise! Not a single one forecasts a fall towards La Niña. Despite ENSO recently declining month on month! To me, that means all the models have a built in bias towards rising, and are thus all flawed.
Not to be a killjoy, but in your first graph above, the given links identify the red graph as for the northern hemisphere (Fig. 6a in the 1975 document), while the brown is for the whole globe (Fig. 4b in that recent document).
In the 1970’s there was little difference between hemispheres in published studies. That divergence was a contrivance invented later to kill off global cooling.
Our star is about to give up the ghost, and the lack of combined pressures (from the plasma above right down to the surface) noted in the past five SC’s maximums look to be impressive.
The total influence from our star is not measured in the spectrum output, but is fully realized in it’s influence through I/O quantities measured in field line contortions, interruptions in OLR along with surface deposition, and let’s not forget the planetary core connections that have been normal over these past 5 cycles.
Settled science infers the notion of Scientific Theory, and AGW has never fit the criteria.
Reblogged this on The Firewall.
Hello Steven,
Have you questioned The National Academy of Sciences?
Quite frankly they can burble on about anything they want but when it is changes to temps without an explanation I find that quite sinister,
I would love to get in the mind of the people who actually make those changes, do they feel guilty,
do they think they are correcting mistakes, I doubt it as they would be honest and come up with a reason for the change and argue it.
So my wish list for 2014.
I posted this on another thread of yours but it would be good to have a dedicated website to all temp graph changes made. I want to click and see them laid out straight away, I want to be able to post that website, refer people to it. I want graphs blinking at me showing the before and after in red!
Great idea. Problem for the true believers, this is their religion and you don’t question religion, don’t you? They probably view it as “corecting” past measurements, not making the data fit their predictions.
sort of like this but more refined.
https://www.google.co.uk/search?q=temp+graph+changes+made&tbm=isch&tbo=u&source=univ&sa=X&ei=V7kQU7LaEdT07AaVp4DwBQ&ved=0CDUQsAQ&biw=1022&bih=670
This is blatant corruption! Actually, it’s worse… it’s scientific fraud. And we’ve known for some time now that this manipulation has been happening because it is the only way for global warming alarmists to reinforce their message to try any persuade the public about dangerous global warming… just look at the cooling of the past temperature record of New Zealand by NIWA, which came to be known as Kiwigate!
The revisions were not as severe as it appears, because the 1975 version was actually just Northern Hemisphere temperatures. Note the caption:
http://www.sealevel.info/NAS_1882-1968_NH_temperatures_from_1975_NAS_Report.png
Here’s the whole report:
https://ia801806.us.archive.org/7/items/understandingcli00unit/understandingcli00unit.pdf
(The graph is on p.148, which is p. 173 as Adobe numbers the pages.)
Sorry for the very tardy post. I just noticed it.
The 1975 NAS Report doesn’t show a graph of southern hemisphere or global temperatures, but Hansen’s 1981 paper does:
http://www.sealevel.info/Hansen_1981_Fig3_original.png
Unfortunately, it doesn’t include a directly comparable “northern hemisphere” graph, because Hansen divided the world into three zones: above 23.6°N, below 23.6°S, and “low latitudes” (between 23.6°N and 23.6°S). Here’s the paper:
http://www.sealevel.info/1981_Hansen_etal_1.pdf