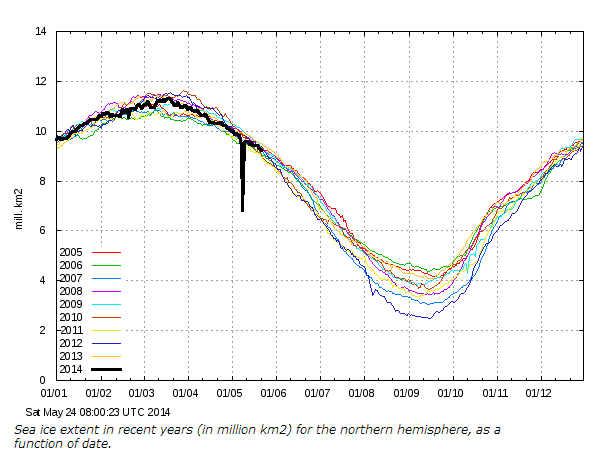
During his 2007 Nobel prize acceptance speech, Al Gore predicted an ice-free Arctic in 2014. Earth only has ice for 100 more days.
COI | Centre for Ocean and Ice | Danmarks Meteorologiske Institut
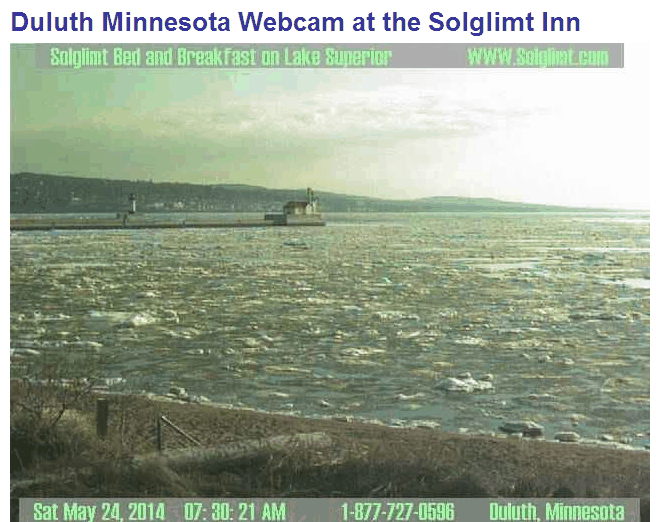
But first he needs to melt the ice off the Great Lakes, on Memorial Day weekend.


Gore lied,
Biden lied,
Obama lied,
http://notalotofpeopleknowthat.wordpress.com/2014/05/24/kerry-caught-lying/
Maybe Gore is hoping for Return of the Arctic Death Spiral!
The graph could get interesting…Joe Bastardi and Anthony Watts report that NOAA (NOAA! of all groups) is predicting above “normal” Arctic ice extent at the time of maximum melt!
http://wattsupwiththat.com/2014/05/23/sea-ice-news-volume-5-2-noaa-forecasts-above-normal-arctic-ice-extent-for-summer/
If you project the present trend (linearly) from the DMI graph above you’ll get the same result for mid September, close to average or above, possibly before September.
Linear extrapolations are useful only to those trying to extort money from the public purse.
Superior is also headed toward record high water levels:
http://www.glerl.noaa.gov/data/now/wlevels/data/superiorLevelsFeet.png
8 inches above normal May. Already above seasonal Max average.
Also colder (obviously):
http://coastwatch.glerl.noaa.gov/statistic/gif/avgtemps-s_1992-2013.gif
Bottom line: Superior is headed to 603 and with less Fall/Winter evaporation, will smash records if they don’t dump it. Look for IJC to continue to increase releases like they already have been.
So, about this time last year, our friendly rowers were getting all excited and planning their Northwest passage fiasco. Thought I’d check out the NWP action planned for the 2014 year, and I came across this swindle.
http://silverseacruises.in/itinerary/7418/?gclid=CKHF7ZTLxr4CFcWSvQodHIwAQQ
Yes, if you have a spare $85,000, you too can spend 23 days ice-bound around Greenland!
NORSEX show similar estimate, with present extent only below 2009, 2012 and 2013,
http://arctic-roos.org/observations/satellite-data/sea-ice/observation_images/ssmi1_ice_ext.png
The DMI graph shows the ice also above 2005 and 2006.
So far the present anomalies are comparing well with 2005.