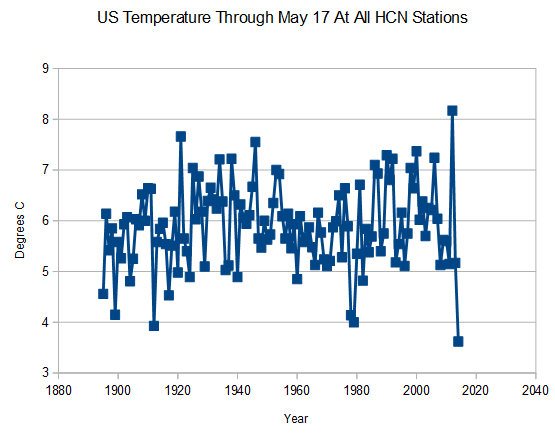
Temperatures through May 17 have been the coldest on record in the US
Disrupting the Borg is expensive and time consuming!
Google Search
-
Recent Posts
- “Why Do You Resist?”
- Climate Attribution Model
- Fact Checking NASA
- Fact Checking Grok
- Fact Checking The New York Times
- New Visitech Features
- Ice-Free Arctic By 2014
- Debt-Free US Treasury Forecast
- Analyzing Big City Crime (Part 2)
- Analyzing Big City Crime
- UK Migration Caused By Global Warming
- Climate Attribution In Greece
- “Brown: ’50 days to save world'”
- The Catastrophic Influence of Bovine Methane Emissions on Extraterrestrial Climate Patterns
- Posting On X
- Seventeen Years Of Fun
- The Importance Of Good Tools
- Temperature Shifts At Blue Hill, MA
- CO2²
- Time Of Observation Bias
- Climate Scamming For Profit
- Climate Scamming For Profit
- Back To The Future
- “records going back to 1961”
- Analyzing Rainfall At Asheville
Recent Comments
- Bob G on Climate Attribution Model
- Bob G on Climate Attribution Model
- Bob G on Fact Checking NASA
- arn on Climate Attribution Model
- Bob G on Climate Attribution Model
- Bob G on Climate Attribution Model
- Bob G on “Why Do You Resist?”
- Gerald Machnee on Fact Checking The New York Times
- Gerald Machnee on Climate Attribution Model
- Gerald Machnee on “Why Do You Resist?”


No warming since 1920.
What is amazing about this is, it is colder than the global cooling years of the 70’s yet the climate change has said the following. Crickets.
That is a lovely graph, to a real scientist, showing the substantial natural variability, on an annual basis, as well as the overall, or long-term, stability. Amateurs will want to draw a “trend line” through all the data (although it is of little value, in the presence of such variability), and say it shows long-term warming; but the professional knows you have to note the pattern of the majority of the data, which is the dense portion that hugs 6°C, more or less (and indicates a long-term natural variability of only about 0.5°C–a value I have been pointing out recently, to emphasize the true stability of the global mean temperature, even over thousands of years, and which is in accordance with the confirmation of the stable Standard Atmosphere model in my definitive 2010 Venus/Earth temperatures comparison).
Yes, but you didn’t add the magic warming adjustment. When you do, you will see that the arctic is a boiling pit of acid with dead polar bears everywhere.
LOL
I noticed that it’s rather mild for May in central Texas. Had to wear a sweater the other day most of the day.
Lou, can you see the glacier from your back yard yet?
http://austin.twcnews.com/content/news/299219/record-low-temps-ahead-of-pleasant-weekend
I am in mid NC and it fells like there is a glacier sitting outside the door! I have on woolly socks, a sweatshirt and I am STILL cold. It was 47 °F last night and forecasted to go down to 46° F tonite. Normal lows are ~ 60° F and highs of 80 °F with 90 °F not that uncommon.
BRRRRrrrr went to 45 °F over night and is now up to 54 °F @ 9:30 am
Lou might not, but if I stand on my tip toes I think I can see if from St. Paul though.
… but according to your own graph… 2011 was the hottest spring on record… If we went back in time I wonder what the skeptics had said at the time?
Overall I don’t believe in AGW…. hell, any fool knows that variables vary… we have highs and lows… cherry picking events which back your beliefs rules the day today…
GRAPH: number of State record high and low set per decade
It is interesting that the 1930 had the most record highs AND RECORD LOWS. A WAG would be this was due to a change in the jet stream configurations (more loopy jets) allowing Blocking Highs and Polar Vortices.
The other interesting fact is the Laurentide Ice Sheet follows the same configuration as the ‘Polar Express’ – the Polar Vortices that invaded the USA this winter and during the 1970s.
That it doesn’t mean that subsequent spring temperatures will be unusually warm. Funny how that worked out.
The new T-Shirts are out:
“I’ve Done my Part To Prevent The Next Ice Age, How About You” 😉
One little thing Steven.. When drawing your graphs, can you downsize the blobs at the points.. They look sort of very ordinary with a default Excel size.
(Who ever wrote excel needs a good clip about the ears from some of the default settings !!)
I’d make that both ears and the back of the head.
Bring back VisiCal on CPM!
R !
🙂
“Scientists” say that Sea Turtles benefit from your SUV!
http://www.abc.net.au/science/articles/2014/05/19/4006274.htm
The Sea turtle are endangered species, so we must all drive SUV’s to save them.
Alarmists want to destroy global sea turtle populations by cutting back on CO2!!
Basically EVERY animal or plant on Earth benefits from raise atmospheric CO2..
The demonization of CO2 is one of the most moronic things every done in the name of science.
LIFE LOVES CO2 !!!!!!!!!!!!!!!!!!!!!!!!!!!!!!!!!!!!!!!!!!!!!!!!!!!!!!!!!!!!!!!!!!!!!!!!
Perhaps the Warmists don’t just hate Man, they hate ALL life. They see Man as a plague on the planet. We don’t know that they don’t hate worms and birds and fish, too. All poop on their sacred Gaia.
aww come on now, that’s just ‘weather’.
note again that rise through the 1940’s .
It was much colder back then, now.
I really don’t understand the warmists … they say they don’t want warming, yet they do everything they can to create it. Very strange behaviour.